
Introduction
Hepatic encephalopathy (HE) is a consequence of liver dysfunction. The neurological manifestations range from subtle cognitive deficits (minimal HE – MHE) to deep coma (overt HE) [1]. Minimal HE is only detectable by psychometric tests, such as the psychometric hepatic encephalopathy score (PHES) or the critical flicker frequency (CFF), as cognitive impairment is not readily apparent. Due to the lack of standard diagnostic criteria for MHE, it is difficult to distinguish cirrhotic patients with MHE from those without HE. Furthermore, as some of these patients will develop overt HE in the future [2], it is crucial to detect MHE as soon as possible to prevent any cognitive complications.
Magnetic resonance spectroscopy (MRS) provides information regarding the metabolic composition of tissues. Proton MRS of the brain primarily detects lactate (an end-product of anaerobic glycolysis), N-acetyl aspartate (NAA; considered a neuronal marker), glutamate, and glutamine (substrate and precursor of the amino acid involved in the excitatory neurotransmission), creatine (Cr) and phosphocreatine (metabolites of the energetic reservoir), choline (Cho) derivate (cell membrane components), and myo-inositol (mI) [3].
Cirrhotic patients with HE were found to have increased cerebral water that was analyzed by magnetic resonance (MR) either directly or indirectly. The water supplement was associated with an increase in cerebral ammonia level, but the timing of the event was unclear. Quantitative MR experiments demonstrated increased brain water content in cirrhotic patients as HE progressed [4].
Changes in 1H-MRS and apparent diffusion coefficient (ADC) values precede other magnetic resonance imaging (MRI) indications, allowing for early detection of MHE. Minimal HE anticipates the appearance of overt HE in patients with cirrhosis of the liver [5], the impairment of driving abilities [6], and an increase in the risk of falling [7]. Consequently, this study sought to demonstrate the role of functional MRI (MRS and ADC value) in the evaluation and grading of HE in cirrhotic patients.
Material and methods
Patient selection
A prospective cohort study was conducted from June 2018 to January 2020 in the Diagnostic Medical Imaging and Interventional Radiology Department and the Hepatology and Gastroenterology Department, National Liver Institute Hospital, Menoufia University. The participants were separated into three groups. Group I consisted of 20 healthy controls, group II consisted of 25 patients with liver cirrhosis and MHE, and group III consisted of 25 patients with liver cirrhosis and overt HE. The patients were clinically evaluated and detailed history was taken along with a comprehensive physical examination with a focus on the main symptoms of HE. These symptoms include an altered level of consciousness, asterixis, icterus, and inverted sleep pattern.
The PHES consists of a battery of psychometric tests designed specifically for the diagnosis of MHE. These include the number connection test (NCT), line tracing test, and number symbol test [8]. Also included are cognitive evaluations such as CFF. Imaging techniques (e.g., abdominal ultrasonography, computed tomography [CT] scan), clinical examination, and biochemical data were used to diagnose liver cirrhosis.
Patients with gastrointestinal bleeding within 24 hours of study entry, patients with uncontrolled infection (sepsis) or hyponatremia with hemodynamic instability requiring vasopressors, patients on renal replacement support therapy, patients with prior liver transplantation, and patients with irreversible brain damage indicated by the neurological examination and CT imaging (hemorrhage, infarction, multiple sclerosis, and Alzheimer’s disease) were excluded from this study. The patients in the control group had no history of neurological or psychiatric symptoms, metabolic disorders, alcohol or drug abuse, head injury, or liver disease. All patients underwent a comprehensive clinical examination, which included neurological tests. Written informed consent from each participant or their family members, as well as approval from the ethics committee, was obtained before participation in the study.
Neuropsychological test
The PHES consists of a series of psychometric tests and was designed specifically for the diagnosis of MHE. It includes a serial-dotting test, a line tracing test, two types of number connection tests, and a digit symbol substitution test. Patients were considered to have MHE [9] if their CFF score was less than the cutoff value (39 Hz). The device utilized stepwise frequency reduction from 60 to 25 Hz.
Assessment of liver disease severity
One week before MRI examination, biochemical tests, including alanine aminotransferase (ALT) (U/l), albumin (g/dl), aspartate aminotransferase (AST) (U/l), total and direct bilirubin levels (mg/dl), prothrombin concentration (%), international normalized ratio (INR), urea (mg/dl), and creatinine (mg/dl), were performed on all patients. The above laboratory tests were used to calculate the Child-Pugh score [10] to determine the severity of the liver disease. Model of end-stage liver disease (MELD) was determined using the following formula [11]:
MELD = 3.78 × ln [serum bilirubin (mg/dl)] + 11.2 × ln [INR] + 9.57 × ln [serum creatinine (mg/dl)] + 6.43.
Grading of hepatic encephalopathy
For grading HE, the West Haven criteria were applied. Patients were categorized into four distinct grades. In grade I, patients exhibited a lack of focus and subtle personality changes, which were primarily noticeable to their relatives. In grade II, the most intriguing finding was time disorientation combined with, for instance, inappropriate behavior and lethargy. Patients in grade III were stuporous but responsive to stimuli. They were also disoriented with respect to place and circumstances and sometimes exhibited bizarre behavior. Patients in grade IV patients were in a coma [12].
Proton magnetic resonance spectroscopy
Quantitative analysis of brain metabolites was performed with proton magnetic resonance spectroscopy (1H-MRS) using a 1.5 T GE scanner (Optima MR450w) for quantification. First, 2D-T2WI data were obtained in the axial regions for image-guided localization of the voxels of interest. In the basal ganglia or thalamus, MRS analysis was conducted. 1H-MRS was performed using the STEAM sequence with the following parameters: TR = 1102 ms; TE = 144 ms; voxel size = 20 × 20 × 20 mm. The concentrations of the glutamate/glutamine complex (Glx) were 2.35 ppm, mI 3.55 ppm, Cho 3.22 ppm, Cr 3.02 ppm, and NAA 2.01 ppm. All MRS metabolites were moved to a workstation enabling operator-independent quantification. Calculations of Glx, mI, Cho, NAA, and Cr integrals were performed with respect to Cr, including Glx/Cr, mI/Cr, Cho/Cr, and NAA/Cr. Integral ratios of various metabolites were calculated [13].
Diffusion-weighted MRI (DW MRI)
Single-shot spin-echo echoplanar imaging was used to perform DWI MRI. On each of the three physical axes, x, y, and z, diffusion weighting gradients were applied using b factor values of 1000 mm2/s. Scan parameters included TR/TE = 4000/1000 ms, FOV = 240 mm × 240 mm, slice thickness = 5 mm, number of averages = 1, matrix = 96 × 128 pixels, and an interslice gap = 0.5 mm.
After applying diffusion-weighted sequences, a group of images related to the b value was applied. The ADC map was calculated automatically using available software. The mean ADC was determined in manually drawn regions of interest placed in various brain regions (globus pallidus, putamen, thalamus, and corona radiata). The time required to acquire data for diffusion-weighted MR images was 1 min [14].
Calculation of The ADC value can be done using the following formula: ADC = (InSb – InSb1)/(b2 – b1), where In is the natural log and Sb1 and Sb2 are the signal intensities of the region of interest (ROI) placed on sections corresponding to the b value. Automatic calculation of the ADC value is possible in 10-3 mm2/s [15].
Statistical analysis
Statistical analysis was performed using SPSS version 22. All of the data had a parametric normal distribution. The purpose of the data analysis was to identify statistically significant differences. The difference between laboratory parameters, metabolite ratios, and ADC values was analyzed using a one-way ANOVA. The chi-square test was used to compare qualitative variables, whereas the Mann-Whitney test was used to compare quantitative continuous data. The accuracy of the study models was compared using the area under the receiver operating characteristic (ROC) curve for each scale. Logistic regression analysis was used for qualitative variables and linear regression analysis was used for quantitative variables. A p-value of less than 0.05 was considered statistically significant.
Results
The participants were separated into three groups: group I – 20 healthy controls, group II – 25 cirrhotic liver patients with MHE, and group III – 25 cirrhotic liver patients with overt HE. All participants were between the ages of 43 and 58, with a mean age of 50.8. Most patients were male (52.9%), with no significant difference in gender distribution among the groups being studied (p = 0.75).
As shown in Table 1, there were significant differences in albumin, total and direct bilirubin, platelets (p = 0.001), and INR (p = 0.02), but no significant differences in ALT, AST, and Cr levels among the groups being studied (p = 0.11, 0.23, and 0.54, respectively).
Table 1
Laboratory parameters among different groups
Severity of liver disease was assessed according to the Child-Pugh classification as shown in Table 2, and we found that 80% of MHE patients were Child class A or B while overt HE presented with Child class B or C. Child class C represented 80% of patients who presented with overt HE (n = 20, p = 0.001).
Table 2
Hepatic encephalopathy (HE) grade, Child-Pugh classification and MELD score of all studied patients
We determined the MELD score for all the patients studied. The mean ±SD of MELD was significantly higher in patients with overt HE (19.5 ±3.9) compared to those with MHE (13.6 ±2.6) (p = 0.001).
The MRS characteristics in the basal ganglia or thalamus demonstrated an increase in the brain metabolite Glx with a significant correlation to the presence and grade of HE, as we found its presence with low amounts in the control group, whereas in overt HE, we found large amounts of Glx in the brain with a significant difference (p = 0.001). Other brain metabolites, such as Cho and mI, were present in large quantities in the control group, as shown in Figure 1, which displayed a normal MRS evaluation spectrum. However, in the overt HE groups, we observed a significant decline in their quantities (p = 0.001). Two brain metabolites (NAA and Cr) were not significantly different between all grades of HE and the control groups (p = 0.47 and 0.38, respectively) (Table 3, Fig. 2).
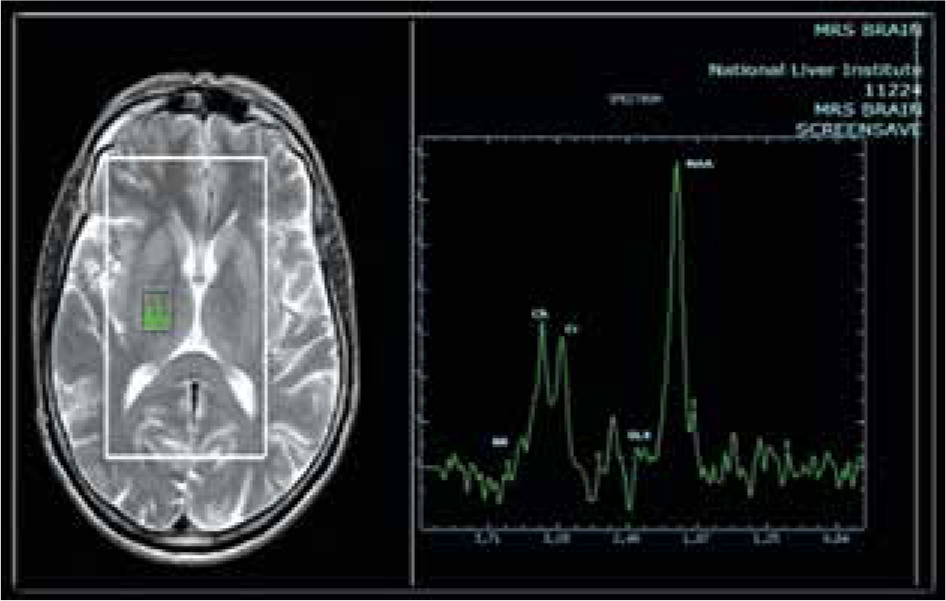
Fig. 2
Magnetic resonance spectroscopy (MRS) in: A) a healthy patient, B) a cirrhotic patient with minimal hepatic encephalopathy (MHE), and C) a cirrhotic patient with overt HE showing increase of glutamate/glutamine complex (Glx) in cirrhotic patient with MHE and marked increase of Glx in cirrhotic patients with overt HE, decrease of myoinositol and choline values in cirrhotic patient with MHE and marked decrease in cirrhotic patient with overt HE. The region of interest (ROI) was located in the thalamus on MRS
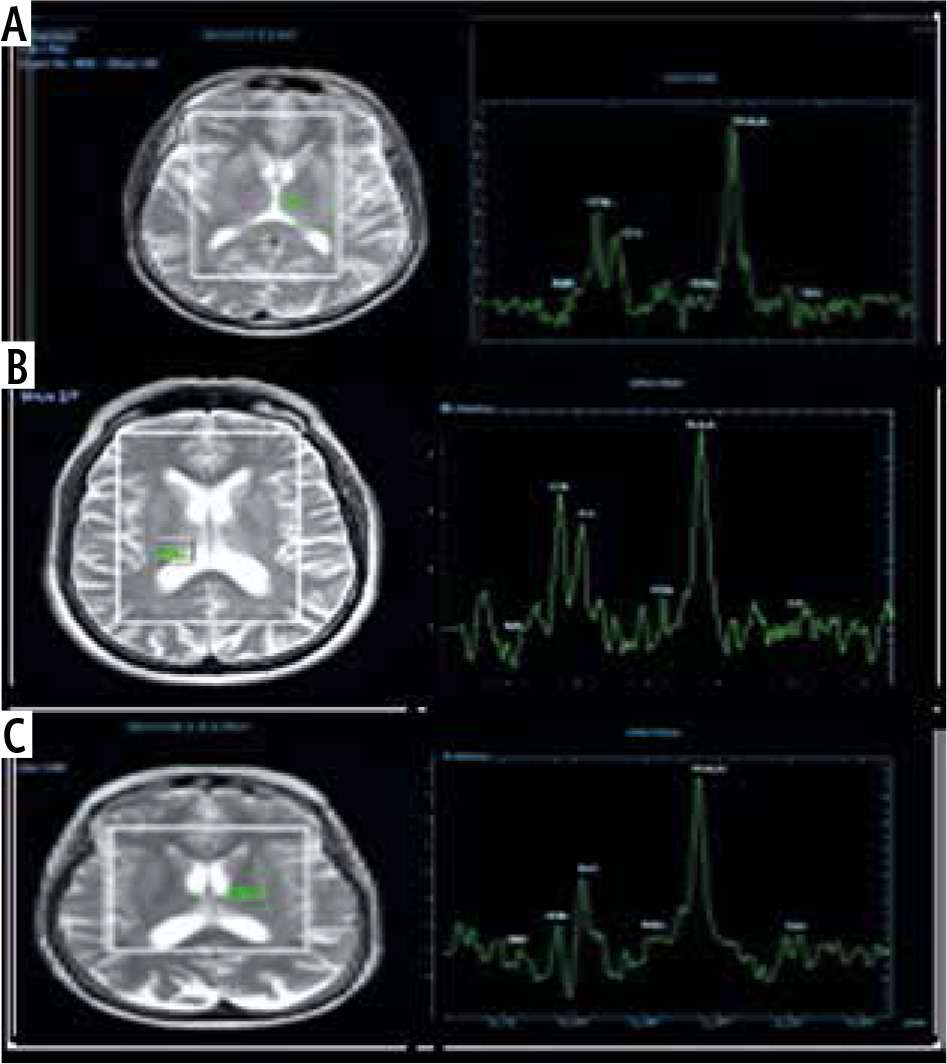
Table 3
Proton magnetic resonance spectroscopy of control and cirrhotic patients with different grades of hepatic encephalopathy (HE)
In cirrhotic patients with MHE and over HE, the ratios of integrals of various metabolites were calculated and revealed that Glx/Cr was significantly increased, whereas mI/Cr and Cho/Cr were significantly decreased. There was no significant difference in NAA/Cr ratio (Table 4).
Table 4
Proton magnetic resonance (MR) spectroscopy ratios of control and cirrhotic patients with different grades of hepatic encephalopathy (HE)
Compared to the control group, the ADC values of cirrhotic patients with HE were significantly higher. There were no significant differences between cirrhotic patients with MHE and those with overt HE in different brain regions. As shown in Table 5 and Figures 3 and 4, there was no statistically significant difference in ADC values between brain regions.
Fig. 3
Apparent diffusion coefficient (ADC) values in different brain regions of a patient with cirrhosis and minimal hepatic encephalopathy (MHE)
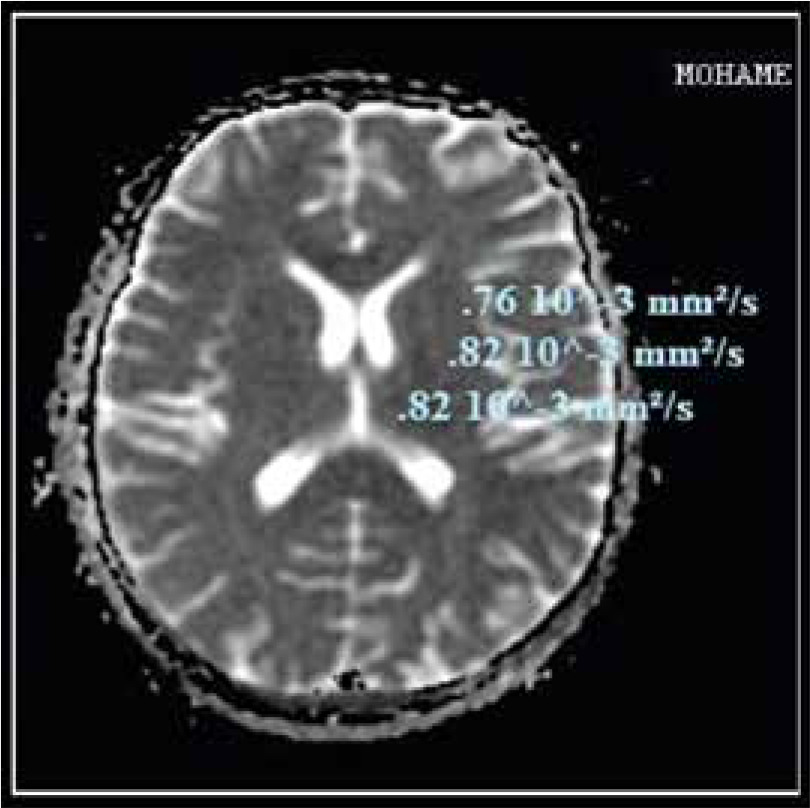
Fig. 4
Apparent diffusion coefficient (ADC) values in different brain regions in cirrhotic patient with overt hepatic encephalopathy (HE)
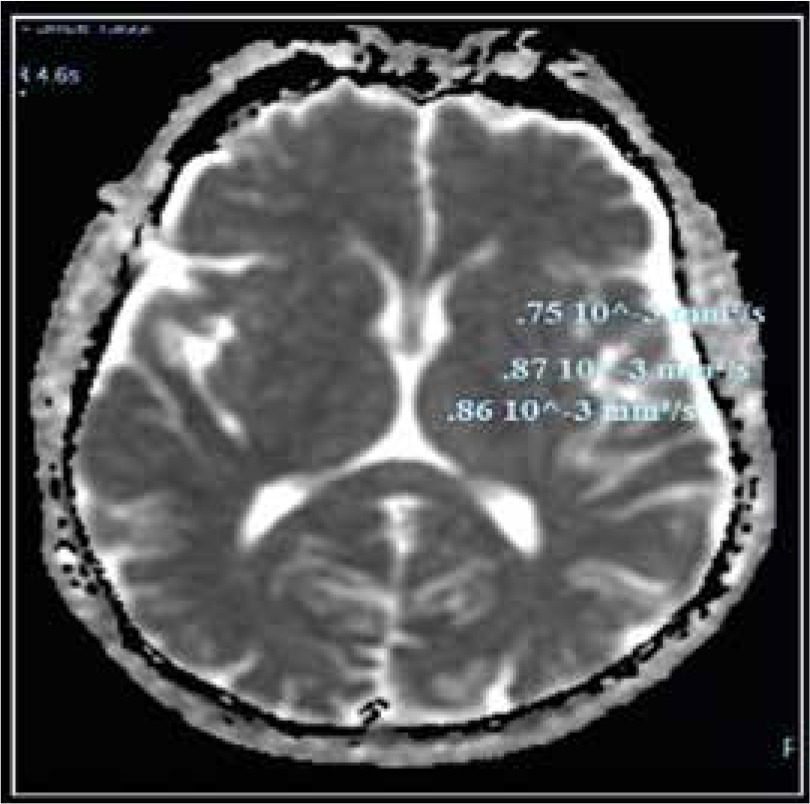
Table 5
Apparent diffusion coefficient (ADC) values (10-3 mm2/s) of different brain regions and correlation with grades of hepatic encephalopathy
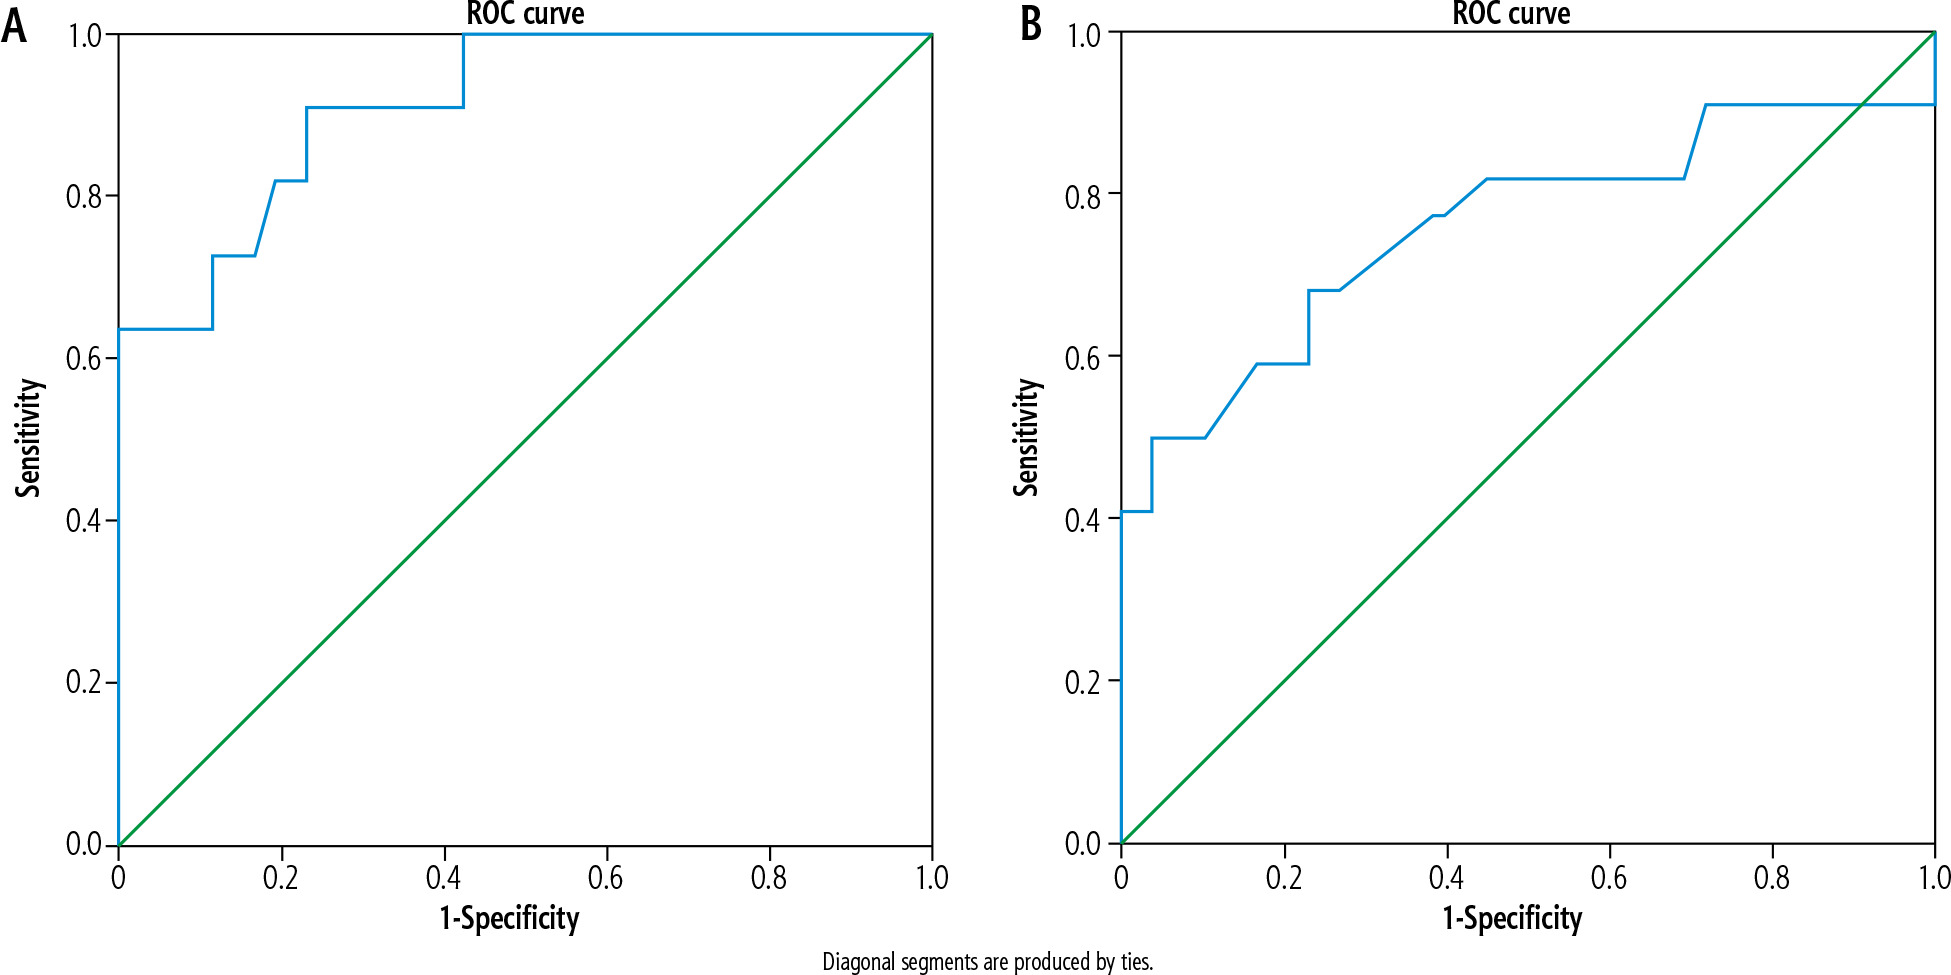
For improved evaluation of the optimal cutoff point of brain metabolites that influence HE grade, the ROC was used to analyze the Glx/Cr and mI/Cr ratios. This value demonstrated a marked and significant increase in the ratio of Glx/Cr and a decrease in the ratio of mI/Cr. The area under the curve (AUC) for the Glx/Cr ratio reached 0.914 at the cutoff point of 0.58, with a sensitivity of 90.9%, specificity of 74.4%, and accuracy of 78%, as shown in Figure 5A. The positive predictive value (PPV) was 65%, and the negative predictive value (NPV) was 97%.
Figure 5B displays an excellent AUC for the mI/Cr ratio; the AUC reached 0.902 at the cutoff value of 0.15, with a sensitivity of 86%, specificity of 87%, and an accuracy of 87%. PPV was 65%, and NPV was 95%, respectively.
Fig. 5
A) Glutamate-glutamine/creatine ratio in diagnosis of hepatic encephalopathy. B) Myoinositol/creatine ratio in diagnosis of hepatic encephalopathy (HE)
Logistic regression analysis revealed that Glx, mI, Glu/Cr ratio and mI/Cr ratio were significant variables for diagnosis of hepatic encephalopathy, as shown in Table 6.
Table 6
Logistic regression analysis of significant variables (reference category is minimal hepatic encephalopathy)
Discussion
Neurotransmission abnormalities were explained by an imbalance between the inhibitory and excitatory neurotransmission systems in HE, resulting in an increase of intra-astrocytic glutamine due to high ammonia levels [16].
1H-MRS is used to assess diffuse brain metabolic disorders [17]. 1H-MRS is based on the evaluation of proton relaxation in a small volume of tissue to obtain a spectrum of signals dependent on frequency, with each metabolite occupying a specific position along the spectrum [18].
The alterations of brain metabolites in cirrhotic patients were tracked using 1H-MRS. Studies using proton spectroscopy revealed an increase in glutamine and glutamate peaks proportional to the severity of HE [10]. These findings corroborated our findings, which demonstrated a significant increase in the Glx in patients with overt HE and MHE compared to the control group. The ratio reached its highest point in the overt HE group and its lowest point in the control group. Compared to the control group, we observed a significant decline in mI that was correlated with the severity of HE, whether it be MHE or overt HE. In addition, we detected significantly lower levels of choline derivatives in the MHE and HE groups compared to the control group.
These metabolite changes were consistent with the findings of Zhang and Zhang, who observed that neuropsychiatric impairment in HE patients is correlated with the presence of a triad consisting of intracellular Cho and myo inositol (mIns) depletion as well as Glx accumulation. The astrocytic swelling hypothesis was supported by 1H-MRS findings [19].
Typically, astrocytes detoxify ammonia, resulting in intracellular glutamine accumulation. As a highly osmotically active substance, glutamine draws extracellular water into astrocytes, causing astrocyte swelling [20].
Choline is considered a component of both phosphocholine and glycerophosphorylcholine, which are both involved in cell membrane motivation [21]. Memory, recognition, and emotions are associated with acetylcholine, which is regarded as a crucial neurotransmitter, and Cho is regarded as a crucial element for the synthesis of acetylcholine. Moreover, Cho deficiency may contribute to HE’s cognitive deficit [22].
Our results revealed no statistically significant differences in NAA, which was consistent with the findings of numerous studies that found no differences in NAA levels between control groups and cirrhotic patients with HE. It was erroneously believed that neural changes in HE patients played no or a minor role in explaining the neuropsychiatric changes. However, it has been demonstrated that significant neuronal cell loss occurs in the brains of HE patients [22].
In cirrhotic patients with MHE and overt HE, the ratios of integrals of various metabolites were calculated and revealed that Glx/Cr was significantly increased, whereas mI/Cr and Cho/Cr were significantly decreased, and there was no significant difference in NAA/Cr ratio.
Regardless of its role in the pathogenesis of HE, glutamine level, as measured by MR spectroscopy, may be a useful biomarker for the diagnosis of challenging cases [23].
Moreover, changes in 1H-MRS occur before other MRI indicators, allowing for an early diagnosis of MHE. High-field 1H-MRS with a homogeneous magnetic field can demonstrate even subtle alterations in the normal MR spectrum of the above-mentioned metabolites, making it a valuable tool for diagnosing MHE [23].
In our study, cirrhotic patients with HE had significantly higher ADC values in different brain regions than control groups. However, there was no significant difference between cirrhotic patients with MHE and overt HE. These results were consistent with those of Chen et al., who observed an increase in the mean ADC value in patients with chronic liver failure, but did not detect differences in ADC values between patients with and without overt HE [24].
Reasonable explanations of the increase in the mean ADC value without demonstrating significant changes in ADC values between patients with and without overt HE include the extracellular migration of macromolecules during the cellular osmoregulatory mechanism, which is stimulated by an increase in astrocytic glutamate or an increase in the permeability of the blood-brain barrier. The explanation for cerebral capillary water influx was based on the fact that hyperammonemia may increase blood-brain barrier permeability [25].
Minimal HE is defined as the presence of cognitive abnormalities in patients with liver disease that are not detected by standard examinations and can only be diagnosed via sensitive neurophysiological tests [26]. MHE predicts overt HE development in cirrhotic patients [5], impairs the ability to operate a motor vehicle [6], and increases the risk of falling over [7]. Therefore, the results of our study varified the important role of 1H-MRS and ADC values in detection and grading of HE, particularly MHE.
There were some limitations to this investigation. First, we performed a single voxel study of the thalamus of the basal ganglia using a 1.5-Tesla scanner. The results can be improved in future studies by using a 3-Tesla scanner with multivoxel chemical shift imaging, advanced post-processing, and quantitative assessment of metabolites, as well as separations of Glx to represent glutamate and glutamine separately. The application of diffusion tensor MR imaging and new post-processing methods such as non-Gaussian (diffusion kurtosis) modeling or K-means clustering algorithms must be available to achieve better results, including global assessment of brain diffusion, as shown in further studies [27]. After treatment, there was no follow-up with these patients.
Conclusions
Apparent diffusion coefficient values and MRS can detect MHE as imaging modalities. MRS is an excellent method for evaluating the severity of HE and differentiating between patients with HE. There is a need for additional research on a large scale involving patients who are followed up after treatment.


