
Introduction
Melanoma is one of the most aggressive and complex cancers [1]. Despite advances in molecular medicine, the prognosis of melanoma sufferers is still not satisfactory. The proposed psiRNA-based therapy is a promising gene therapy for cancer probably due to its low toxicity and high specificity. The conducted study focused on inhibiting gene SOX10 and VEGF expression in melanoma cells, indicating that silencing of the transcription factor and the well-known vascular endothelial growth factor has an antiangiogenic potential in the treatment of cancer.
The process responsible for tumour vascularisation is angiogenesis, in which the members of the vascular endothelial growth factor (VEGF) family play a key part [2]. The VEGF/vascular endothelial growth factor receptor (VEGFR) signalling pathway in tumour endothelial cells stimulates their proliferation and migration, and also results in formation of blood vessels and permeability of their walls [3]. However, it should be remembered that tumour cells are characterised by constituent activation of the oncogenic signalling cascade [4], affecting the effectiveness of therapy, including anti-VEGF, which has failed in many indications of tumour size reduction, its spreading or vascularisation [2]. It is worth mentioning that VEGF can also be a stimulator of tumour growth, regardless of its proangiogenic effect. VEGF is synthesized by many types of cells in an environment with an insufficient amount of oxygen [5]. It has been found that most cancer cells in melanoma have receptors for VEGF on their surface, and by autocrine or paracrine action it activates signalling pathways, resulting in increased tumour proliferation [6, 7]. In addition to angiogenesis, VEGF activates processes related to extracellular matrix redevelopment, cell migration, invasion, immune response inhibition and promotes the cancer stem cell (CSCs) [3, 8–11].
SOX10 (Sry-related HMG-box-10) is a member of the SOX family of transcription factors, which plays a prominent role in the development of the neural crest and melanocyte cell line [12]. SOX10 regulates the proliferation, survival and melanogenesis of melanocytes by activation of target genes including MITF, Dct, Tyr and Tyrp1 [13]. In addition, previous in vivo studies, which inhibited SOX10 expression confirmed that this factor is important in the initiation and maintenance of melanoma [14–16] and promotes the migration and invasion of cancer cells [17]. In the case of melanoma, SOX10 is a specific marker for the detection of cancer stem cells [18] that are accumulated in vascular niches [19]. It is a distinct region in a tumour microenvironment in which there is a persistent oxygen deficiency [9, 20] that creates ideal conditions for regulation of the SOX10 gene [21, 22]. CSCs exhibit resistance to hypoxia and work closely with endothelial cells contributing to the continuous activity of proangiogenic agents, including VEGF [9, 20].
Aim
The study evaluated the effect of psiRNA silencing preparations of the VEGF and SOX10 on melanoma (B16-F10) in order to increase antiangiogenic activity leading to inhibition of tumour growth in in vitro and in vivo studies.
Material and methods
Cell culture
Cells of the mouse melanoma B16-F10 (ATCC® CRL-6475™) were grown in DMEM + GlutaMAX medium (GIBCO) with the addition of 10% FBS (GIBCO) and antibiotics AAS (penicillin, streptomycin, amphotericin B, Sigma-Aldrich). AAS antibiotics were as the so-called local, multiannual standard, for safety reasons of research conducted on various cell lines in the Cell Culture Laboratory. It is worth stressing that the culture of the B16-F10 cell line was maintained in the facility for many years. The cells were grown in standard conditions at 37°C, with optimum humidity with 5% CO2.
Plasmids
The following plasmids have been used in the studies: psiRNA-LucGL2 (InvivoGen) – negative control, psi-RNA-mVEGF (InvivoGen), psiRNA-7SK-GZ-mSOX10 (InvivoGen) and psecVEGF – positive control. The plasmids used for the study contain a sequence of gene coding for a green fluorescence protein (GFP).
Non-viral carriers
LyoVec™ (InvivoGen) is a freeze-dried, cationic reagent for transfection based on lipids belonging to the new phospholipid family [23, 24].
In vitro cell transfection
Cells B16-F10 were sown in a density of 3 × 10⁵ on a pan with a diameter of 6 cm, in DMEM + GlutaMAX with 10% FBS and AAS antibiotics, which were incubated for 24 h under standard conditions. Prior to transfection, the culture medium was replaced with fresh, and the complexes produced contained plasmid or plasmids (psiLuc, psiVEGF, psiSOX10 or psecVEGF) in conjunction with the LyoVec™ carrier. The transfection was conducted in accordance with the manufacturer’s protocol (60–70% of cell confluence; 6 mg of plasmid: 200 ml of LyoVec™). In the case of two plasmids in one psiRNA formulation, the proportions were as follows – 6 mg of plasmid + 6 mg of plasmid: 200 mg of LyoVec™. Each of the created psiRNA formulations has been supplemented to 210 mg of 0.9% NaCl. Cell incubation after plasmid/carrier introduction was administered, was continued for 48 h. The effectiveness of transfection was assessed with the use of a fluorescent microscope (Olympus IX53) and a fluorescent cell counter (Thermo Fisher Scientific).
Western blot
The test assays were lysed in the lysis buffer (1% NP40 at 20 mM Tris; HCl pH 7.4) with a mixture of protease inhibitors (Sigma-Aldrich). Protein concentrations in supernatants were determined with the use of Bradford reagent (Sigma-Aldrich). Proteins (20 μg) were separated with the use of SDS-PAGE electrophoresis and then transferred to PVDF (0.2 mm) membranes (BIO-RAD). The membranes were incubated all night with the anti-VEGF (Santa Cruz Biotechnology) or anti-SOX10 (Santa Cruz Biotechnology) antibody at 4°C, which was preceded by a blocking process with use of 5% low-fat milk/TBST. The membranes were then incubated with secondary antibodies conjugated to HRP (Santa Cruz Biotechnology). The results of the immunological reaction were analysed by chemiluminescence technique [25] using MP ChemiDoc (BIO-RAD) and normalised based on ACTB levels (Sigma-Aldrich). A densitometric analysis was performed using Image Lab Software.
RNA isolation and reverse transcription reaction
RNA isolation was performed with the use of TRIzol™ Reagent (Thermo Fisher Scientific) reagent [26] in accordance with the manufacturer’s protocol. The quality of the RNA obtained was measured by spectrophotometric method (Q 5000 of Quawell UV-Vis), measuring the absorbance at 260 nm and 280 nm wavelengths and electrophoretically using the Bioanalyzer 2100 (Agilent Technologies) with the microcapillary electrophoresis technique. The studies included samples whose A (260/280) values ranged from 1.8 to 2.0 and RIN (i.e. RNA Integrity Number) or the grade of RNA degradation values were 9.8–10.0. The reverse transcription reaction was performed with the use of the High Capacity RNA-to-cDNA (Thermo Fisher Scientific) set in accordance with the manufacturer’s protocol.
Real-time PCR (qPCR)
The expression of genes related to cancerogenesis of melanoma has been investigated using the designed TaqMan Array 96-Well Fast Plate (Part No. 4391016; Thermo Fisher Scientific) in accordance with the manufacturer’s instructions. The TaqMan plate included genes associated with processes such as proliferation, apoptosis, angiogenesis, as well as the invasion and metastasis of melanoma. The tests were conducted for 5 different trials. Each trial was analysed twice, in accordance with the generally accepted rules for the execution of qPCR reactions. The obtained Ct values are shown as a mean value. The presented results are an introduction for further analyses. They should be treated as preliminary tests. A reaction mixture of qPCR containing: 5 μl of TaqMan Gene Expression Master Mix (Thermo Fisher Scientific) and 50 ng of corresponding cDNA was supplemented with Nuclease-free water (Thermo Fisher Scientific) to a volume of 10 ml per hole. The Real-Time PCR reaction was performed in a duplicate using ViiA7 (Thermo Fisher Scientific).
Animal experiments
Animal studies have been conducted at the Warsaw Medical University, the Pharmaceutical Department with the Laboratory Medicine Unit in accordance with the procedures, with the approval of the Bioethics Commission of the Warsaw Medical University (authorisation number: 159/ 2016). Mice of the C57BL/6J strain of both sexes, aged 6–8 weeks were used.
The animals were kept in constant conditions (temperature 19-21°C; 12 h of light cycle/12 h of darkness; humidity of 55 ±10%; maximum noise value 35 DB). All treatments were performed by a professional team with extensive experience in working with laboratory animals, and the test methods used in the procedures were chosen to minimize pain, suffering and distress of the animals. The behaviourism of mice was under constant control. It is worth adding that the growth of tumours was not even, most often a high increase in the tumour was observed at the final stage of the experiment. Due to the good condition of the animals, the planned experiments were each time finished. At the same time, the highest average weight of tumours observed in the control group was 4.42 g.
The in vivo study panel consisted of 3 experiments (procedures)
Experiment 1 consisted in subcutaneous implantation of transfected B16-F10 cells with psiRNA preparations and empty psiLuc as a negative control with the use of LyoVec™ to C57BL/6J females (3 × 10⁵ cells per mouse suspended in 100 ml PBS). The following experimental groups were analysed: Control B16 (n = 5), B16/psiLuc/Lyovec (n = 5), B16/psiVEGF/Lyovec (n = 8), B16/psiSOX10/Lyovec (n = 8), B16/psiVEGF + psiSOX10/Lyovec (n = 8).
In experiment 2 C57BL/6J females were given B16-F10 cells in quantities of 3 × 10⁵ per mouse suspended in 100 ml PBS. After the tumours reached 2–4 mm in diameter (approx. 6 days after the administration of the cells), the treatment of psiRNA and empty psiLuc (as a negative control) was initiated in the form of an intralesional injection using a carrier (LyoVec™). The concentrations of preparations administered to the mice in an intralesional manner were experimentally designed (15 mg of plasmid: 50 ml of LyoVec™; 15 mg of plasmid + 15 mg of plasmid: 50 ml of LyoVec™). The control mice (Control B16) were administered PBS. Research groups (B16 + psiRNA/Lyovec) had 8 mice each and control groups (Control B16; B16 + psiLuc/Lyovec) 5 mice each.
Experiment 3 was based on the intra-dermal injection to male mice C57BL/6J of cancer cells transfected with psiRNA preparations, psiLuc – negative control, psecVEGF – positive control using LyoVec™. Cells in the amount of 3 × 10⁶ were suspended in 600 μl of PBS and stained with 0.1% blue trypan solution (Sigma-Aldrich) and then administered in an intradermal manner to mice to their abdominal skin in 6 injection points, 3 points in the area of the white line on each side, 8 mm apart (5 × 10⁵ cells in 100 μl of PBS per point, according to the criteria of publication of Sidky et al. [27]). The following experimental groups were analysed: Control B16 (n = 4), B16/psiLuc/Lyovec (n = 4), B16/psecVEGF/Lyovec (n = 6), B16/psiVEGF/Lyovec (n = 6), B16/psiSOX10/Lyovec (n = 6), B16/psiVEGF + psiSOX10/Lyovec (n = 8).
The material (melanoma tumours) from experiment 1 and 2 were used to analyse the volume and weight of the tumour and the level of haemoglobin in the tumour, whilst the material (skin slices with melanoma cells in the form of small tumours) from experiment 3 was used to analyse the amount of blood vessels within the tumours produced.
Haemoglobin level analysis by Drabkin’s method
The degree of vascularity in cancer tumours was assessed with the use of Drabkin’s method [28]. The tumours were weighed and divided into fragments of 0.5 g each. The prepared material was suspended in 0.5 ml of Drabkin’s Reagent (Sigma-Aldrich) and 8 ml of 0.5 M EDTA, if necessary homogenized (Omni TH, OMNI International). The assays were incubated by stirring (4°C; 2 h) and then centrifuged (10000 rpm; 5 min) – to obtain a clear supernatant. Supernatants were filtered through a syringe filter (0.22 mm). Haemoglobin concentrations in the samples were determined spectrophotometrically (540 nm; BioTek plate reader) and compared with the standard calibration curve. The haemoglobin content of the tested tissue was expressed as g Hb per ml of the sample.
Analysis of the number of blood vessels
The extracted skin samples were used to investigate the amount of newly formed blood vessels at the injection site. The number of vessels was determined by the Sidky and Auerbach criteria [27], with the use of a surgical microscope (Eschenbach Optik).
Statistical analysis
A statistical analysis was performed using the IBM SPSS Statistics 25 package. The Kruskal-Wallis test (non-parametric equivalent of variance analysis) was used in order to check if there were statistically significant differences between the groups in terms of the number of blood vessels, haemoglobin level in the tumour and tumour mass and volume. In case of statistically significant differences, the Games-Howell post-hoc test was used. The Spearman correlation was used to check whether there was a statistically significant relationship between haemoglobin levels and tumour mass in the individual groups.
Results
psiRNA transfection performance: carrier
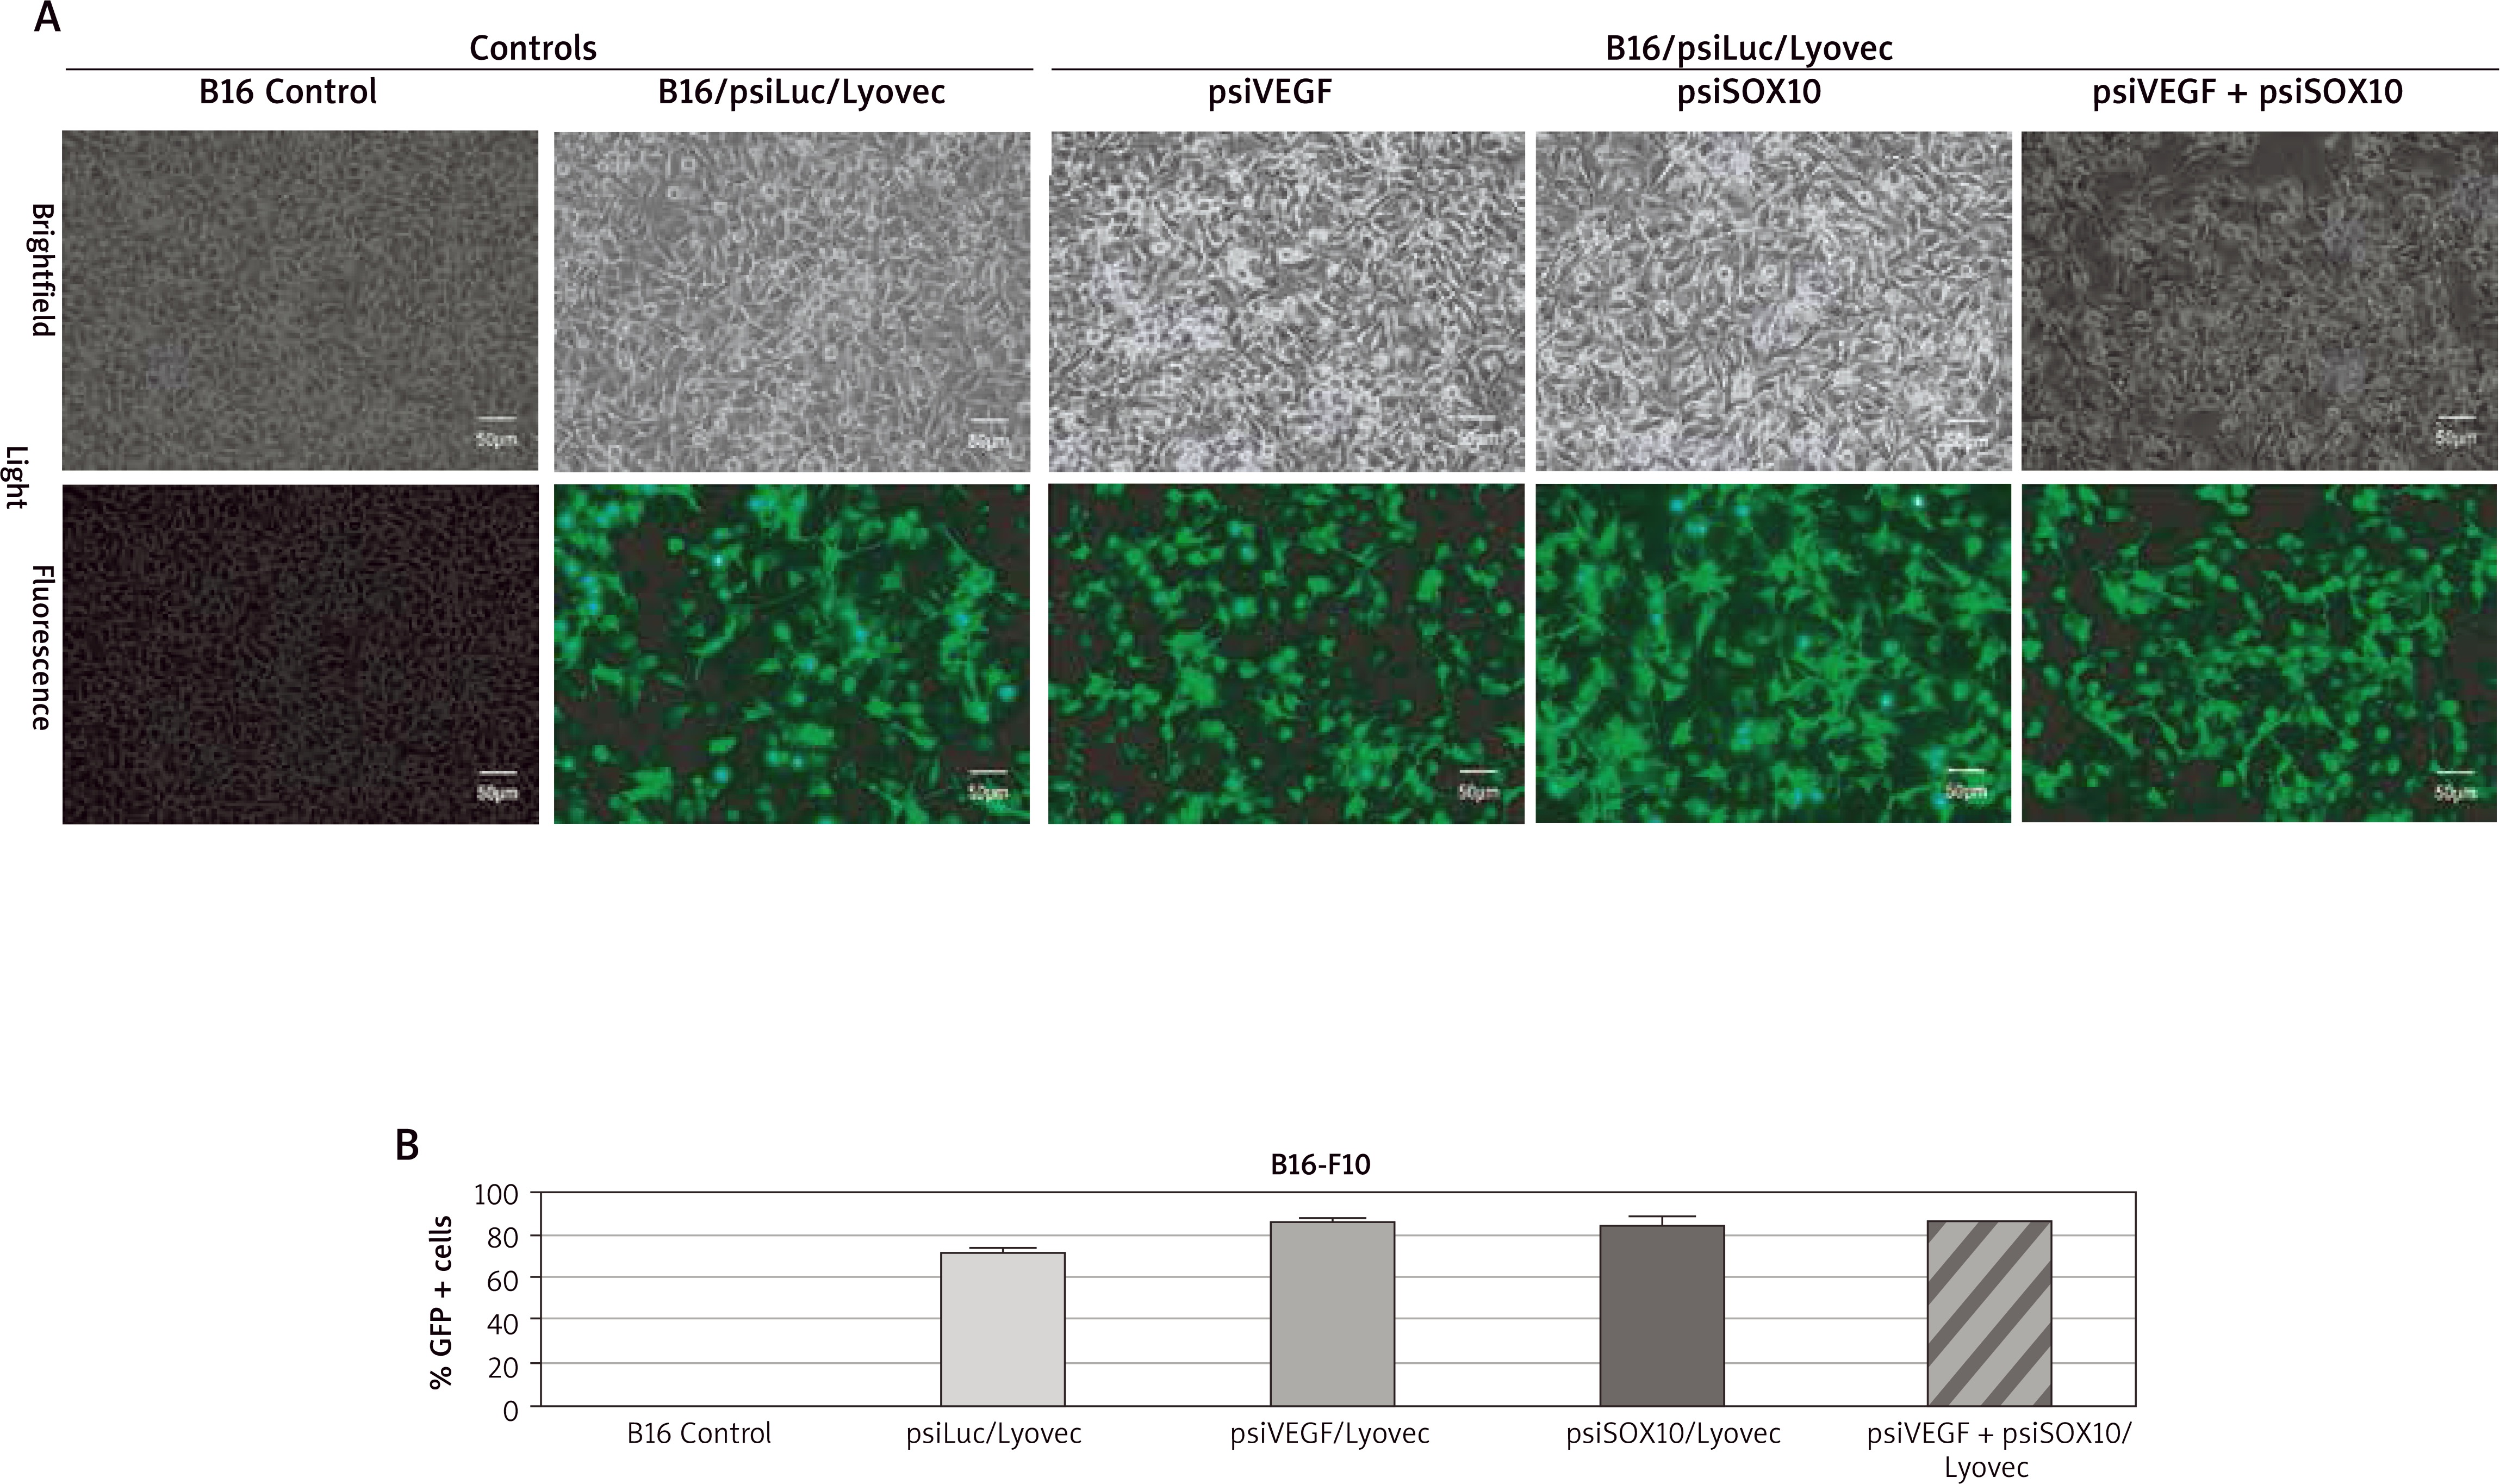
In order to confirm the efficacy level of the expression of the designed psiRNA formulations (psiRNA/carrier) in tumour cells, transfection was carried out. Fluorescence was found in a significant proportion in the observed cells transfused with these gene preparations (Figure 1 A). This indicates the high efficiency of the performed transfection. Thanks to the fluorescence cell count, a percentage contents of transfected cells (GFP +) was determined, depending on the given psiRNA/Lyovec formulation. The resulting values were 74–89% (Figure 1 B). It is worth adding that the appearance of transfected cells was not different from the appearance of control cells. Using a fluorescent cell counter, an analysis of the number and viability of cells dyed with trypan blue was conducted. The results of this analysis were also comparable for both control and transfected cells (the number of live cells was 1.1–1.3 × 10⁶/ml and viability was 85–95%).
Figure 1
Assessment of the performance of cell transfection B16-F10 with psiRNA preparations. A – The transfected melanoma cells seen in visible and fluorescent light observed with a fluorescence microscope. B – The percentage content of transfected B16 cells (GFP +) depending on the administered psiRNA/Lyovec formulation
Evaluation of expression of SOX10 and VEGF using Western blot and real-time PCR in vitro
The next phase of the study investigated the silencing activity of psiVEGF/Lyovec and psiSOX10/Lyovec preparations in relation to the Control B16, negative control (B16/psiLuc/Lyovec) and positive control (B16/psecVEGF/Lyovec) at the protein level, by Western Blot method. It has been shown that cells B16-F10 transfected with psiVEGF/Lyovec produced a lower amount of VEGF proteins than control cells (Figure 2 A). It has also been demonstrated that the expression of SOX10 protein for the test assay B16/psiSOX10/Lyovec is lower than in the control samples (Figure 2 A). Western blot results are presented as a representative figure.
Figure 2
Evaluation of SOX10 and VEGF silencing activity in vitro. A – The level of VEGF and SOX10 protein marked by Western Blot method and the densitometric analysis. B – The relative expression of the gene COL18A1, IL6, FLT4, NRP2, TNF and Mage-B16
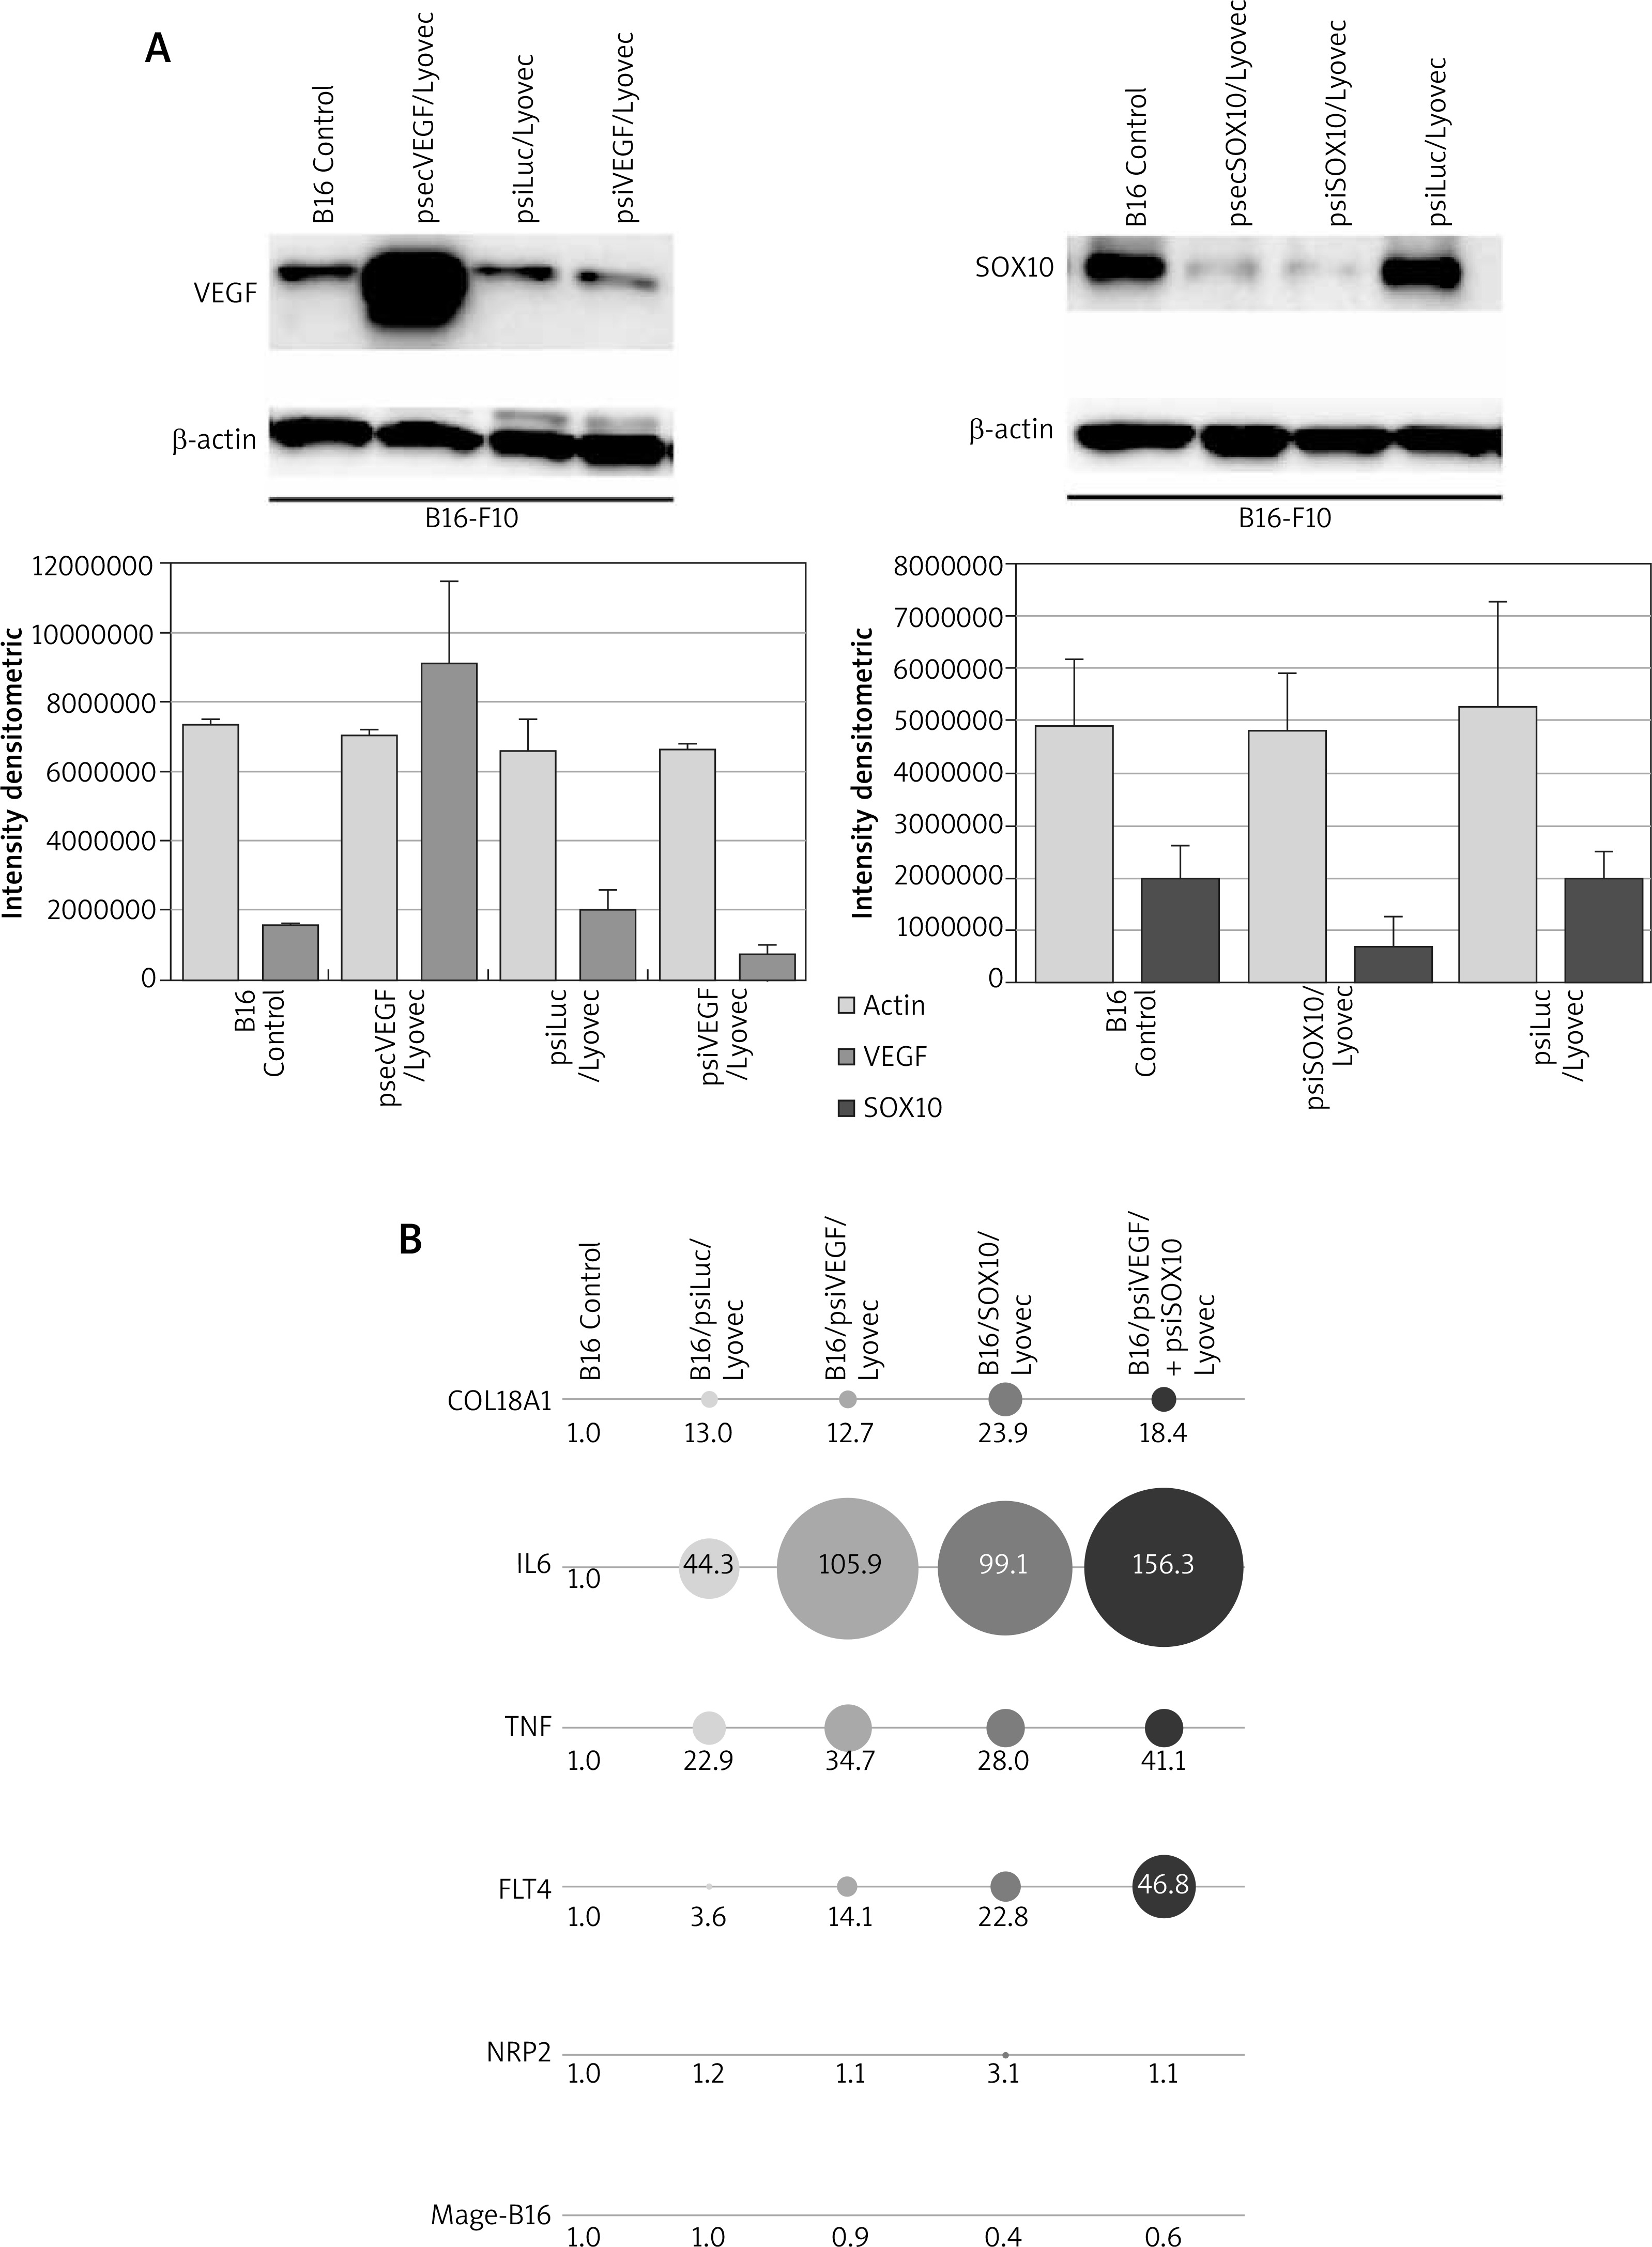
The cDNA obtained from B16 cells transfused with gene preparations (psiVEGF/Lyovec, psiSOX10/Lyovec, psiVEGF + psiSOX10/Lyovec and psiLuc/Lyovec as a negative control) were used to investigate the effects of VEGF and SOX10 silencing on the expression of genes related to cancerogenesis of melanoma. The analysis was performed using the Real-Time PCR technique and the TaqMan Array 96-Well Fast Plate. The relative level of gene expression was calculated using Method 2-ΔΔCT with the ExpressionSuite Software v1.0.3 (Thermo Fisher Scientific). The normalization of results was performed with respect to endogenous ACTB control. The plate includes 5 endogenous controls. ACTB was chosen due to the greatest stability among analysed samples. Of the 96-gene group, 6 were selected, most of which are linked to the angiogenesis process. These include: COL18A1, IL6, TNF, FLT4, NRP2, and Mage-b16. Genes subjected to a more accurate analysis have Ct values (cycle threshold) – which are the number of the reaction cycles in which the product starts to grow in an exponential manner, below 35 [29] and a multiplicity in relation to the control in the range – 0.5 > RQ > 2.0 [30]. In case of no detection, the CT value was defined as 40 [29] (Table 1). The results obtained for the COL18A1 gene are very promising for the assays inhibiting SOX10 activity (B16/psiSOX10/Lyovec; B16/psiVEGF + psiSOX10/Lyovec). They show that silencing SOX10 significantly increases the expression of the COL18A1 gene, which can be a key element in the results of further research (Figure 2 B). All tested preparations contribute to the increase in interleukin 6 (IL-6) expression in B16 cells. In contrast, the increase in cytokine expression tumour necrosis factor (TNF) is shown primarily in the B16/psiVEGF + psiSOX10/Lyovec and B16/psiVEGF/Lyovec trials. To a lesser extent in the trial silencing the very SOX10 (Figure 2 B). VEGFR-3 receptor coding the FLT4 gene (Tyrosine-Protein Kinase Receptor) is expressed in all test samples. However, the greatest attention is given to the assay linking psiVEGF + psiSOX10 plasmids, where the gene expression is significantly elevated (Figure 2 B). NRP2 encodes the neuropiline-2 protein, which belongs to the co-receptors forming inter alia VEGFR complexes increasing their affinity for VEGF proteins. From the tested trials, only B16 cells transfected with psiSOX10/Lyovec have an increased mRNA level of the tested gene. Silencing of the VEGF gene in melanoma cells did not affect the expression of NRP2 (Figure 2 B). Mage-b16 is a gene that encodes an antigen belonging to the type I MAGE protein family (Melanoma-associated Antigen), B16 subfamily. In all test assays, the expression of Mage-b16 gene was lowered in relation to controls, and in particular in cells treated with SOX10 inhibitory preparations (Figure 2 B). The difference in expression for NRP2 and Mage-b16 genes is less significant than the other compared genes, however it exists.
Table 1
Relative expression of the COL18A1, IL-6, TNF, FLT4, NRP2 and Mage-B16 gene
Assessment of anti-cancer activity of psiRNA formulation/carrier
In vivo studies have been conducted to check the antiangiogenic (antineoplastic) effect of psiRNA formulations on the mouse model.
Anti-angiogenic effect of transfectants following subcutaneous and intradermal administration
By monitoring the tumour formation process and outlining the tumour volume curve, it was found that the rate of growth after administration of the investigated subcutaneous transfectants was significantly lower than in control groups (Figure 3 A). Statistically significant differences were also demonstrated between the groups tested on a per-day basis – tumour volume in the B16/psiVEGF + psiSOX10/Lyovec group since 12th day was lower compared to the B16/psiSOX10/Lyovec group (p < 0.05) and later duration of the experiment, also compared to B16/psiVEGF/Lyovec (p < 0.05) (Figure 3 A). It is worth adding that the mice weight during the in vivo experiment was strictly controlled. Due to slight differences in the weight of the mice tested (subjected to psiRNA preparations), it was decided that tumours should be measured with a calliper, which made it possible to show differences even in the smallest tumours observed in the first days of the experiments. After 21 days, the mice were killed, cancer tumours were weighed and used for further analysis.
Figure 3
Anti-angiogenic effect of transfectants after subcutaneous and intradermal administration. A – The volume of mouse tumour among groups on particular days of the experiment. B – The final mass of mouse tumour among the groups involved in the experiment. C – The level of haemoglobin in the mouse tumour among the groups involved in the experiment. D – The amount of blood vessels at the injection site (*p < 0.05 compared to positive control; ***p < 0.001 compared to positive control) E – Photographs taken during the analysis of the number of blood vessels. Kruskal-Wallis test; mean ± SD; */#p < 0.05, **/##p < 0.01, ***/###p < 0.001; *over the test/control sample vs. Control B16; #over the test/control sample vs. negative control
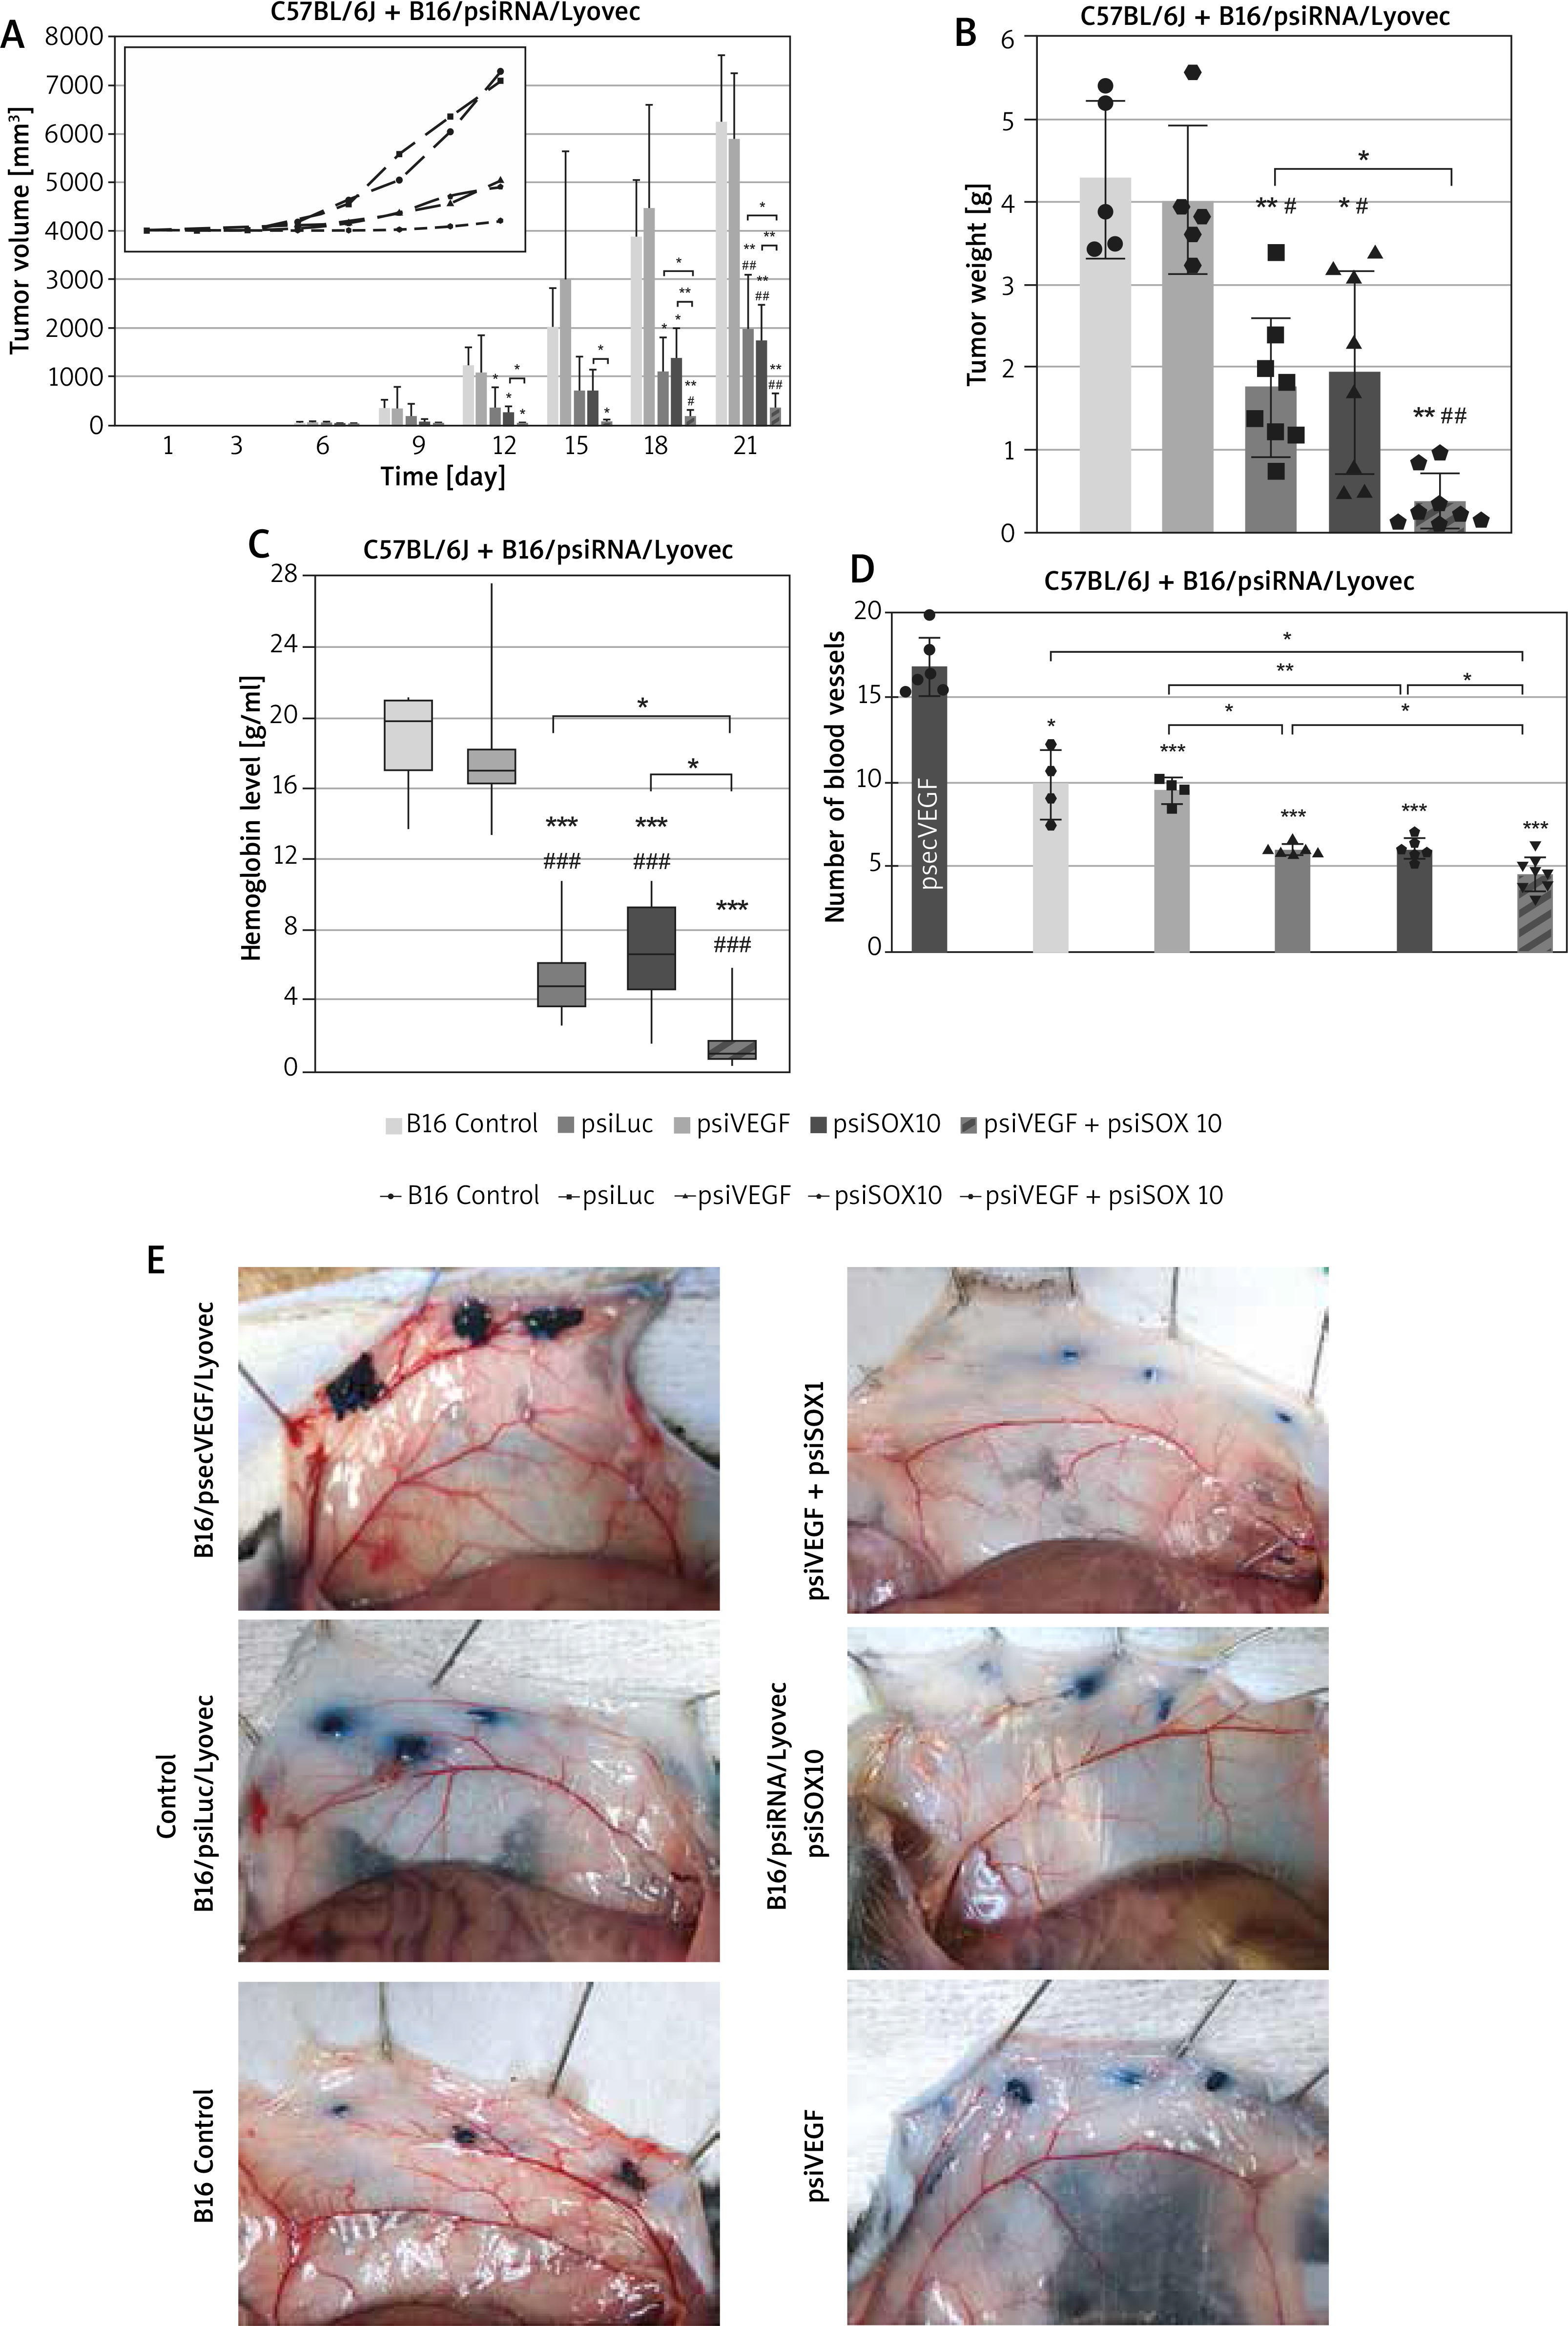
Both the volume and mass of tumours in the control groups were comparable. This indicates the lack of influence of the empty plasmid on tumour growth. It was observed that the mass of tumours for the test groups was significantly lower compared to both controls. However, the tumour weight in the B16/psiVEGF + psiSOX10/Lyovec group was lower by 78% compared to the weight in the B16/psiVEGF/Lyovec group (p < 0.05) and by 80% compared to the B16/psiSOX10/Lyovec group (Figure 3 B).
In the next phase of the study, the haemoglobin level analysis in the tumour was performed with the use of the Drabkin’s method. It is worth noting that the level of haemoglobin in tumours for the test groups was significantly lower for the Control B16 (p < 0.001) and the negative control (p < 0.001). Interestingly, the level of haemoglobin in the tumour for the group B16/psiVEGF + psiSOX10/Lyovec was over 3 times lower than the B16/psiVEGF/Lyovec (p < 0.05) and B16/psiSOX10/Lyovec (p < 0.05) groups (Figure 3 C).
Correlation analysis showed the occurrence of very strong positive links between tumour mass and haemoglobin levels in all groups. The higher the level of haemoglobin, the greater the tumour mass. The strongest link concerned the tested group B16/psiSOX10/Lyovec, in which Spearman’s rank-order correlation coefficient was R = 0.98, p < 0.001 (Table 2).
Table 2
The relationship between the level of haemoglobin and the tumour mass among the different groups of experiment – subcutaneous administration of B16 cells transfected with psiRNA/Lyovec and intralesional administration of the psiRNA/Lyovec formulation
Cells B16-F10 transfected with psiRNA preparations were implanted in mice also by the intradermal injection. After 5 days of the experiment, the mice were killed and the melanoma cell skin slices were used to analyse the amount of blood vessels within the produced tumours. The number of blood vessels in control groups: Control B16 and negative control – B16/psiLuc/Lyovec was comparable. However, the number of blood vessels in the positive control – B16/psecVEGF/Lyovec (included as an additional control) was significantly higher than in the other groups, and above all the test groups (p < 0.001). This value in the B16/psiVEGF/Lyovec and B16/psiSOX10/Lyovec groups was significantly lower compared to the negative control (p < 0.05) and higher for the test assay B16/psiVEGF + psiSOX10/Lyovec (p < 0.05). Moreover, the number of blood vessels in the B16/psiVEGF + psiSOX10/Lyovec group was significantly lower compared to the B16 control (p < 0.05) (Figures 3 D and E). The results above show that simultaneous silencing of both genes increases the antiangiogenic effect leading to inhibition of tumour growth.
Testing the pharmaceutical psiRNA formulations injected to the tumour
The created pharmaceutical psiRNA formulations were administered to the mice intralesionally. The treatment lasted for 15 days – every 3 days the tumour was infiltrated, tumour development was observed and the growing volume of tumour was measured (Figure 4 A). In the case of the B16 + psiVEGF/Lyovec and B16 + psiSOX10/Lyovec groups, the tumour volume on the last day of the experiment was similar and significantly lower than in the control groups (p < 0.05). It has been also confirmed that the tumour volume in the B16 + psiVEGF + psiSOX10/Lyovec group was the lowest and even inhibited. Moreover, the growth of tumours in control groups was very dynamic from the first days of the experiment compared to the test groups (Figure 4 B). After a certain period of time animals were killed, and the collected tumours were weighed and, as with subcutaneous administration, they were subjected to an analysis of the level of haemoglobin.
Figure 4
Testing of pharmaceutical psiRNA formulations that have been administered intralesionally. A – Experiment scheme. On the first day of the experiment, the B16-F10 cells were administered to the mice, 6 days after the B16 cells were administered (when the tumours reached a size of 2–4 mm in diameter) a therapy was initiated consisting of the introduction of psiRNA preparations and empty psiLuc as a negative control (plasmid: carrier) in the form of an intratumoral injection. The treatment lasted 15 days (from 6th to 21st day) – the tumours were injected every 3 days. B – The volume of mouse tumour among groups on the particular days of the experiment. C – The final mass of mouse tumour among the groups involved in the experiment. D – The level of haemoglobin in the mouse tumour among the groups involved in the experiment. Kruskal-Wallis test; mean ± SD; */#p < 0.05, **/##p < 0.01, ***/###p < 0.001; *over the test/control sample vs. Control B16; #over the test/control sample vs. negative control
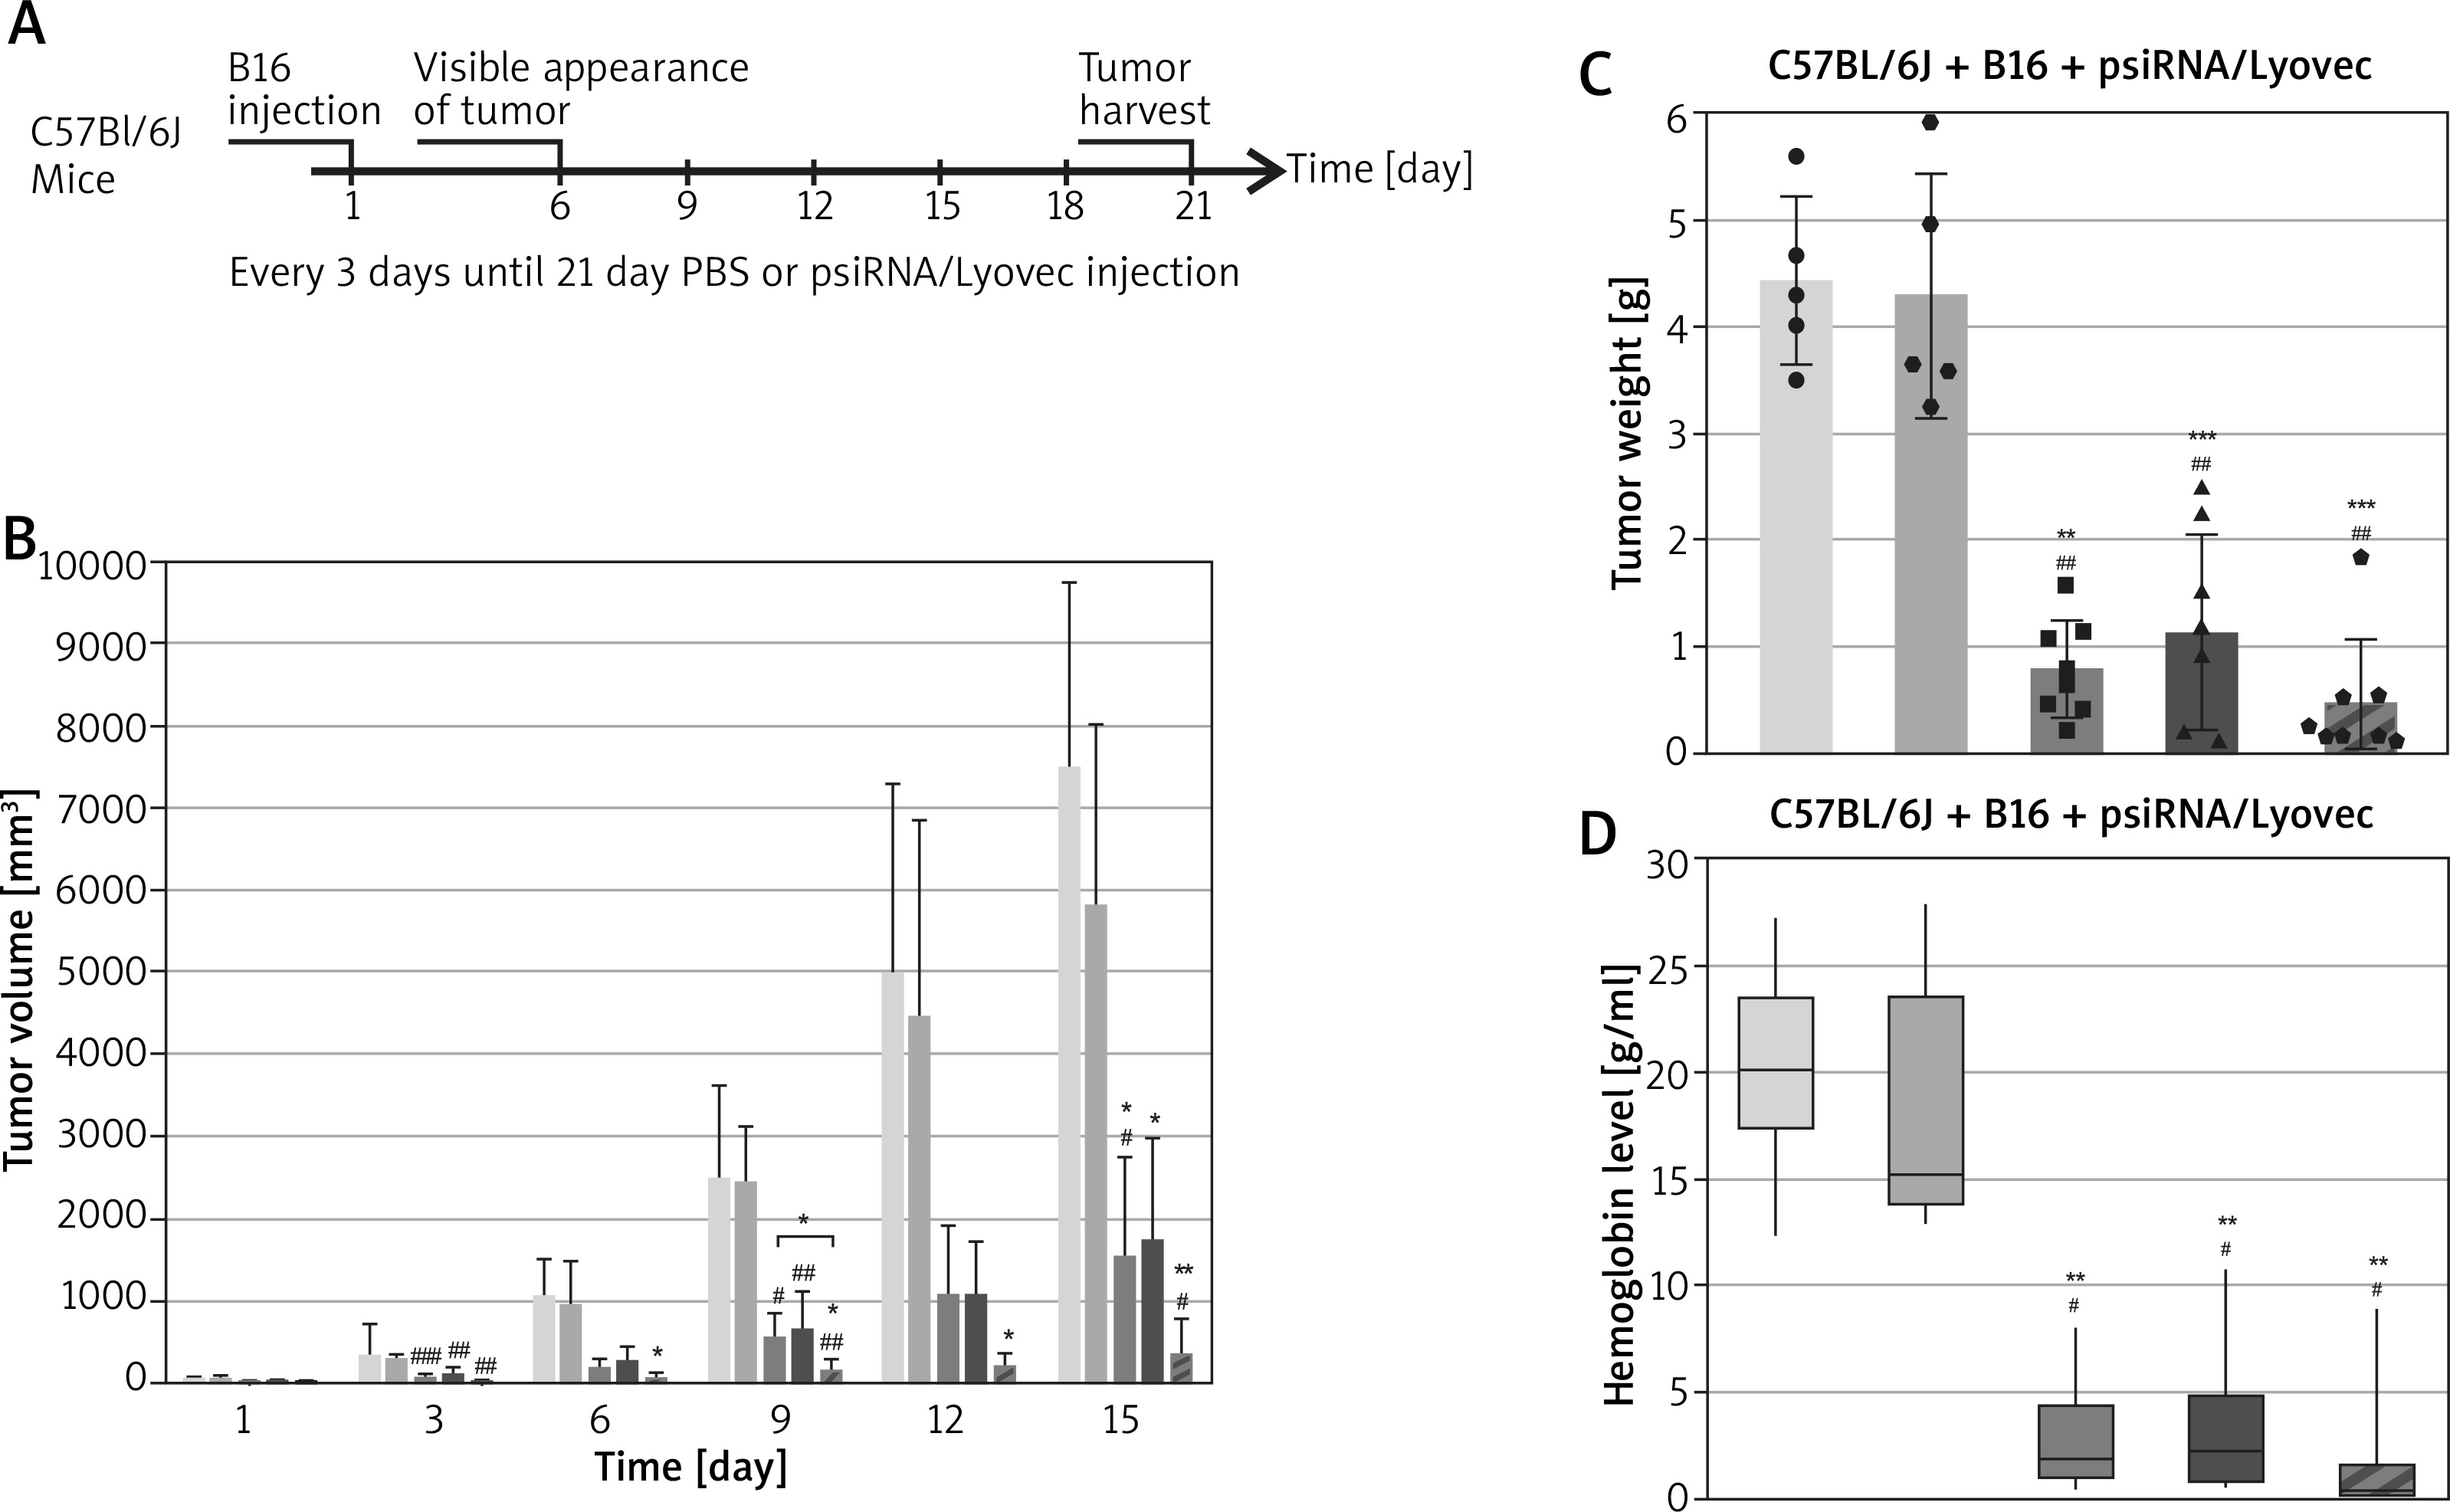
Tumour mass in the test groups was statistically significantly lower than in the control groups (p < 0.01). It is worth highlighting that the tumour weight in the B16 + psiVEGF + psiSOX10/Lyovec group was approximately 40% lower than the B16 + psiVEGF/Lyovec test group and 58% lower than the B16 + psiSOX10/Lyovec group (Figure 4 C).
The level of haemoglobin in tumours for single gene silencing groups was approximately 6 times lower than that of Control B16, indicating the effectiveness of the antineoplastic effect of the formulation used. However, the smallest level of haemoglobin in the tumour was noted for a group of animals that was treated with a psiRNA formulation silencing both genes. This value was 11 times lower than the Control B16. Nevertheless, the haemoglobin level in tumours for control groups was comparable and statistically significantly higher compared to the test groups (p < 0.05) (Figure 4 D).
The correlation analysis also confirmed the presence of very strong positive links between tumour mass and the level of haemoglobin in all groups, except for the negative control. The higher the level of haemoglobin, the greater the tumour mass. The strongest link was related to the B16 + psiVEGF/Lyovec and B16 + psiSOX10/Lyovec test group, where Spearman’s rank-order correlation coefficient was r = 0.9, p < 0.05 (Table 2).
Discussion
Vasculation of the tumour leads to its growth, and consequently to the spread of tumour cells and metastasis. Unfortunately, antiangiogenic therapies targeting VEGF and its receptors do not produce the expected results for many cancers, including melanoma [31]. Moreover, despite significant advances in understanding key molecular pathways involved in angiogenesis, many elements are still to be clarified.
siRNA therapy has been used in the experiment, which is of great interest. This is evidenced by recent clinical trials developing new drugs based on this therapy [32, 33]. In addition, a number of preclinical studies have shown that gene silencing can inhibit tumour development by affecting tumour cell apoptosis, proliferation, angiogenesis, metastasis, immune escape and drug resistance [34]. It has been confirmed that the efficiency of inhibition of development, migration and metastasis of melanoma can be increased by using more than one siRNA preparation [35] – which has also been demonstrated in this study.
The interest of researchers participating in siRNA studies in recent years has been noticeably directed to the B16-F10 melanoma cells, which have also been studied in this work. Alshamsan [36], using the B16-F10 line, proved that the induced death of melanoma cells was dependent on polyethylenimine concentrations of the (PEI)-p-STAT3-siRNA complex. Moreover, blocking the phosphorous STAT3 (p-STAT3) led to a decrease in VEGF expression and ultimately resulted in the death of B16-F10 cells [36].
A promising strategy is injection of therapeutic agents based on the RNAi phenomenon directly into the target tumour – which was also tested in the present paper. The effectiveness of the intratumoral injection has been reported with regard to the silencing of the CXCR4 chemokine receptor, which is known to play a key role in the initiation of many signalling pathways that stimulate the proliferation and metastasis of melanoma cells. As a result, the growth of cancer (B16-F10) was inhibited in 70% [37].
It is also possible to use RNAi in therapy, involving B16-F10 cells, intradermally – after administration of preparations in this manner, the level of GAPDH (3-phosphotridal aldehyde dehydrogenase) has been reduced, the overexpression of which is often recorded in neoplastic cells and the c-myc gene has been silenced by inducing the apoptosis of B16-F10 melanoma cells [38]. Thanks to siRNA it has been also possible to inhibit the growth of melanoma in this cell line by silencing IL-6 – cytokines that are pro-inflammatory and proangiogenic, as well as coordinating cancer growth with stress hormones and glutathione [39]. In the present paper, significant inhibition of tumour growth was also observed, as well as a decrease in the dynamics of the growth of the mass and volume of tumours after subcutaneous administration of transfectants.
In the present paper, from a pool of selected 96 genes, the results obtained in 6 genes could influence results in further in vivo research and offer the possibility for further analysis. These were the following genes: COL18A1, IL6, TNF, FLT4, NRP2, and Mage-b16. Although the response was achieved from only 6.25% of all genes analysed, it came from genes associated with angiogenesis and thus with the development and spread of cancer.
The conducted study shows that the SOX10 transcription factor can take part in the development of tumour blood vessels. It is interesting to note that the silencing of SOX10 in melanoma cells B16-F10 increases the expression of the COL18A1 gene compared to the VEGF inhibitory formulation. COL18A1 encodes the α-chain of type XVIII collagen, which belongs to multiplexes, extracellular matrix proteins. The proteolytic section of the C-end of COL18A1 is endostatin [40], which is highly antiangiogenically and antineoplastically capable to cause regression of tumours without inducing acquired resistance [41]. Karppinen et al. have demonstrated in their study of squamous cell carcinoma that the XVIII collagen selectively reduced in the vascular system of the tumour leads to a significant tumour progression [42]. Interestingly, recent research suggests that endostatin (C-final proteolytic fragment of the XVIII collagen) plays a prognostic and antimetastatic role and can be used as a tool to monitor tumour progression [43].
Based on the results obtained in vitro, a hypothesis has been formulated that gene suppression for the VEGF secretive factor with the gene for the SOX10 transcription factor may potentiate the antiangiogenic effect, leading to retention of tumour growth. In vivo results show that the anti-cancer effect was associated with tumour vascularity loss, observed by a decrease in the number of blood vessels and the level of haemoglobin in the tumour to the greatest extent for test assays inhibiting both VEGF and SOX10. The mass and volume of tumours, both when melanoma cells transfected with psiRNA preparations were administered to mice by subcutaneously and when the infusions of psiRNA formulations were injected to the tumours, were significantly lower than in the controls. In addition, the smallest value of these figures has also been recorded in the test assays silencing VEGF with SOX10, which confirms the presented hypothesis.
In case of the above experiment, the results show that SOX10 participates in the cancer angiogenesis process. It was first shown that the parallel direction of psi- RNA against VEGF and SOX10 in mouse melanoma B16-F10 is an effective anti-angiogenic strategy, contributing to a significant inhibition of tumour growth.


