
Introduction
The majority of multiple myeloma patients develop bone lesions at some stage of their disease. According to the guidelines of the International Myeloma Working Group (IMWG), skeletal surveys have been considered the gold standard imaging modality for many years [1]. Unfortunately, this technique is insufficiently sensitive to detect early lesions or monitor treatment responses. A revision of the IMWG guidelines introduced magnetic resonance imaging (MRI) into routine clinical practice, but positive positron emission tomography (PET) alone remains insufficient to diagnose active myeloma [2]. In contrast to skeletal surveys and computed tomography (CT), PET combined with CT (PET/CT) allows for direct, non-invasive visualisation of the tumour burden [3]. PET/CT using fluorine-labelled deoxyglucose (2-deoxy-2-[18F]fluoro-D-glucose [18F-FDG] PET/CT) can be more effective than a skeletal survey in upstaging patients with suspected smouldering myeloma [4, 5]. On the other hand, 18F-FDG PET/CT can be equivocal and difficult to interpret in some patients with a new diagnosis. For this reason, the main indication for 18F-FDG PET/CT is currently evaluating and monitoring response to therapy [6]. Fluoro-ethyl-tyrosine (18F-FET) is an amino acid tracer used in the diagnosis of brain tumours [7, 8]. Myeloma cell lines have the ability to transport and partially metabolise 18F-FET [9]. Similarly to 11C-methionine, 18F-FET is not only taken up but also is incorporated into newly synthesised proteins [9, 10]. It can be of special interest while visualisation of plasma cell mass is a target. The aim of this study was to analyse the metabolism of 18F-FET tracer in vivo, in both the active phases of multiple myeloma and in patients who have responded to chemotherapy, to assess the potential utility of the application of 18F-FET in the clinical setting.
Material and methods
This study was conducted between 2014 and 2017. Thirty-two patients were included (Table 1). There were eight patients with newly diagnosed active myeloma, nine with previously treated disease in plateau phase (one in complete remission [CR] and eight in very good partial remission [VGPR] after first-line treatment), and 15 with active, relapsed disease. Patients were diagnosed as follows: 14 with IgG myeloma, followed by 11 with light chain disease and seven with IgA type, 16 with κ light chain, and 16 with λ. Among treated patients the median number of previous chemotherapy lines was two (range one to five), and seven patients had autologous stem cell transplant (Table 1). Only patients with VGPR or CR were included in the inactive myeloma group assessment [11]. The clinical evaluation was based on the following: physical examination, bone marrow aspirate or trephine assessment, blood count, concentration of monoclonal protein and free light chains in serum and urine, serum levels of creatinine, calcium, albumin, and β-2 microglobulin. Each complete remission (disappearance of monoclonal protein on immunofixation or Bence-Jones protein on 24-hour urine collection) was histologically confirmed by trephine biopsy according to uniform criteria. Patients were not routinely explored by MRI unless surgical local procedure on the spine was considered. MRI tests were usually done after initiation of the treatment, so they could not be compared with PET/CT results.
Table 1
Clinical characteristic of the analysed patients
Whole body imaging with 18F-FET PET/CT
Patients fasted for at least four hours before the administration of 18F-FET tracer, in order to maintain similar test conditions. The examinations were performed using Biograph mCT128 or Biograph mCT 20 scanners. All participants underwent whole body imaging in two steps: first from the top of the skull to the upper third of the thigh and then from the upper quarter of the thigh down to the feet. Patients received 350 ± 10 MBq of 18F-FET intravenously. The time between the injection and acquisition was 60 minutes. Acquisition of the trunk image was performed with the patient’s arms arranged alongside the body. The CT scan was acquired with the following parameters: Care Dose 4D, 120 kV, and pitch 0.8 or 0.7 depending on the scanner. The CT scan was acquired during shallow breathing. The PET-scan was acquired with an acquisition time of 2.7 minutes per bed position. The total acquisition time was approximately 50 minutes depending on the height of the patient. The CT data were used for attenuation correction. Images were reconstructed using a commercial three-dimensional iterative reconstruction algorithm called TrueX+tof (UltraHD-PET; 200 × 200 matrix, 3-mm intervals, three iterations, 21 and 24 subsets). The standardised uptake value (SUVmax) for each lesion was calculated on PET images using the whole-body low-dose CT as a reference. To compare the metabolic activity of 18F-FET in areas affected by MM with unaffected regions, several “background” areas of the body were tested: the Th10 and L4 vertebrae and the spleen, the brain, and the left gluteus maximus muscle. To assess the physiological activity in these organs SUVmax values were calculated. During the PET examination, the result was considered positive when focal myeloma infiltration, defined as circumscribed areas of high 18F-FET PET metabolism with a corresponding bone or soft tissue change, was found. The SUVmax values of the background areas were calculated in volume of interest (VOI) 5 cm3 ±10%. These regions were chosen according to observation of the whole-body PET. These areas were most stable and assured enough space to create VOIs as stated above. Each case was evaluated independently by two experienced nuclear medicine specialists working independently (BM, RL), as well as by an experienced radiologist.
Sensitivity was calculated as the number of lesions correctly diagnosed by FET as being positive in CT out of the total positive lesions in CT (S = TP/TP + FN), and expressed as a percentage. The positive predictive value (PPV) was calculated as the number of lesions correctly diagnosed by FET as being positive in CT out of the total positive lesions in FET (PPV = TP/TP + FP), and expressed as a percentage (PPV = TP/TP + FP). The true positive (TP) event number was defined as the set of lesions correctly diagnosed by FET as being positive in CT. The number of false positive (FP) events was defined as the set of lesions predicted by FET as being positive in CT.
The study was performed in accordance with the principles of the Helsinki Declaration and was based on the approval given by the local Bioethical Committee. Each participant signed an informed consent form to participate in the study.
Results
Because histological proof could not be obtained for every lesion, low-dose CT served as a standard of reference in this study. Focal lesions were found on CT in 29 of 32 patients (91%). In total, 518 lesions were found (median 6, range 1–68; Table 1). Foci described as positive presented significant enhanced 18F-FET uptake. In all patients with multiple lesions the metabolic activity (SUVmax) in the background areas, apart from the spleen, was lower than the lowest SUVmax value in pathologically involved areas. The only exceptions were two patients in whom one lesion had a value lower than one background area, but the activity inside the lesion was clearly higher than in surrounding tissue. In total, 129 18F-FET-positive lesions were found in 22 of 32 patients (69%), with a median of 3 (range: 1–28). The mean SUVmax of focal osteolytic 18F-FET-positive lesions was 3.45 (range: 1.9–6.2) in comparison to the mean SUVmax of the background: brain 1.15 (range: 0.6–1.8; p < 0.00004), the mean SUVmax of the spleen was 2.15 (range: 1.7–3.4; p < 0.00008), the mean SUVmax of the spine at Th10 was 1.90 (range: 1.2–3.7; p < 0.00005), the mean SUVmax of the spine at L4 was 1.80 (range: 1.1–4.9; p < 0.00005), and mean SUVmax of the gluteus muscle was 1.75 (range: 1.4–2.3; p < 0.00001) (Table 2). In total, 129 lesions were visible on 18F-FET and 518 lesions on CT. The sensitivity of the 18F-FET/CT assessment was 55.58% (95% CI: 52.31–58.80%), specificity was 9.09% (95% CI: 1.12–29.16%), PPV was 96.28% (95% CI: 95.23–98.55%), and the negative predictive value was 0.48% (95% CI: 0.13–1.78%).
Table 2
SUV value of the affected area and the background in the analysed group of patients
From the myeloma activity point of view, three groups could be discriminated: those with newly diagnosed active myeloma (eight patients); myeloma patients with confirmed VGPR or CR after treatment (nine patients), and those with active disease after relapse (15 patients). On CT scans, lesions were found in all patients with newly diagnosed disease (median 5, range: 1–22), in all but two patients from the second group (median 5, range: 1–68), and in 14 patients with relapsed myeloma (median 8, range: 1–52; Figs. 1–3; Table 1).
Fig. 1
Patient no. 12, newly diagnosed multiple myeloma before the treatment. A) Computed tomography – lytic lesion localised in the sternum. B) The same lesion on 18F-FET PET/CT fusion image with high FET uptake (converted to black and white). C) Computed tomography – lytic lesion localised in the right iliac crest. D) 18F-FET PET/CT fusion image with high FET uptake in iliac crest
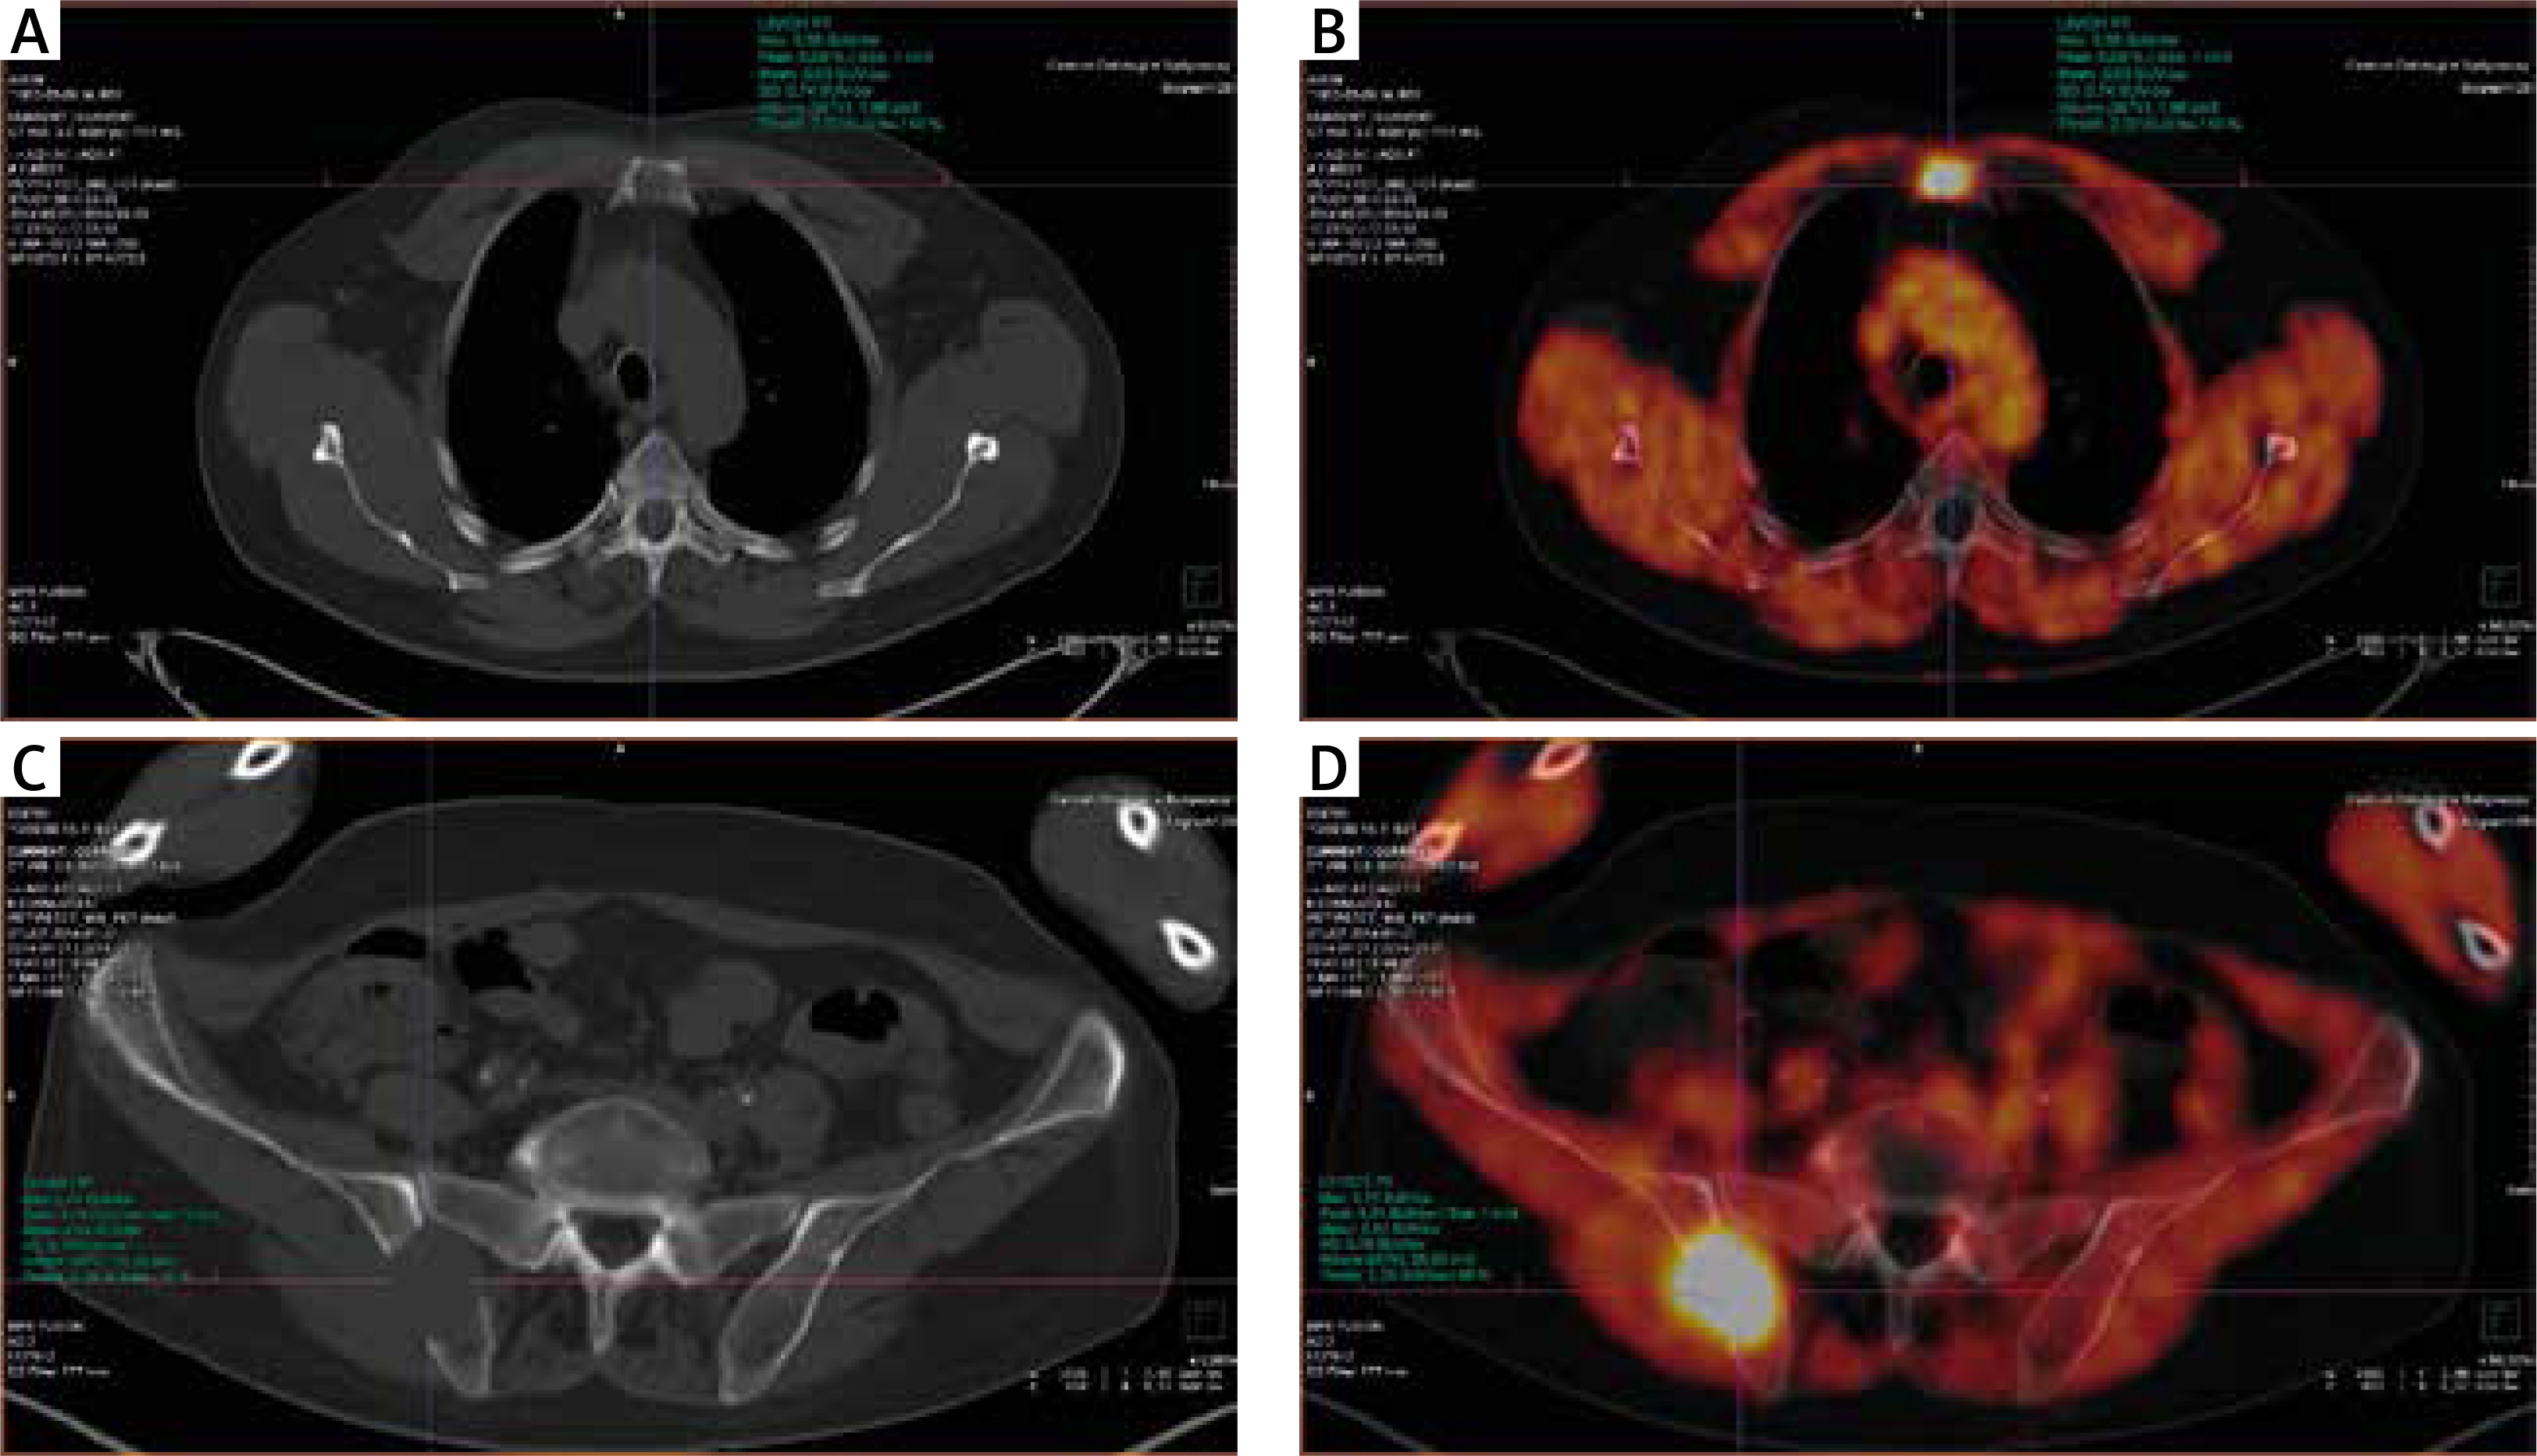
Fig. 2
The same patient after completion of therapy. A) Computed tomography (CT) – lytic lesions localised in the sternum – no difference to the status before therapy. B) 18F-FET PET/CT, fusion image with low FET uptake in the lytic lesion visible on CT in sternum. C) Computed tomography – lytic lesion localised in the right iliac crest – no difference to the status before therapy. D) 18F-FET PET/CT fusion image with low FET uptake in iliac crest
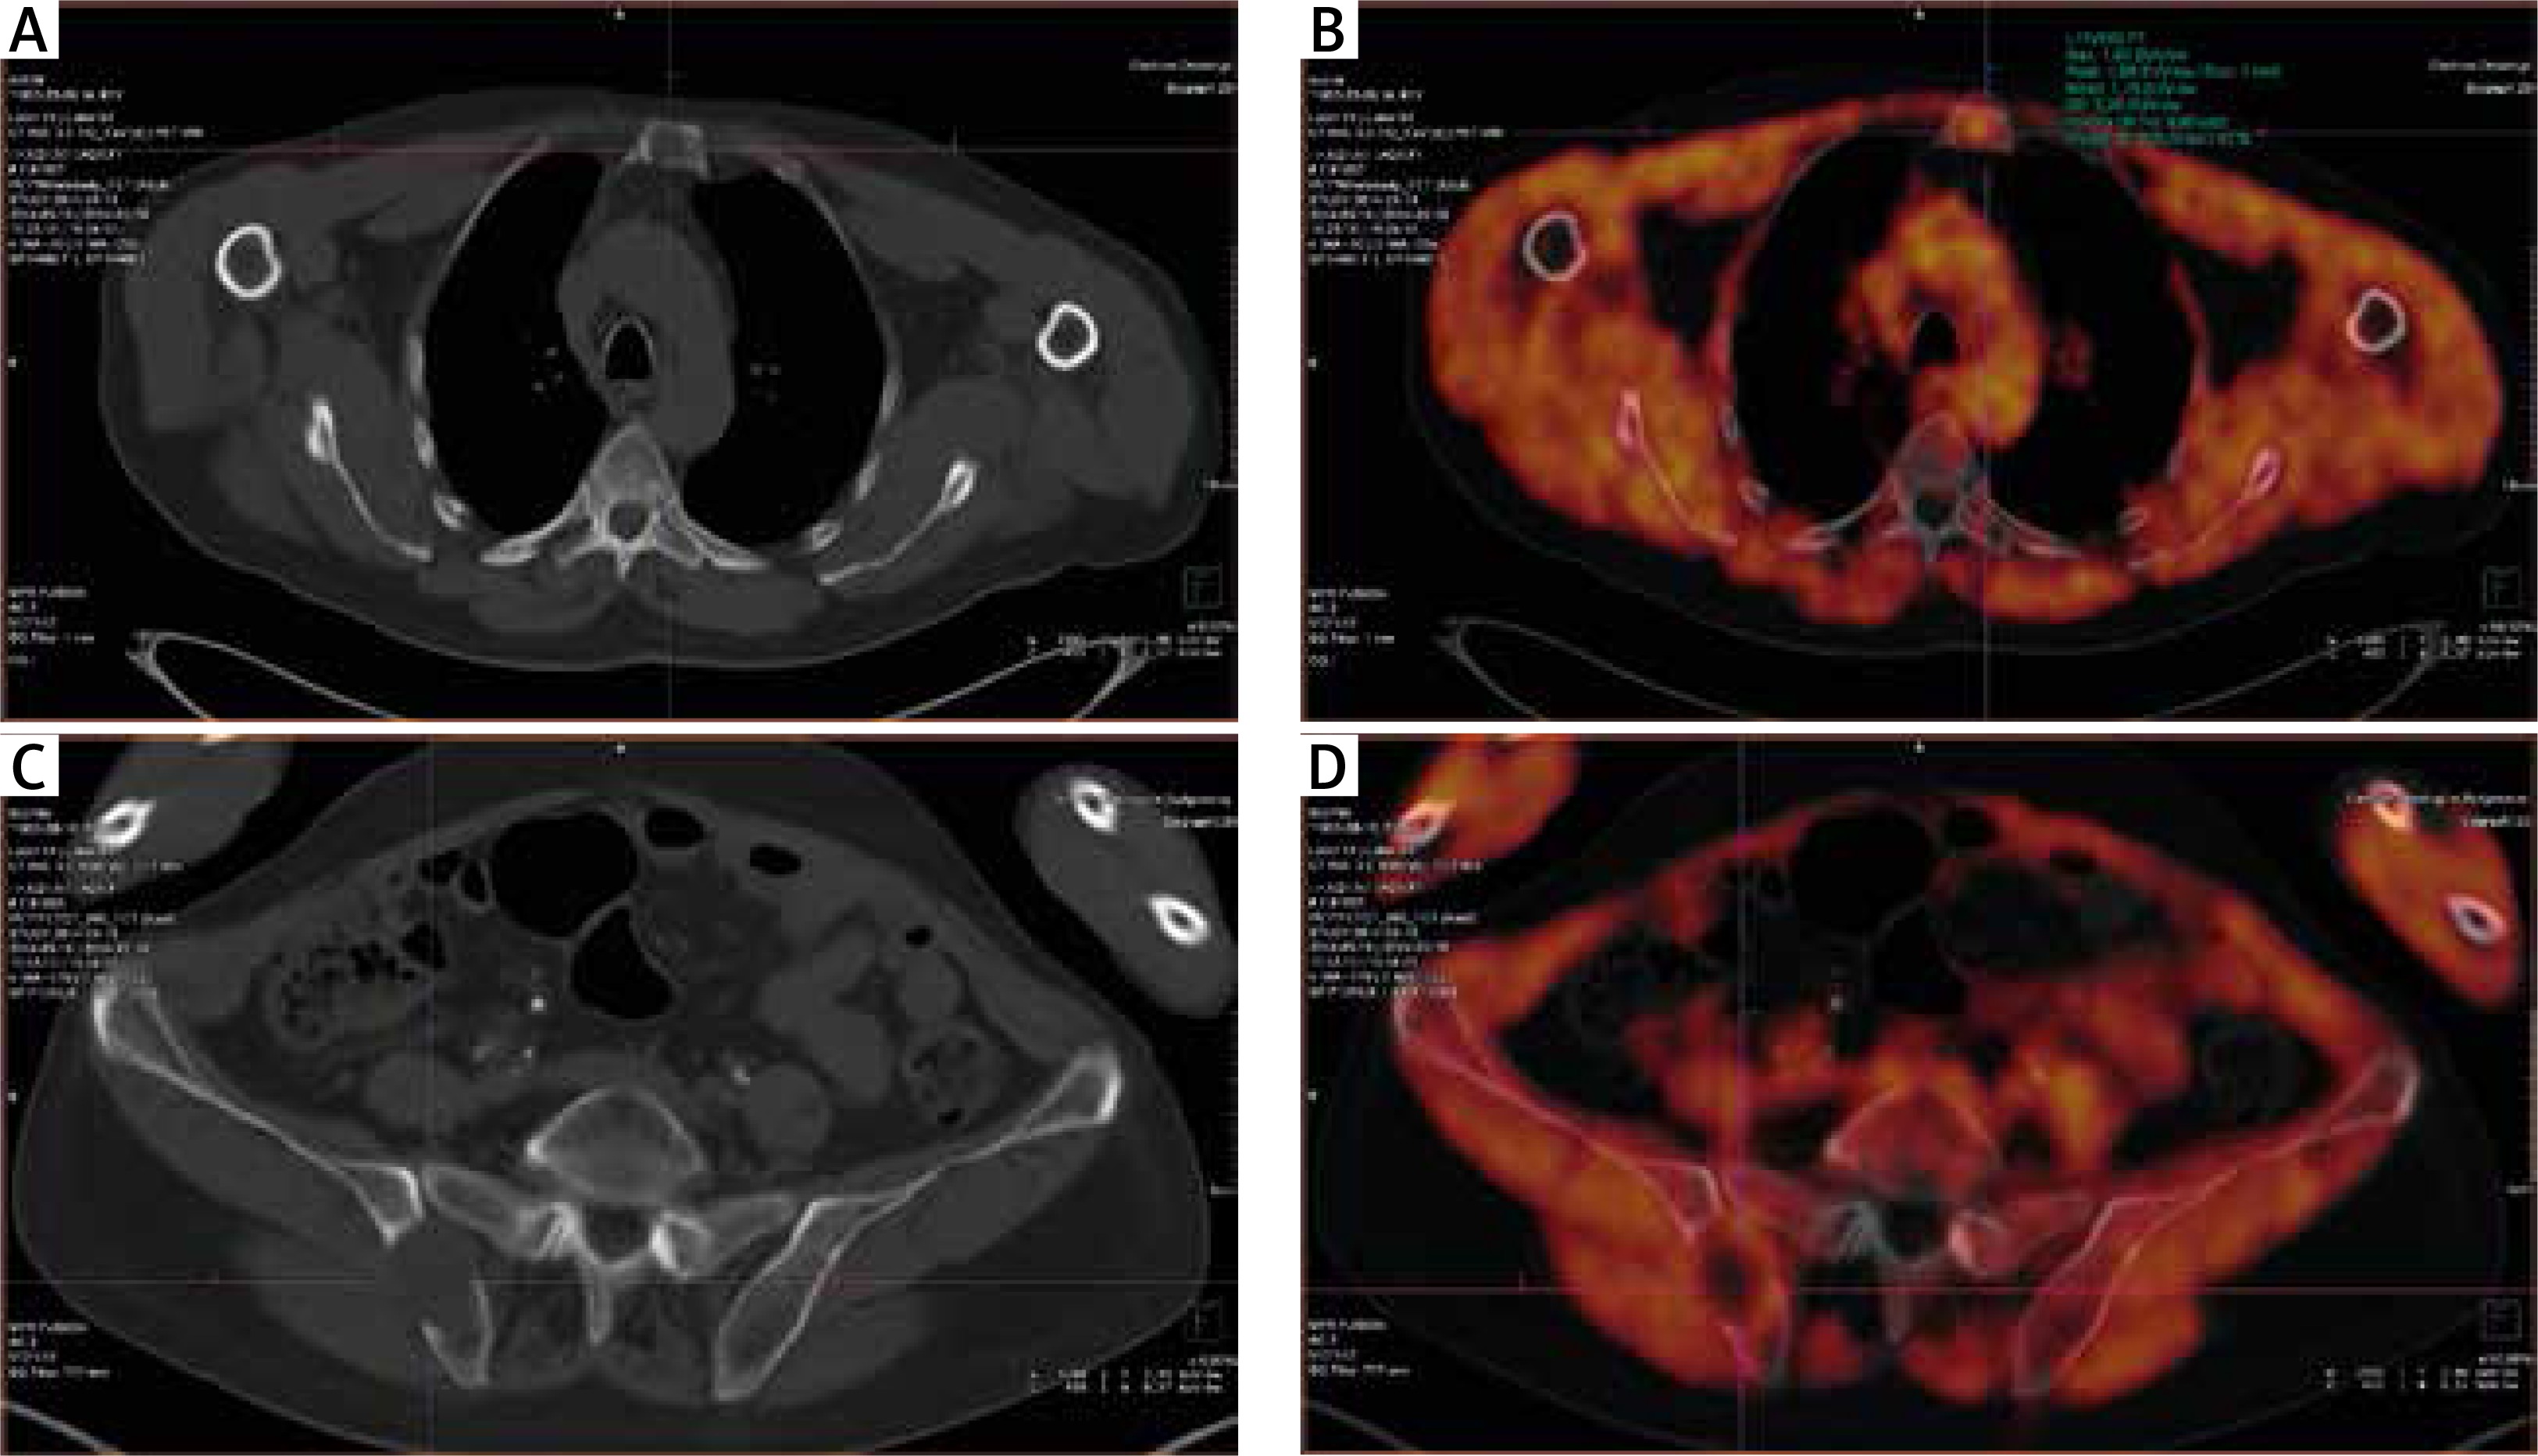
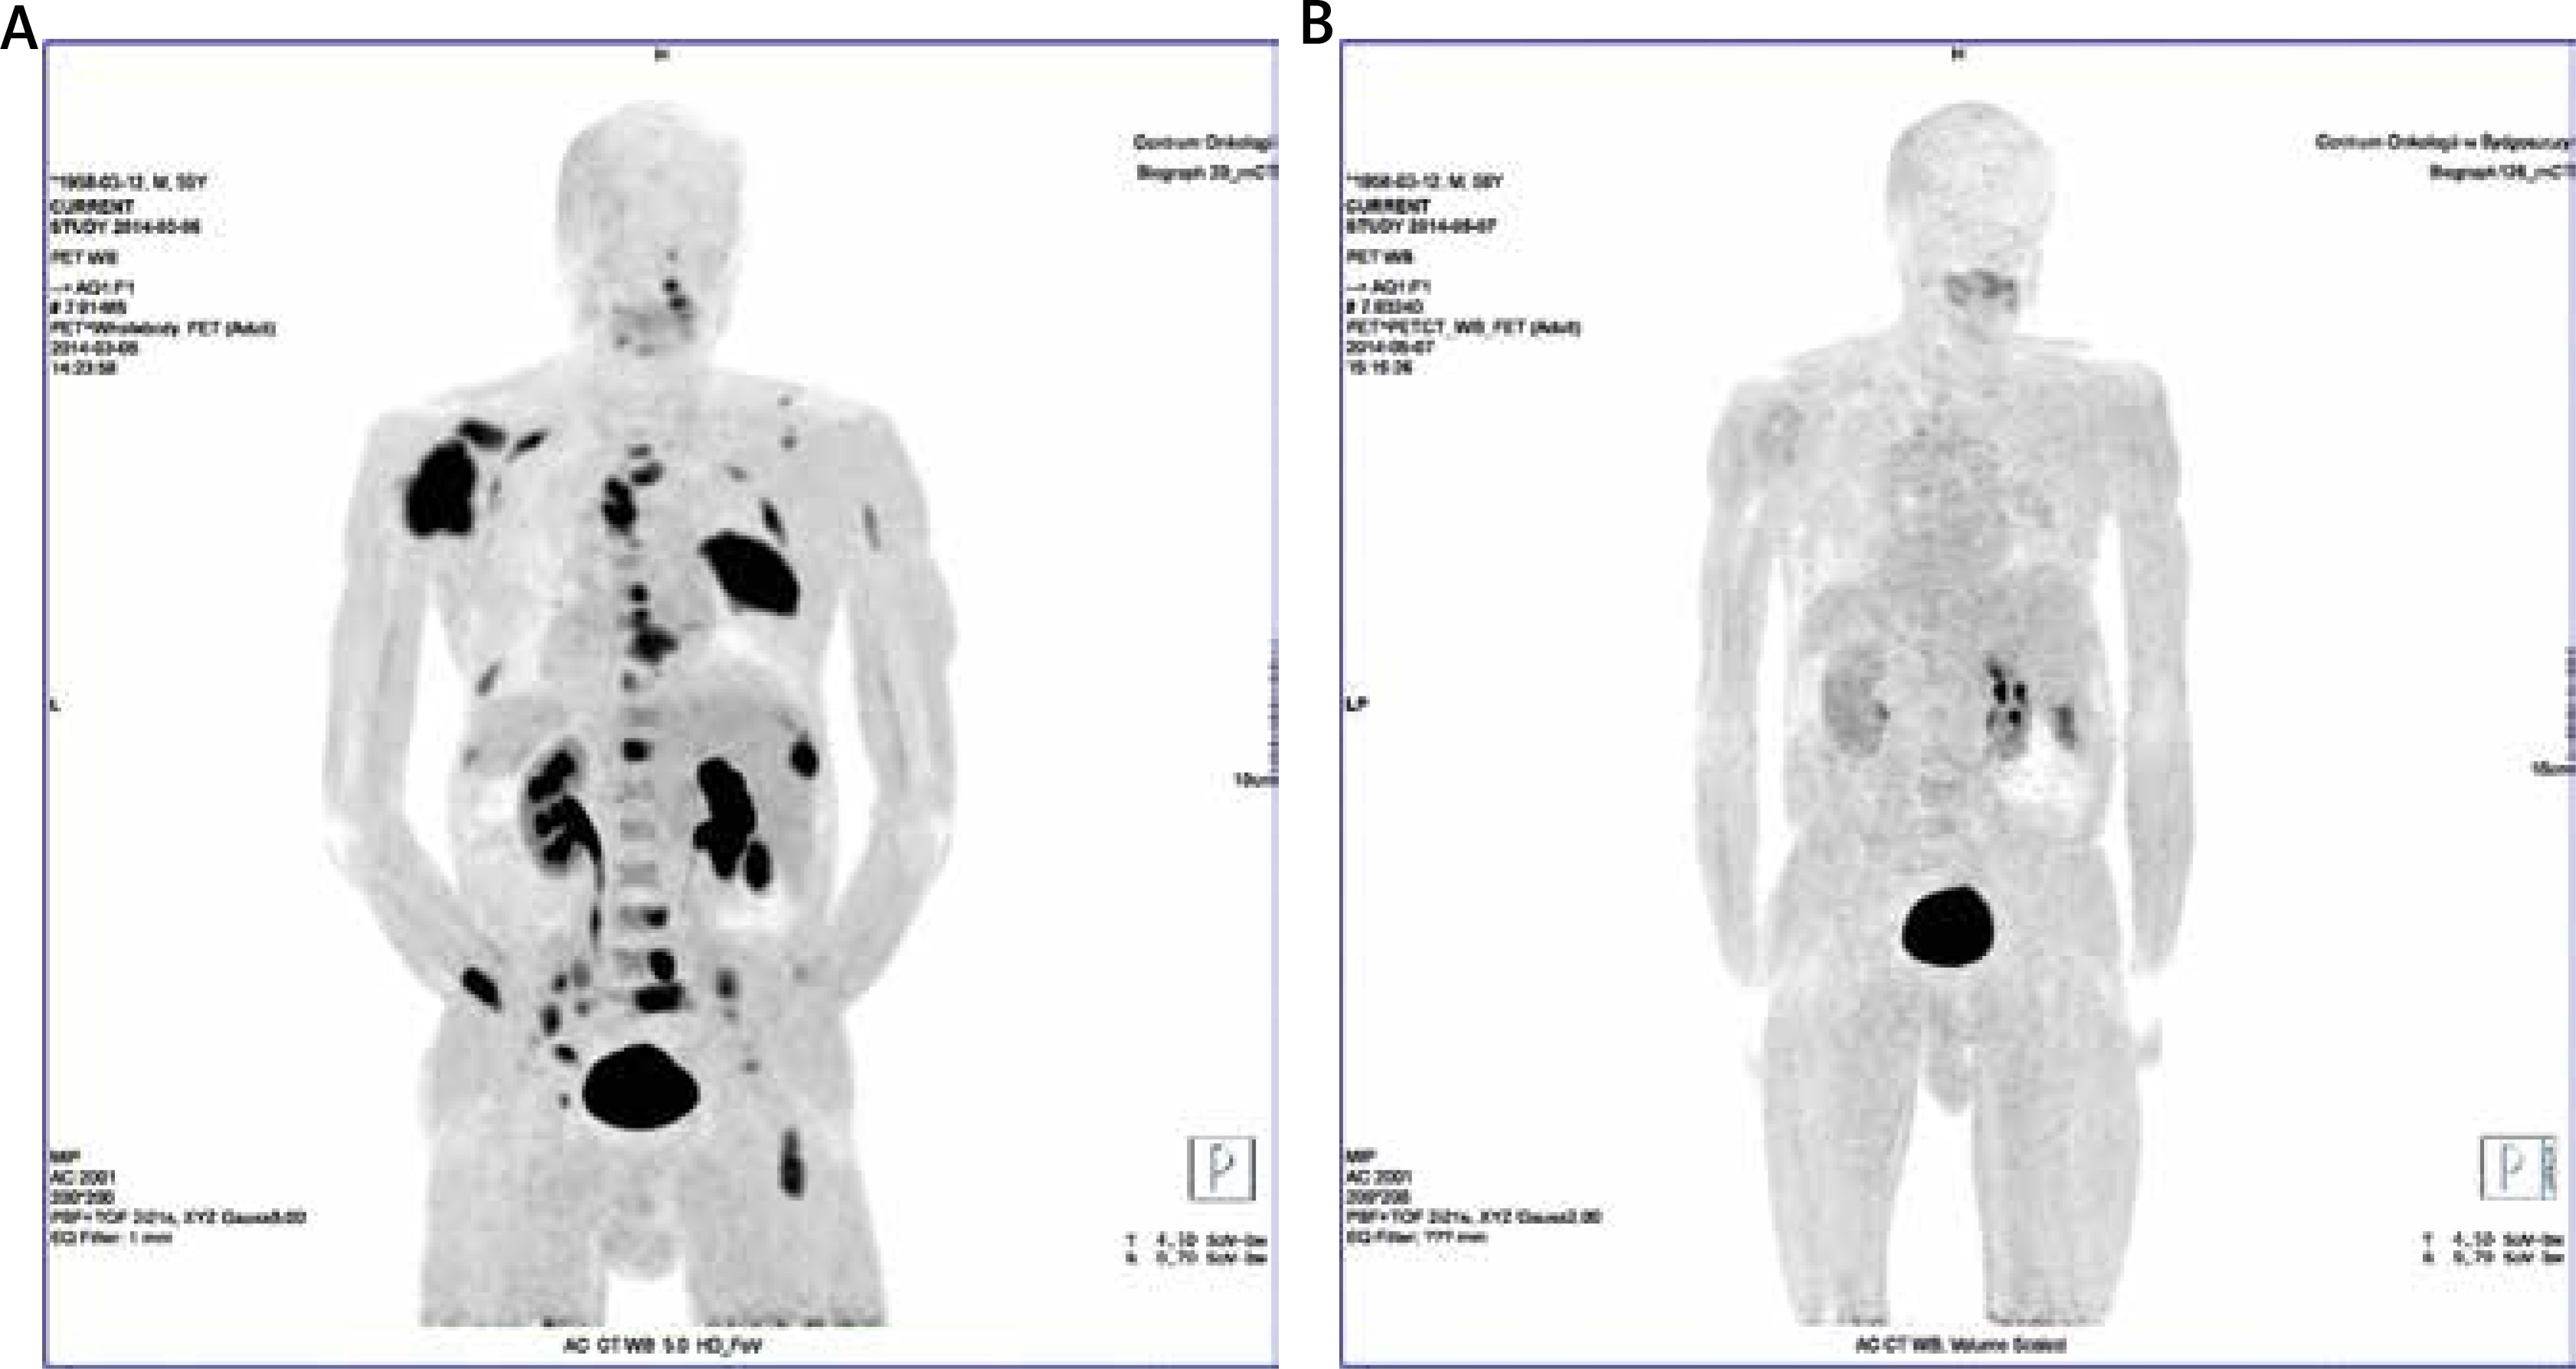
Fig. 3
Patient no. 21. Myeloma-related lesions before and after the treatment. MIP images of the FET uptake in the patient body. A) Multiple FET lesions localised in the skeleton of the pathological uptake of FET. B) MIP image after chemotherapy. Complete disappearance of pathological FET uptake may suggest metabolic response to the treatment
All but one patient with active disease (group 1 and group 3) had 18F-FET-positive lesions (median 3, range: 1–28). In patients from group 1 with newly diagnosed myeloma, 64 lesions were found on CT and 83 on 18F-FET. In six patients, the number of lesions on CT and 18F-FET was the same, and two had more lesions on 18F-FET than on CT (Table 1). In this subgroup the sensitivity of 18F-FET was 100% (95% CI: 96.65–100%), specificity was 9.09% (1.12–29.16%), and PPV was 80.58% (95% CI: 78–82.57%).
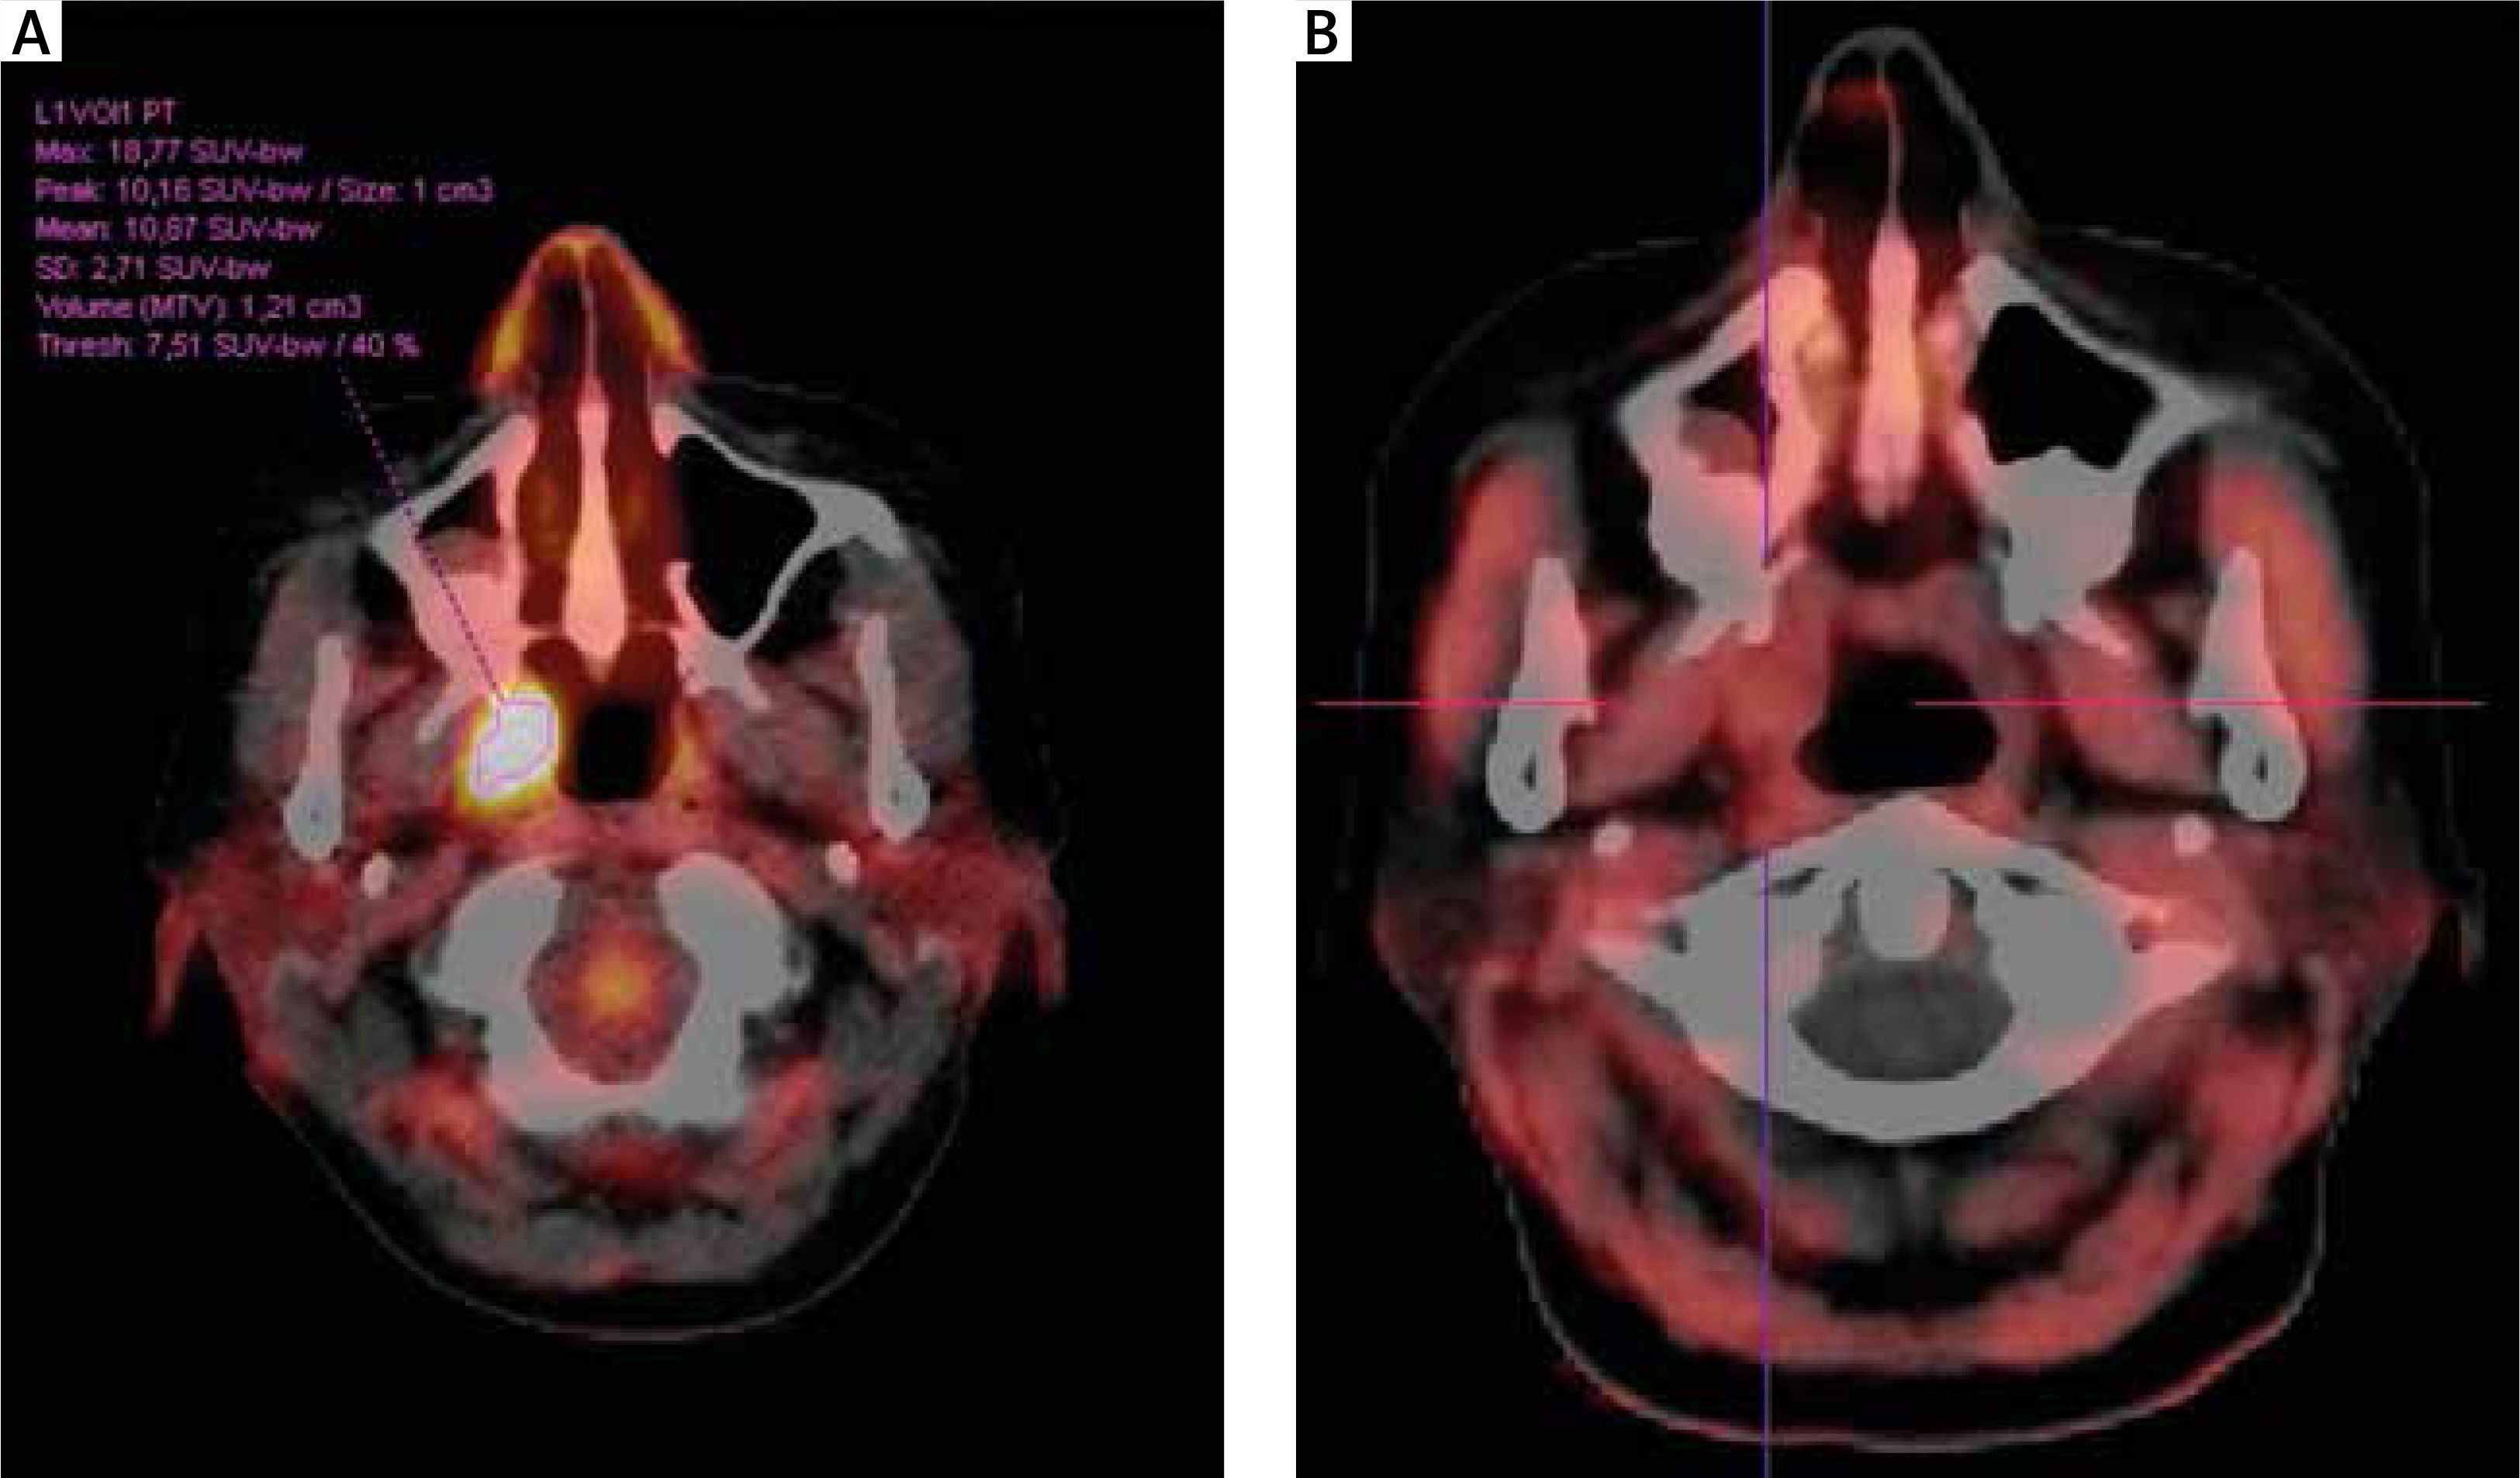
Patients with CR and VGPR had no FET-positive lesions. One of the patients in CR, according to the assessment of the treating physician, had an equivocal lesion on CT, which was positive on standard PET with fluorine-labelled deoxyglucose (2-deoxy-2-[18F]fluoro-D-glucose [18F-FDG]) used as a tracer. Subsequent examination with 18F-FET tracer did not reveal any activity (Fig. 4). Obviously, the biopsy of the affected area could not be performed.
Fig. 4
Patient no. 32. A) Solitary myeloma lesion suspected in the right palatine tonsil, positive in FDG PET/CT, showing high uptake SUVmax 18.77. B) Negative FET PET/CT result showing no tracer uptake in the right tonsil. No subsequent clinical progression of myeloma was observed on further follow-up
From 15 patients with active relapsed myeloma (group 3), 47 FET-positive lesions were found in 14 of them (median 3, range: 1–8). CT assessment of the same group showed 282 lesions in 14 patients (median 9.5, range: 1–58). One of the patients had soft tissue mass (soft palate) with increased FET activity and with no visible lesions on CT.
The sensitivity of the test was 54.44% (95% CI: 50.04–58.79%), specificity was 66.67 % (95% CI: 9.43–99.16%), and the PPV was 99.65% (95% CI: 98.27–99.93%).
Discussion
Numerous studies have shown the usefulness of 18F-FDG PET/CT in the diagnosis of bone disease in patients with myeloma [12]. In a prospective study designed to compare 18F-FDG PET-CT with whole-body X-ray (WBXR) and MRI, the latter was shown to be the most sensitive in the detection of diffuse bone marrow involvement, but PET/CT provided additional and valuable information for the assessment of myeloma bone disease in areas not covered by MRI and WBXR [13, 14]. In a systematic review of eight studies, including 798 patients, and comparing 18F-FDG PET/CT with WBXR and MRI, a higher sensitivity of FDG PET in the detection of myeloma bone lesions was shown in six studies [15]. Other reviews confirmed no difference between 18F-FDG PET/CT and MRI in the detection of myeloma-related bone disease in terms of sensitivity and specificity [3, 16]. The IMWG updated criteria for diagnosis of multiple myeloma says that increased uptake on PET/CT alone is not adequate for diagnosis of myeloma [2]. The reason for this is the possibility of false positive and false negative results [17, 18]. There are multiple reasons for false positivity of 18F-FDG PET, including: inflammation or infection, bone remodelling, recent chemotherapy or radiotherapy, or growth factor support; and for false negativity: hyperglycaemia, recent administration of high-dose steroids, or the presence of sub-centimetre lytic lesions close to the brain [6]. As yet, no consensus has been reached regarding an appropriate SUVmax cut-off value to distinguish positive and negative readings [19].
In order to individualise and improve patients’ management there is an obvious need to develop a novel tracer. In an attempt to find such a tracer some research groups focused on a characteristic feature of plasma cells – excessive production of immunoglobulin particles and used amino acid labelled with radioisotopes, such as methionine labelled with carbon (11C-MET) or a fluorine-labelled fluoro-ethyl-tyrosine (18F-FET) instead of FDG. One of them is 11C-MET, which is used in the diagnosis of a wide range of cancers. In preliminary myeloma studies it was found that the uptake of 11C-MET exceeds that of 18F-FDG by 1.5- to 5-fold [9, 20].
Luckerath et al. evaluated the radiotracers 11C-MET and 18F-FDG, on myeloma cells, to monitor the response to anti-myeloma-therapy, and for outcome prediction [10]. 11C-MET-uptake, but not 18F-FDG, significantly decreased after a bortezomib injection to myeloma cell lines. Early reduction of 11C-MET correlated with improved survival in mice.
Usefulness of 11C-MET in a clinical scenario was described by Nakamoto et al., who compared 11C-MET and 18F-FDG in vivo using this tracer to analyse 20 patients (six patients with active myeloma and 14 after the treatment) [21]. All the results were compared between the two scans. 11C-MET uptake tended to be higher and more lesions of grade 3 or 4 were depicted by 11C-MET than by 18F-FDG PET/CT. The patient-based sensitivity, specificity, and accuracy of 11C-MET for restaging were 89%, 100%, and 93%, respectively, while those of FDG were 78%, 100%, and 86%, respectively [21].
Recent results were published by Lapa et al., who presented 43 patients with myeloma, who underwent both MET- and FDG-PET/CT for staging or re-staging [22]. Eleven of them had a new disease, and 32 had been pre-treated with various numbers of chemotherapy regimens. Scans were compared regarding patients and lesions. Both tracers correlated with a degree of plasma cell bone marrow involvement and clinical parameters reflecting disease activity with 11C-MET demonstrating a stronger correlation. 11C-MET was also superior in staging and re-staging intra- and extramedullary bone lesions.
Okasaki et al. compared 11C-MET with 18F-FDG and 11C-4’thithymidine (11C-4DST) in 64 patients. Traditional CT was able to find 55 focal lytic lesions in 24 patients. Both 11C-MET and 11C-4DST were equally effective in myeloma-related lesions, and both were more sensitive than 18F-FDG. Unfortunately, 11C-MET can be used only in centres that are equipped with cyclotron and have the possibility of 11C production.
Another tracer investigated in patients with multiple myeloma by Nanni et al. was 11C-Choline. Ten of the patients underwent standard 11C-Choline PET/CT and 18F-FDG PET/CT. 11C-Choline PET/CT was capable of finding more lesions and showed a higher mean SUVmax than 18F-FDG. Other tracers investigated by various groups were: 3’-fluoro- 3’-deoxy-L-thymidine (18F-FLT), 18F-Sodium Fluoride (18F-NaF), or 18F-fluorocholine (FCH) [23–26]. All of them required further investigations.
In contrast to the above, very little is known about 18F-FET in the setting of multiple myeloma bone disease. For 18F-FET PET/CT cyclotron on-site is not necessary; it can be implemented in every centre using PET/CT, but the data from cell lines suggests that the relative uptake of ¹¹C-MET exceeds that of 18F-FET 7 to 20-fold [9]. In our study, we tried to assess the sensitivity and positive predictive value of functional imaging modalities 18F-FET in detecting myeloma-related lesions using CT as a standard of reference.
A mismatch between PET/CT with 18F-FDG as a tracer and anatomic imaging modalities, regarding demonstration of myeloma lesions, was described by Caers et al. [3]. It confirmed that standard low-dose CT is not capable of discriminating between vital and fibrotic myeloma-related lesions [27].
Focal lesions may remain positive on CT or hyperintense on MRI for several months after treatment, in responding or non-responding patients, because of treatment-induced necrosis or inflammation [28], which could be an explanation for the difference between the number of lesions observed in CT and in FET in patients previously treated and being in plateau or with recurrence of the disease in our patients. On the other hand, in untreated patients from our cohort the number of observed lesions on 18F-FET PET/CT was higher than on standard CT, which might suggest a possible increased sensitivity of our tracer in the detection of active disease. Our hypothesis is that high 18F-FET uptake reflects activity of the plasma cell production.
Association between intracellular Ig light chains with MET uptake was already reported by Luckerath et al. [9]. The presence of myeloma-related bone disease, reflected by positive lesions on CT, is a secondary event. It can explain why 18F-FET-positive lesions were found in areas negative on CT in patients with primary or secondary active disease but not in patients in CR or VGPR.
We hope that 18F-FET tracer will be able to overcome the weaknesses of PET/CT based on 18F-FDG. A lack of activity in the patient with complete remission can suggest better specificity of 18F-FET than standard 18F-FDG PET/CT. It is possible that 18F-FET PET/CT is capable of patients with active disease, which we saw in the group of patients with newly diagnosed myeloma. Because of the small cohort of patients in our study the presented results require further validation.


