
Introduction
Urinary incontinence (UI) is an important medical and social problem that affects more than 50% of postmenopausal women. International Continence Society (ICS) guidelines indicate that treatment of UI should begin with conservative therapy [1]. Pelvic floor muscle training (PFMT) is a nonsurgical management of UI recommended by the International Continence Society and the European Association of Urology [1, 2].
In order to select the appropriate therapeutic procedure as well as objectification of the effects of therapy, many diagnostic methods are used to assess the activity of pelvic floor muscles [3-6]. In this study, as in previous studies, we have attempted to answer the question of whether biochemical parameters can be markers for pelvic floor muscle activity [7, 8].
During physical activity, there are a number of changes that occur in the human body; however, study results on autoregulation mechanisms are ambiguous and need further clarification. Muscles are considered an endocrine organ because during physical activity they locally produce myokines (muscle tissue hormones), which mediate interactions between metabolism and tissues. The activity of steroid hormones, such as cortisol and testosterone, is also induced by physical exertion [9].
Cortisol (the stress hormone) is a strong catabolic hormone synthesised in adrenal glands. Together with insulin and glucagon, this key steroid hormone is a determinant of glucose homeostasis. Cortisol increases plasma glucose concentration, and thus provides the energy necessary to overcome stress. Furthermore, it maintains blood glucose concentration through glycogenolysis (transformation of amino acids into glucose) and increases the breakdown of contractile proteins in skeletal muscles (catabolism). Long-lasting catabolic properties of cortisol lead to the reduction of muscle mass and strength (sarcopaenia) [10]. Cortisol interacts with cortisol-sensitive lipase, causing lipolysis in fat cells; meanwhile, released insulin simulates lipogenesis and slightly inhibits lipolysis. Together with testosterone, cortisol binds to the same receptor, and specifically, a greater amount of cortisol binds with a smaller amount of testosterone [10].
Testosterone is a steroid hormone produced by Leydig cells. The cells can produce 5-7 mg of testosterone daily. Protein-bound testosterone represents approximately 98% of testosterone in blood, whereas there is only 1-2% of free, biologically active testosterone. Fluctuations in sex hormone-binding globulin concentration impact directly testosterone concentration (SHBG) in both women and men. Testosterone not bound to SHBG, i.e. bioavailable testosterone is biologically active and thus only available to tissues [11, 12]. It should be noted that testosterone bound to an intracellular androgen receptor (AR) may affect also muscle cells. Testosterone induces a rise in satellite cell number, which can be attributed to suppression of apoptosis, proliferation increase, and differentiation of satellite cells. Furthermore, testosterone aids myoblast fusion in damaged muscle fibres by creating multi-nucleated myotubes that lead to the formation of muscle fibres. Myoblast fusion is considered the key process in muscle regeneration after physical exertion. It has also been shown that testosterone regulates the ratio of fast-twitch fibres (FT) to slow-twitch fibres (ST), depending on the body part [13].
In this study, we attempted to examine the effect of pelvic floor muscle training on testosterone and cortisol concentrations in elderly women with stress UI.
Material and methods
Study design
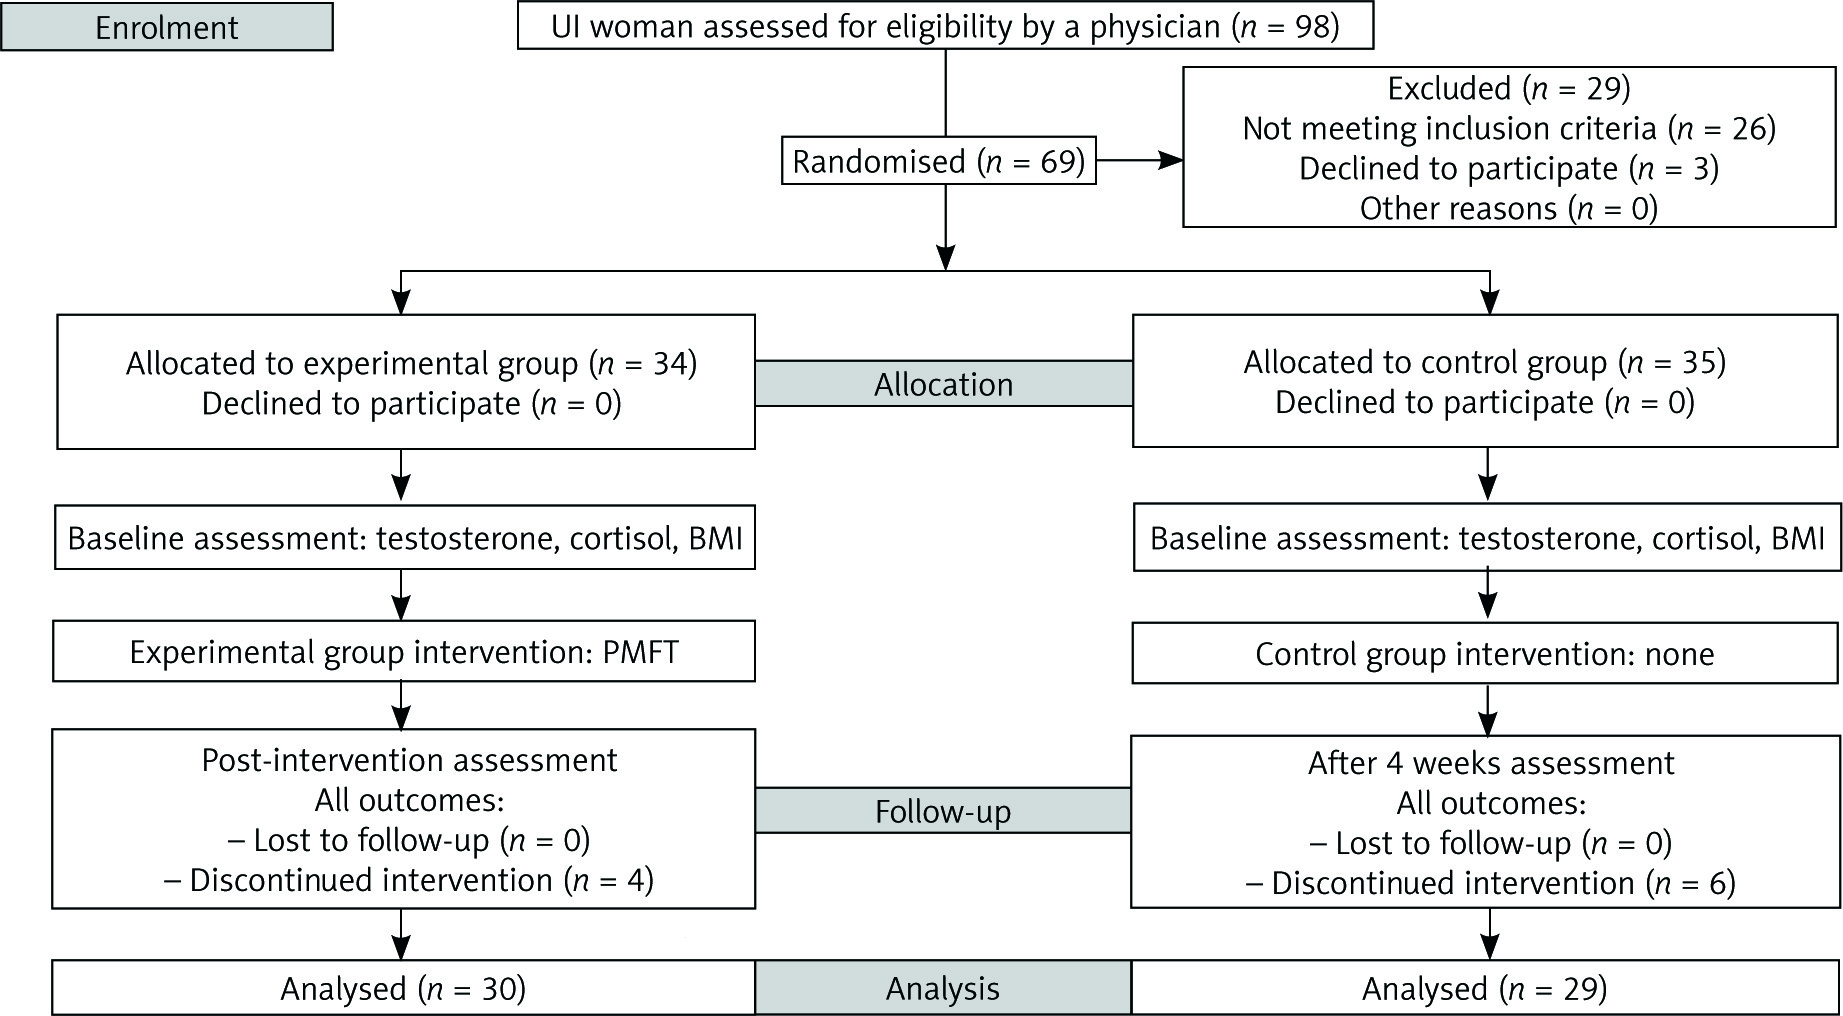
From January 2017 to May 2017, 98 women with UI were enrolled into a randomised, double-blind, controlled study. The following was conducted in accordance with the principles of the Declaration of Helsinki. The authors of this study obtained approval from the Local Bioethics Committee in Poland. Moreover, a statement confirming written, informed consent was obtained from all the participants. All identified data were included in this are contained within this report. Stratified randomisation was ensured by allocating the subjects using a simple method. One person picked envelopes with group allocation numbers from a computer-generated random number table. It should be noted that the main investigator was blinded during the group allocation process. Twenty-nine women were excluded in the first study stage. Specifically, 26 women were excluded because the inclusion criteria were not met, and three women refused to participate. Afterwards, 69 women were randomly assigned to the control group (CG) or the experimental group (EG). Of 10 participants who failed to complete the study, during the four-week intervention program, four participants in the EG withdrew from the study whereas six participants in the CG did not attend the final study visit. Overall, the study was successfully completed by 59 participants (EG n = 30; CG n = 29). We applied the CONSORT statement (Consolidated Standards of Reporting Trials) to improve the RCT reporting quality (Fig. 1) [14].
Before the treatment began, each participant was interviewed on the circumstances of urine loss, the presence of comorbid conditions, and contraindications to the treatment. Furthermore, the UI type was diagnosed using the Questionnaire for Urinary Incontinence Diagnosis (QUID). The QUID is a six-item UI symptom questionnaire created and validated to identify urge and stress UI. Adequate psychometric characteristics make the QUID an acceptable UI outcome measure in clinical trials [15].
Study inclusion criteria were as follows: age 60 years or more, diagnosed SUI, and no contraindications to the treatment (uterine tumours and myomas, urinary or genital tract infections, acute inflammations, acute infections, grade 3 or 4 haemorrhoids, stage 3 uterine prolapse, recent pelvic fractures, recent surgeries, severe urethral sphincter weakness and/or defect, suspected urethral and/or vesical fistula).
Study exclusion criteria were as follows: age under 60 years, diagnosed urge and mixed UI, no therapeutic interventions in UI in the last three months (PFMT, extracorporeal magnetic innervation (ExMI), electrostimulation, biofeedback), lack of regular physical activity, and the presence of contraindications to the treatment.
Measurements
At the initial and final assessments, testosterone and cortisol concentrations were measured for the EG and the CG to objectify the results. Additionally, the body mass index (BMI) was also assessed.
Testosterone and cortisol concentrations
The testosterone and cortisol concentrations were determined using validated commercial Diametra kits, cat. no. REF DKO020 and DKO021 to estimate the testosterone and cortisol concentrations in the saliva. The kits contain cortisol/testosterone antigens immobilised on ELISA plates. During the incubation period, the antibody competed for binding to the antigen and coupled with horseradish peroxidase (HRP). Bound separation occurred shortly after the incubation, during the simple solid-phase washing. Afterwards, the bound fraction HRP reacted with the H2O2 and TMB substrates. The enzymatic reaction was then stopped by adding sulphuric acid solution, and as a result the colour changed from blue to yellow. The colour intensity of the analysed samples is proportional to the testosterone/cortisol concentration. Calculations were performed using a calibration curve made up of standards provided by the manufacturer.
Three saliva samples were collected from each patient using a tube. Samples were then centrifuged at 3000 rpm for 15 min. After being stored at –20°C for at least an hour, the samples were then stored at –80°C.
The procedure
Before proceeding with the analysis, the reagents and samples were allowed to reach room temperature. Once all the samples reached room temperature, they were centrifuged at 5000 rpm for 5 min., and 100 µl of conjugate was mixed with 100 µl of the tested sample. We prepared two wells for each vial with a calibration compound (C0-C6), two for controls and one for blanks, in order to prevent mistakes, sample duplication, and to authenticate the method. After pipetting all the samples, standards, and blanks into wells, we added the conjugate and incubated the contents at 37°C for one hour. Subsequently, we removed the contents using an automatic washer. The wells were washed three times with 300 µl of diluted wash solution. During each washing step, we let the wash buffer stay for 15 seconds and then removed the excess contents with an absorbent paper towel. Later we added 100 µl of TMB to each well and incubated the contents at room temperature for 15 minutes. The reaction was then stopped by adding 100 µl of sulphuric acid solution.
Intervention
All women in the EG group underwent 12 therapy sessions (three times a week, 45-minute sessions, lasting four weeks) according to the proprietary program. The exercises were completed in five/six-person groups supervised by a physiotherapist. Before joining the training session, all patients were examined for posture and body correction and then prepared for proper training by acquiring the skills of mobilising sacroiliac joints and doing exercises to improve the range of movement in the lumbar-sacral spine and the hip and knee joints. Training in breathing through the abdominal and thoracic duct was also conducted. The pelvic floor muscle training (PMFT) program was based on straining fast and slow twitch muscle fibres of the pelvic floor with relaxed gluteal muscles using the transversus abdominis muscle tension, with and without changing the position, as well as synchronising the muscles with breathing. The PFMT exercise was performed in lying, sitting, and standing positions. The numbers of exercises and repetitions were determined individually depending on the functional ability of the patient [16].
Statistical analyses
For statistical analysis of the gathered data, Statistica 13.1 software was used, and the Shapiro–Wilk test was conducted to determine the normality distribution. Because the variables did not follow normal distribution, we decided to measure the lower quartile (Q1), upper quartile (Q3), and the median. We estimated the differences between the two groups using the Mann-Whitney U-test. While the Wilcoxon test was applied to determine differences within one group. Correlation between variables was assessed with the Spearman correlation coefficient. The authors set the statistical significance level at p< 0.05.
Results
Table 1 includes Student’s t-test results and descriptive statistics for all measured variables for the EG and CG at the initial assessment.
Table 1
Comparativean alysis of all measured variables for the experimental group and control group – the initial assessment
The comparison of the Mann-Whitney U-test p-value with the α = 0.05 significance level showed no statistically significant differences between the EG and CG results at the initial assessment. Hence, the group homogeneity was confirmed.
Table 2 includes Wilcoxon test results and descriptive statistics for all measured variables for the EG and CG at the initial and final assessments.
Table 2
Comparative analysis of all measured variables for the experimental group and control group – at the initial and final assessments
The comparison of the Wilcoxon test p-value with the α = 0.05 significance level revealed a statistically significant difference between all measured variables for the EG at the initial and final assessments. The comparison of Wilcoxon test p-value with the α = 0.05 significance level showed no statistically significant differences between all measured variables for the CG at the initial and final assessments.
Table 3 includes Wilcoxon test results and descriptive statistics for all measured variables for the EG and CG at the final assessment.
Table 3
Comparative analysis of all measured variables for the EG and CG – the final assessment
The comparison of the Mann-Whitney U-test p-value with the α = 0.05 significance level revealed no statistically significant difference in all measured variables between the EG and the CG results at the final assessment.
In the next stage of the study we correlated the BMI scores with the testosterone and cortisol concentration results for the EG and CG at the initial and final assessments.
There were no statistically significant correlations between testosterone concentration and the BMI score in the EG (r = –0.024) and the CG (r = –0.087) at the initial assessment, and there were no statistically significant correlations between testosterone concentration and the BMI score in the EG (r = –0.131) and the CG (r = –0.198) at the final assessment.
There were no statistically significant correlations between cortisol concentration and the BMI score in the EG (r = –0.029) and the CG (r = –0.133) at the initial assessment, and there were no statistically significant correlations between cortisol concentration and BMI score in the EG (r = –0.177) and the CG (r = –0.119) at the final assessment.
In the next stage of the study, we correlated the testosterone concentration results and the cortisol concentration results in the EG at the final assessment. No statistically significant correlations were reported for these variables (r = –0.182).
Discussion
According to our knowledge, this is the first study to examine testosterone and cortisol concentrations in elderly women with stress UI after pelvic floor muscle training. As mentioned in the Introduction, study results on autoregulation mechanisms occurring during physical activity are ambiguous. Discrepancies have also been observed in steroid hormones, such as testosterone and cortisol. According to certain studies, a one-time exertion increases testosterone synthesis and its concentration in blood; however, such changes depend on the intensity and length of the physical activity. Physical exertion of less than one minute does not affect the testosterone concentration. Whereas high-intensity exercises for one hour cause a significant increase of its concentration. During the next three hours following exercise sessions lasting over one hour, the testosterone concentration gradually decreased until it returned to its resting values. It should be noted that greater changes in testosterone concentration during physical activity are observed in people engaged in little physical activity than in professional athletes [17]. Numerous studies demonstrate that physical activity of varying intensity levels affects testosterone concentrations in young women [18-22]. Fewer data are available on hormonal changes in elderly women, induced by physical activity, and there are discrepancies among these results [23-26]. In the present study, we demonstrated a statistically significant increase in testosterone concentration (p< 0.001) in a group of elderly women with SUI who underwent a four-week pelvic floor muscle training. Interestingly, certain reports indicate that there is a link between higher testosterone concentration, greater body weight, and insulin resistance in elderly women [27, 28]. Research suggests that loss of fatty tissue may significantly contribute to lowering testosterone concentration. However, it should be noted that in most cases research subjects were overweight or obese elderly women [29-31]. In the following study, there was no statistically significant correlation between testosterone concentration and the BMI score in the EG at the initial assessment (r = –0.024) as well as after completing the PFMT intervention program (r = –0.131). Interestingly, even though we observed a statistically significant reduction of the BMI score, the EG subjects had a relatively high BMI score both at the initial and the final assessments (Table 2).
Moreover, it should be noted that several studies reported a negative correlation between cortisol and testosterone concentrations after physical exertion. An increase of cortisol activity induced by physical exertion may lead to a reduction in testosterone concentration in blood [32-34]. The ratio of serum cortisol (catabolic hormone) to free testosterone (anabolic hormone) is a key indicator of physical exertion and anaboliccatabolic homeostasis [35]. The present study did not reveal any statistically significant correlations between cortisol and testosterone concentrations (r = –0.182) in members of the EG, who underwent a four-week pelvic floor muscle training.
As mentioned in the Introduction, cortisol is called “the stress hormone”. Physical exercise has been considered a stressor because it creates an increased demand for energy and disrupts energy homeostasis [36]. Studies show that cortisol secretion increases with the intensity of the physical activity. High-intensity exercise increases the activity of stress hormones, such as cortisol, adrenocorticotropic hormone (ACTH), and catecholamines (norepinephrine, epinephrine, and dopamine) [37, 38]. The increase of these hormones may inhibit synthesis and stimulation of protein degradation, and consequently lead to their breakdown in skeletal muscles [39]. Even though the influence of intensive training on cortisol concentration has been widely studied in various age groups [40-45], it remains unclear how low-intensity exercise impacts cortisol concentration in the elderly population [46, 47]. Certain authors emphasise that hormonal changes can be affected by such factors as stress, anxiety, mental state, and the economic status of a person [48, 49]. By taking these variables into account, researchers may control these factors and understand better the mechanisms underlying the impact of physical activity on cortisol concentration. Other authors suggest that the elderly population needs more time for hormonal adaptation to occur in response to physical exercise [50]. The present study revealed a statistically significant reduction of cortisol concentration after a four-week PFMT intervention program (p< 0.001). Furthermore, we examined studies that reported a relationship between cortisol concentration, obesity, and metabolic syndrome. It has been demonstrated that higher urinary free cortisol (UFC) was positively associated with waist-to-hip ratios [51, 52], subcutaneous adipose tissue [53], BMI score [54], and the presence of metabolic syndrome [55]. In the following study, there was no statistically significant correlation between cortisol concentration and the BMI score in the EG at the initial assessment (r = –0.029) as well as after completing the PFMT intervention program (r = –0.177). Based on the results of our own research and the analysis of data available in the literature on the subject, we believe that further studies are necessary to observe the regulation of testosterone and cortisol concentrations and explain the mechanisms underlying these effects. Furthermore, concentration determination of testosterone and cortisol is a method that may help to objectify pelvic floor muscle training outcomes in elderly women with stress UI.
Conclusions
PFMT caused a statistically significant increase in testosterone concentrations in the study group.
PFMT caused a statistically significant decrease in cortisol concentrations in the study group.
No statistically significant correlations were found between testosterone and cortisol concentrations and BMI score in the study group.
After PFMT, no statistically significant correlation was found between testosterone and cortisol concentrations in the study group.