INTRODUCTION
Ongoing training and match load, as well as fatigue monitoring are crucial in modern soccer. Training monitoring is particularly relevant for national team players, who have international duties in addition to their club fixtures. One of the most widely used biomarkers to monitor muscle fatigue in soccer, is creatine kinase (CK) [1]. CK accumulates in the blood in response to training and match load, mainly as a result of eccentric muscle contractions (e.g., during decelerations and changes of direction) [2]. Many studies have used CK to follow muscle recovery after matches [3–5]. CK reaches its peak 24 hours post-activity in team sports but restoration to baseline levels may take 42–120 hours [6, 7].
Congested schedules (CS) are a hot topic in soccer as they may influence players’ subjective readiness to play, match physical, technical and tactical performance as well as injury risk [8]. According to a recent definition, CS occur when at least two consecutive matches are played with less than 96 hours of recovery [8].
There is limited evidence examining the CK response in CS and non-congested schedules (NCS) in soccer players. In a study with players from the top three divisions, the experimental group played three consecutive matches with three and four recovery days, while the control group only trained during this period [9]. Post-match CK response was highest after the second match, which was not explained by the match physical performance, but rather, the shorter (3 days) pre-match recovery time. In a more applied study, CS weeks (two matches within 4 days) and NCS weeks (two matches within 5 or more days) were compared in 23 elite adult players [10]. Match day (CKMD) and the following day’s (CKMD+1) CK did not differ between conditions, but CK two days after the match (CKMD+2) was significantly higher in CS. Another study compared the CK response of a Premier League team in CS (less than 4 days recovery between 2 matches) and NCS (more than 4 recovery days) during two seasons [11]. Playing at least 60 minutes in the first game resulted in significantly higher second CKMD values in CS, which was confirmed by the higher subjective pre-match fatigue. Interestingly these differences between CS and NCS did not exist for CKMD+1.
Even fewer studies have examined the same topic in the national team context. In one study, Croatian National Team players were followed during the World Cup preparation and group stage [12]. However, only 11 players met the inclusion criteria, they did not measure CKMD, and five recovery days between matches was afforded to players, meaning they did not meet the definition of CS. CK dynamics of youth players during congested schedules is another gap in the scientific literature. One study did not find any differences in the CK response in young soccer players around and post-peak height velocity [13]. On the other hand, U15 players needed 48 hours to recover CK after a match, while 24 hours were sufficient for the CK activity of U13 players to return to baseline, suggesting that biological maturity might affect recovery efficiency [14]. A recent work published CK, C-reactive protein (CRP) and subjective markers during a 9-match CS of the Brazilian U-20 national team [15]. Even though they did not measure CKMD, post-match CK response was higher after the first four matches, when between-match recovery time was shorter (48 vs 72 hours).
Therefore, this study analysed the effect of congested schedules on CK dynamics in the days following matches. More specifically, the purposes of our study were to : 1) compare CKMD values between CS and NCS as well as with different number of recovery days, 2) examine post-match (CKMD+1, CKMD+2, CKMD→MD+1%, CKMD→MD+2% change) CK response and 3) the possible effect of MD-1 training load on CKMD and CKMD+1 values in youth national team soccer players.
MATERIALS AND METHODS
Subjects
One hundred and eighty-eight U15-U21 youth national team soccer players (age: 16.5 ± 1.8 years, height: 181.0 ± 6.3 cm, mass: 72.6 ± 7.2 kg) met the inclusion criteria with 2489 individual data points between March 2016 and June 2023. The athletes trained 5–7 times a week and played 1–2 matches in their club. The players (and if < 18 years) their parents gave their informed consent to take part in this study, which was approved by the Ethical Committee of the Hungarian University of Sports Science (KEB/No9/2020). The investigation conformed to the Code of Ethics of the World Medical Association [16].
Design
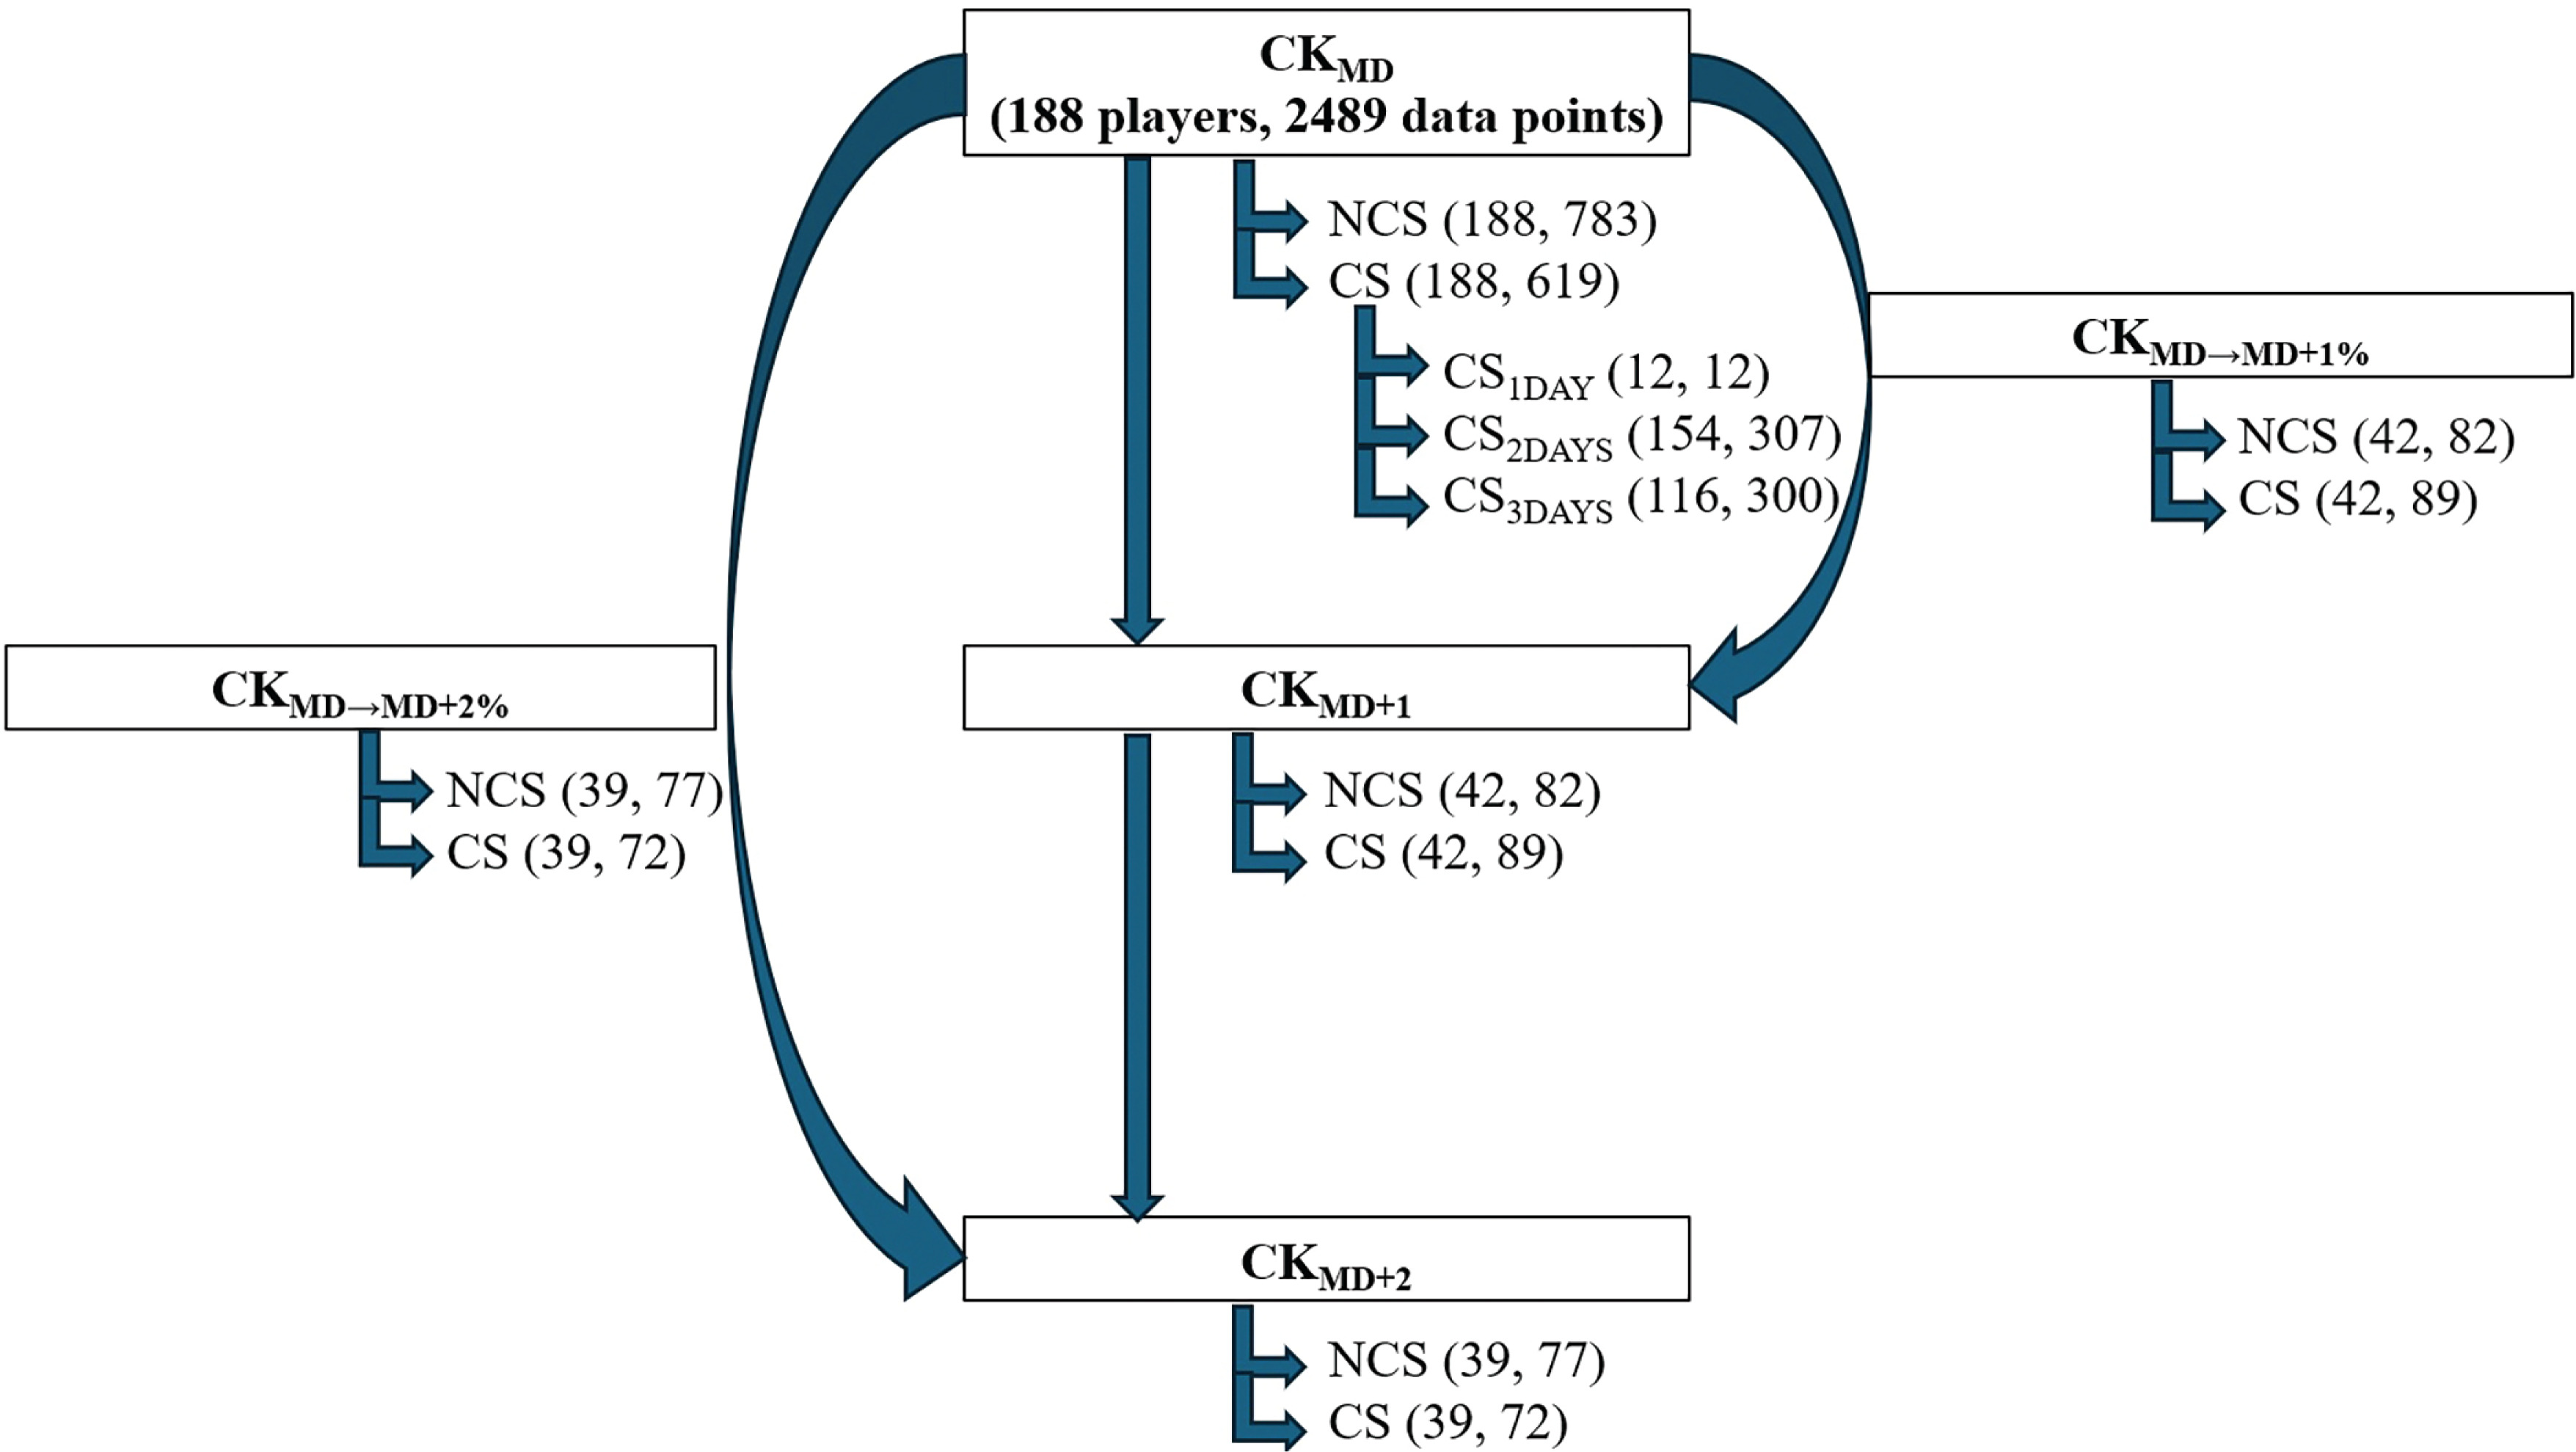
Players took part in different national team training camps during the study period (Figure 1). CK was measured each morning and GPS/GNSS devices were used to record movement data during training sessions and matches. The existence of match day (MD) CK data was the first inclusion criteria (Figure 2.). If any GPS data of the three days leading to MD (MD-3, MD-2, MD-1) was missing, the player was excluded from the sample (1087 data points out of 2489, Figure 2). If available, CK values on the first and second days after the match (CKMD+1, CKMD+2) were also added to the sample. Figure 2 shows the number of data points for each scenario (CKMD, CKMD+1, CKMD→MD+1%, CKMD+2, CKMD→MD+2%).
FIG. 1
Main types of training camps of the national team preparation. A) After playing in their club at the weekend, the soccer players arrive to the national team on Sunday afternoon taking part in a recovery session. One or two tactical trainings help to prepare them for the international match on Tuesday. Players with <45 minutes playing time have a compensation session, the other players a recovery programme on Wednesday. The training camp finishes with another international friendly game on Thursday. B) Typical preparation programme of the U21 team. After 3-5 training sessions, they play an international match, which is followed by two training sessions and a second match. C) Previous youth tournaments were organized, where three friendly matches were played with one recovery day in-between. D) During European Qualifications three matches are played with two recovery days separating them. Black arrows indicate daily creatine-kinase measurements. Rec.= recovery session, comp.=compensation session.
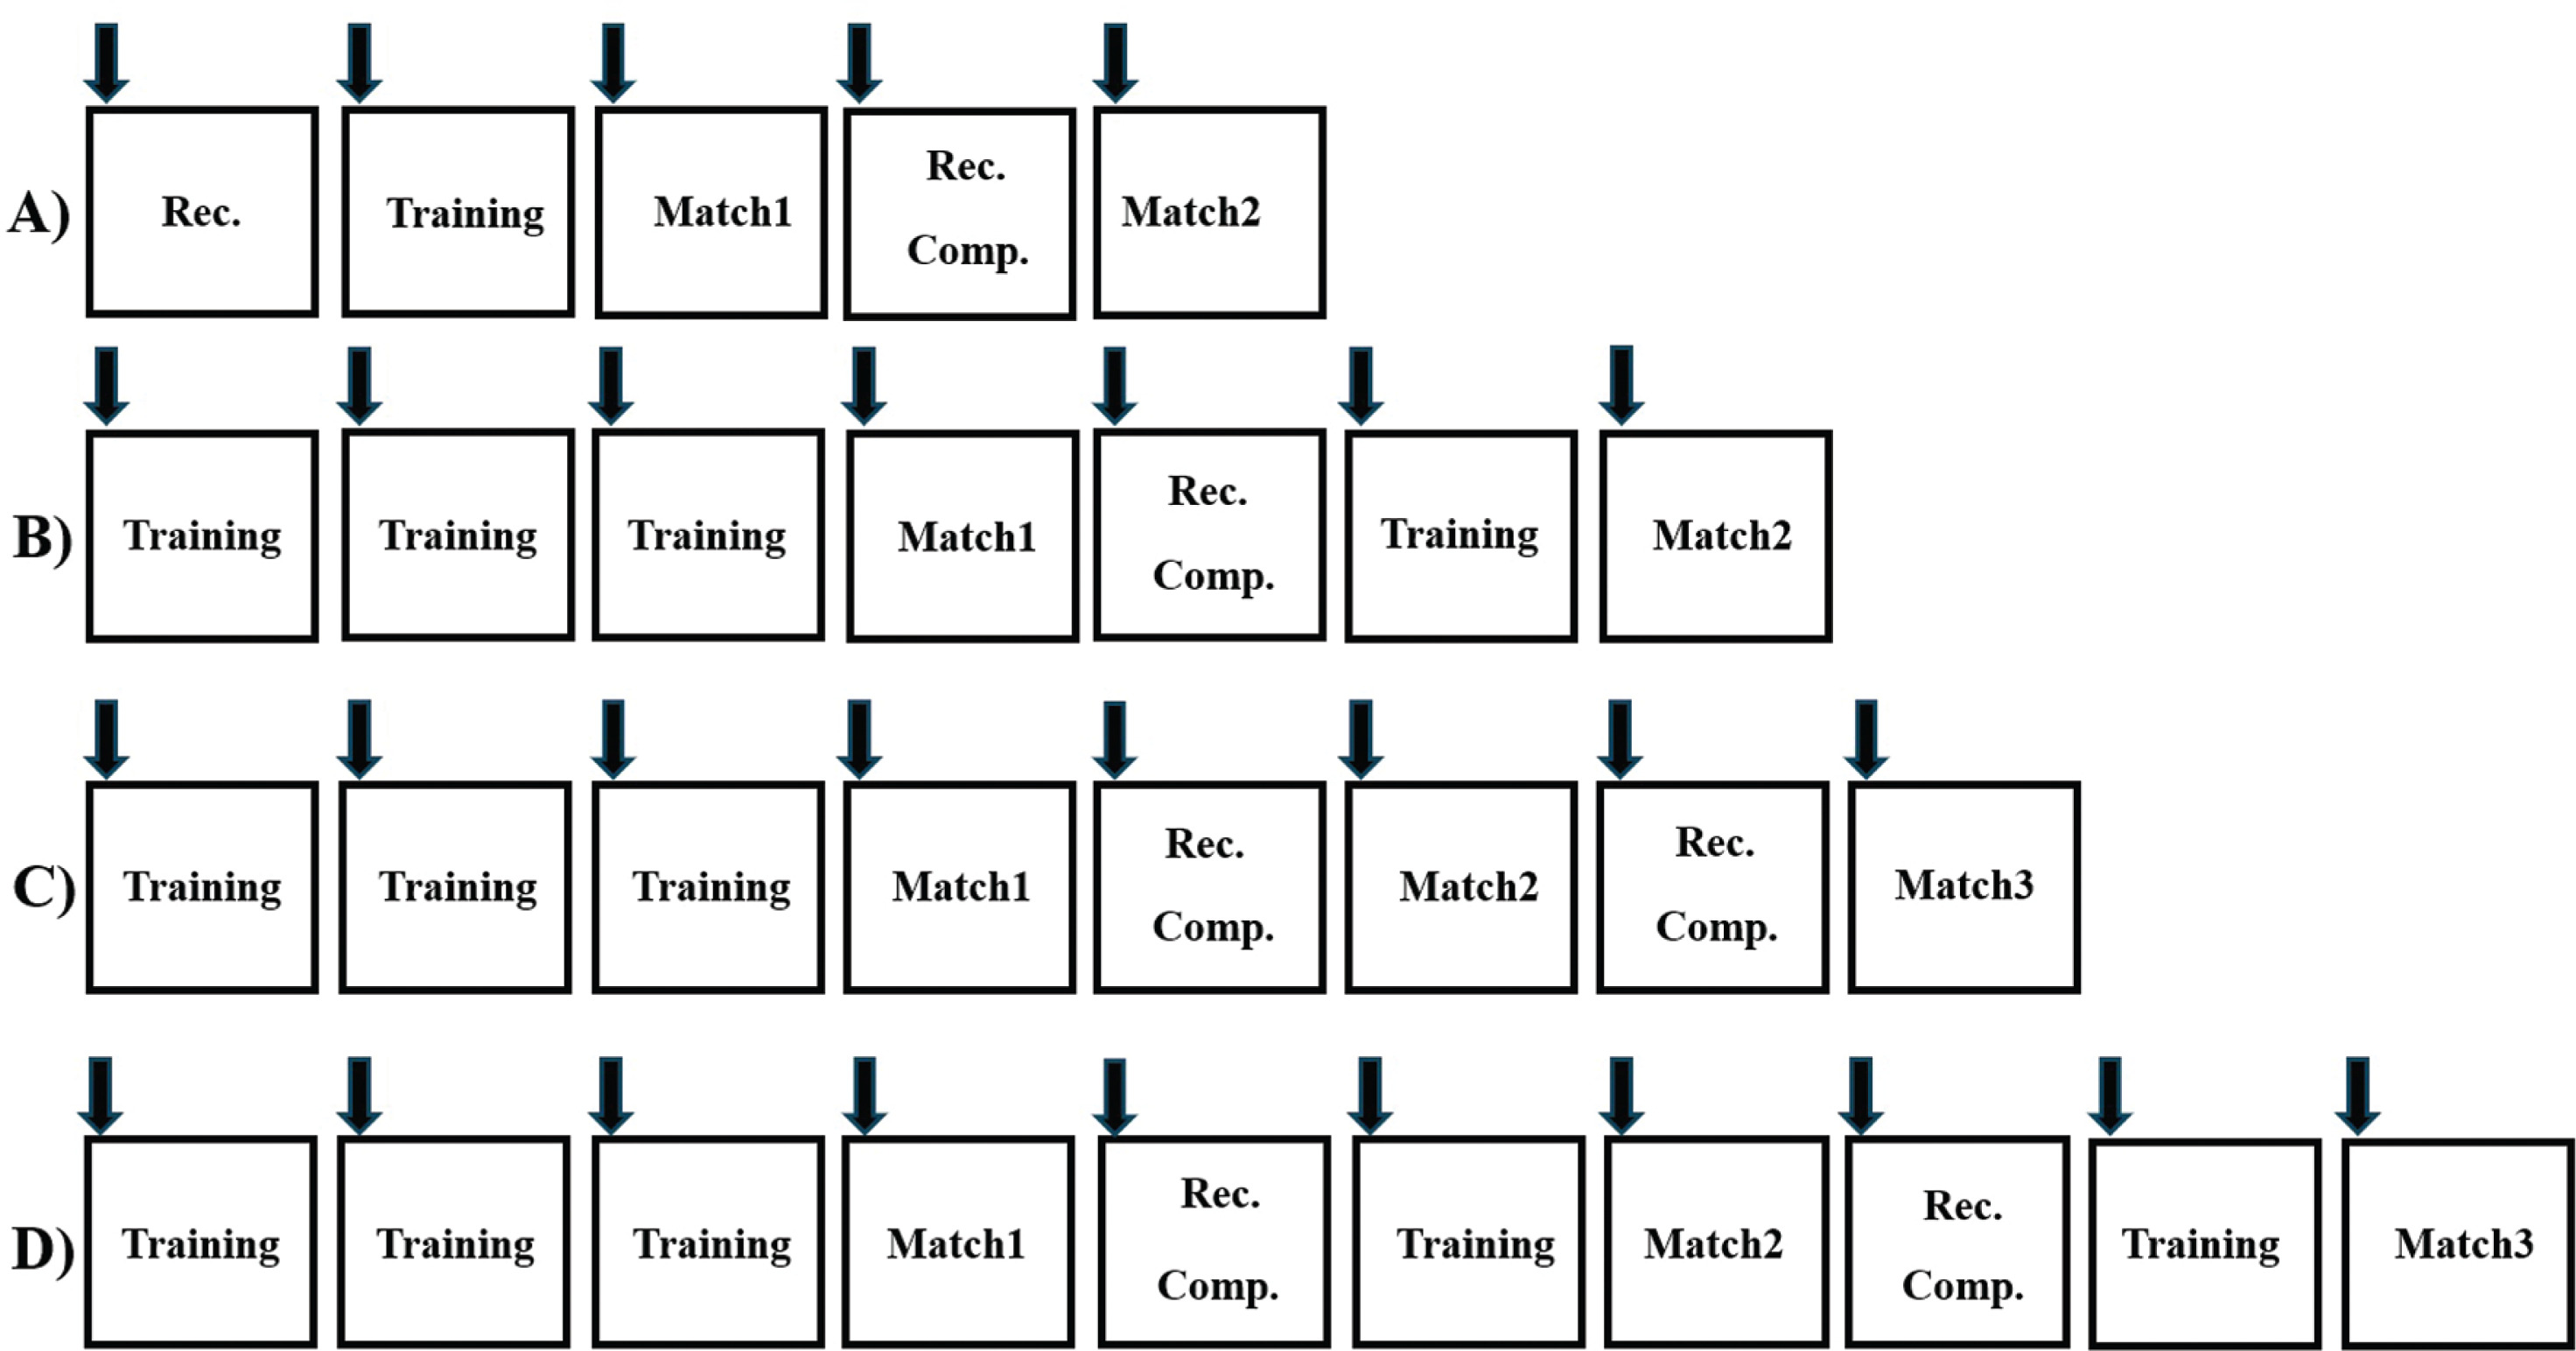
FIG. 2
Number of players, creatine-kinase (CK) data points (in the parenthesis) according to congested (CS) and non-congested (NCS) schedule in the study. CKMD: CK on match day, CKMD+1/MD+2: CK one or two days after the match, CKMD→MD+1/+2%: relative CK change (%) from match day to one or two days after, CS1/2/3DAYS: congested schedules with 1/2/3 recovery days before the second match day. Recovery day indicates the number of days since the last match. E.g. CS (39,72) for CKMD+2 means that 39 players had 72 individual CK data points two days after the match. These players also had CK values on match day and one day after the match.
Congested schedule
MD was considered as CS when the player played at least 60 minutes on one of the preceding days (MD-1, MD-2, MD-3) [11]. All other cases were treated as non-congested schedule (NCS). Therefore, four possible categories were available:
NCS: The player trained on MD-3, MD-2 and MD-1 or his match playing time was less than 60 minutes.
Congested schedule with 3 days rest (CS3DAYS): The athlete played at least 60 minutes on MD-3. MD-1 and MD-2 consisted of training sessions or matches with less than 60 minutes playing time.
Congested schedule with 2 days rest (CS2DAYS): The player played at least 60 minutes on MD-2. On MD-1 he trained or played less than 60 minutes.
Congested schedule with 1 day rest (CS1DAY): MD-1 contained a match with at least 60 minutes playing time.
Methodology Creatine kinase
CK samples were taken each morning from fingertips between 8–10 am after overnight fasting as described previously [17, 18]. Whole capillary blood was analysed using Reflotron Plus Clinical Chemistry Analyser (Roche Diagnostics) between 2016 and 2021. The validity [19] and reliability [20] of this system has been shown previously. Between 2022–2023, SimplexTas 101 Immuno Chemistry System (Tascom, South Korea) was used to determine CK from capillary blood. The validity of the system was checked against the output of an accredited medical laboratory using venous samples [21]. Based on our previous comparison, a correction equation was applied between the Reflotron and Tascom systems, which allowed us to merge the whole CK dataset and increase sample size [22]. The CK results provided by the two machines were significantly correlated (r = 0.92, p < 0.05) [22], the mean absolute difference between the two machines was 110 U/L (95% confidence intervals: 94–127 U/L). The mean relative difference between machines was 56.5% (95% confidence intervals: 45–68%).
External load monitoring
The training and match activity profile of the players were monitored with 10 Hz GPS/GNSS units (Catapult S5 for field players and G5 for goalkeepers between 2016- June 2019, Catapult S7 for field players and G7 for goalkeepers from July 2019, Catapultsports, Australia). The players wore the units in custom-made vests between the shoulder blades, which minimized the movements of the units but did not limit the rotation of the torso. The validity of the Catapult S5 [23] and S7 [24] units has been published in previous studies. To quantify GPS signal quality, horizontal dilution of precision (HDOP) was applied; we only included activities when the average HDOP of the periods was < 1.1 [25]. The units also contained microsensors (accelerometer, gyroscope, magnetometer) with 100 Hz sampling frequency; their validity has been shown previously [26]. The 15 GPS/microsensor-derived parameters used in this study are defined in Table 1.
TABLE 1
Parameter groups, parameter names and parameter definitions (thresholds) used to characterize the training load one day before the match (MD-1).
[i] Note: Parameters are based on Global Positioning System (GPS) data and Inertial Movement Analysis (IMA). The main difference is that the latter does not require GPS signal. MD-1 training load was analysed whether it differs between congested and non-congested schedules and influences post-match creatine kinase response.
Statistical Analysis
Normality was checked with the Shapiro-Wilk test (p < 0.05) for each CK and GPS parameter distributions. If normality was violated, median and percentiles (2.5/5/10/90/95/97.5) were used as descriptive statistics. To compare two non-normally distributed samples, the Mann-Whitney-U test was used (significance set at p < 0.05). CKMD, CKMD+1, CKMD+2, CKMD→MD+1% as well as CKMD→MD+2% for CS and NCS, MD-1 training sessions’ GPS data for CS and NCS were analysed using Mann-Whitney-U tests. In these cases, U and p values, Z statistics and r effect sizes were reported to characterize the difference between samples. Effect sizes < 0.3 were rated as small, between 0.3–0.5 as medium effect and > 0.5 as large effect. To compare more than three, non-normally distributed samples, Kruskal-Wallis ANOVA was used (significance set at p < 0.05). In case of significant results, Mann-Whitney-U tests were used as post-hoc tests to compare the groups. CKMD values with different recovery days (NCS, CS3DAYS, CS2DAYS, CS1DAY) were analysed this way. All statistical analyses were performed in Python (version 3.10.6) using Sklearn (version 1.1.2) and Statsmodels (version 0.13.2).
RESULTS
CKMD and the effect of congested schedule
CKMD median and percentiles are shown for CS and NCS, as well as for CS with different recovery days in Table 2. CKMD for CS and NCS, as well as for CS with 2 or 3 recovery days were not normally distributed (p < 0.01). The only exception was CKMD CS1DAY (p > 0.05), but due to the low sample size (n = 12), non-parametric statistical procedures were applied. CKMD was significantly higher for CS than for NCS (p < 0.01). Significant differences were found between MD CK values based on the recovery days since the last match (χ2 = 125.05, p < 0.01). According to the post-hoc tests, CS1DAY CKMD was significantly higher than CS3DAYS CKMD (U = 2613, Z = 2.65, p < 0.01, r = 0.15) and NCS (U = 7333.5, Z = 3.34, p < 0.01, r = 0.12). Furthermore, CS2DAYS CKMD was significantly higher than CS3DAYS CKMD (U = 58653.5, Z = 5.83, p < 0.01, r = 0.24) and NCS (U = 169686, Z = 10.59, p < 0.01, r = 0.32). Finally, CS3DAYS CKMD was significantly higher than NCS (U = 137745, Z = 4.41, p < 0.01, r = 0.13).
TABLE 2
Match day (MD) creatine-kinase percentiles for all data points, as well as for congested and non-congested schedules.
CKMD+1 and CKMD→MD+1% CK change
CKMD+1 for CS and NCS as well as CKMD→MD+1% for CS and NCS were not normally distributed (p < 0.05). CKMD+1 was significantly higher with small effect size in CS than in NCS (median: 678 vs 487 U/L, U = 4678, Z = 3.18, p < 0.01, r = 0.24) (Figure 3, Table 3). On the contrary, CKMD→MD+1% was significantly higher with small effect size in NCS than in CS (median: 181 vs 135%, U = 2755, Z = -2.76, p < 0.01, r = 0.21) (Table 3).
FIG. 3
Absolute creatine-kinase (CK) values for match day (CKMD), one (CKMD+1) and two days after the match (CKMD+2) for noncongested (blue) and congested (red) schedules. * Indicates a significant difference according to the Mann-Whitney-U test between congested and non-congested schedules for that day (match day, one or two days after the match). Only players with CKMD, CKMD+1 and CKMD+2 values are shown on the figure. The line inside the boxes indicates the median value, the length of the box represents the first and third quartiles of the data points (the length of the box is the interquartile range). The whiskers (lines) outside the box are 1.5 times interquartile ranges from the box. The coloured dots represent the individual data points.
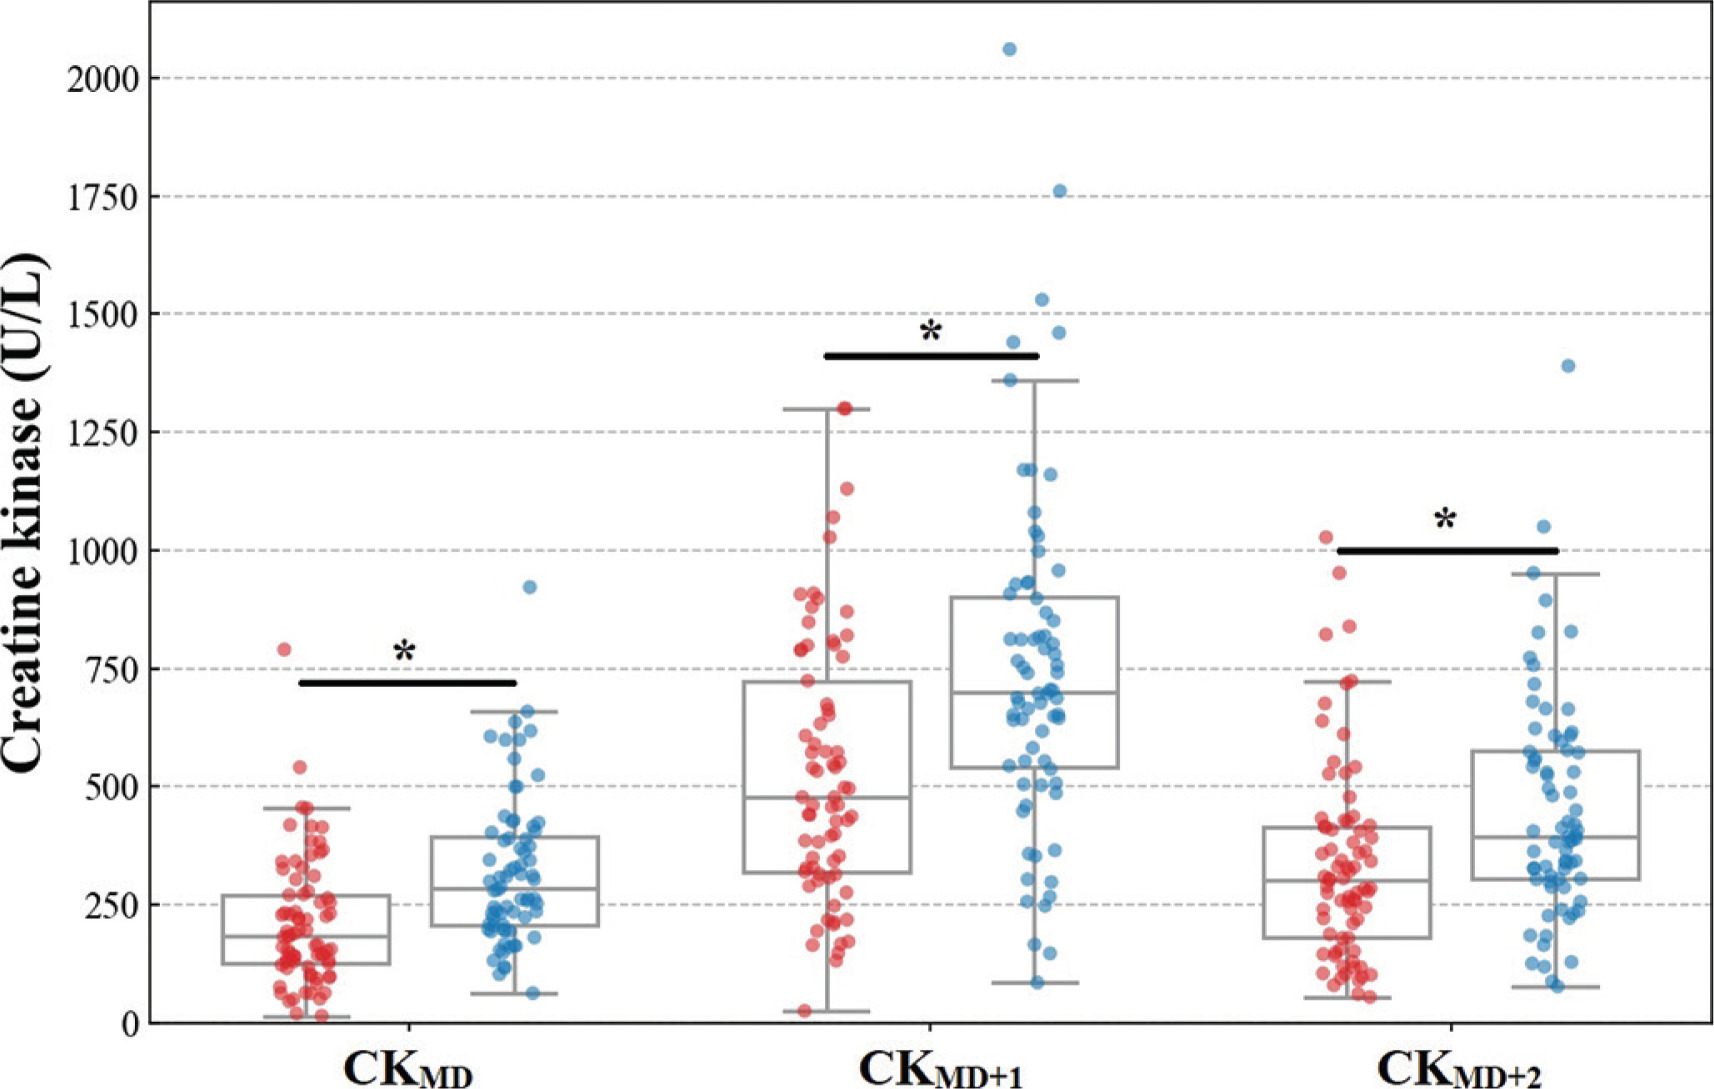
TABLE 3
Creatine-kinase (CK) percentiles for match day (CKMD), one (CKMD+1) and two days after the match (CKMD+2) as well as percentage CK change from match day to the day after (CKMD→MD+1%) and two days after the match (CKMD→MD+2%) for congested and non-congested schedules.
[i] Note: For MD+1 subset, players were required to have CKMD and CKMD+1 values, for MD+2 subset CKMD, CKMD+1 and CKMD+2 CK values. This is the reason why number of data points and percentiles are different for the MD+1 and MD+2 subsets. E.g. the first row shows the MD CK percentiles for non-congested schedules for the players, who had CKMD and CKMD+1 values.
CKMD+2 and CKMD→MD+2% CK change
CKMD+2 for CS and NCS as well as CKMD→MD+2% for CS and NCS were not normally distributed (p < 0.05). CKMD+2 was significantly higher with small effect size in CS than in NCS (median: 395 vs 303 U/L, U = 3663.5, Z = 3.39, p < 0.01, r = 0.28) (Figure 3, Table 3). On the contrary, CKMD→MD+2% was significantly higher with small effect size in NCS than in CS (median: 74 vs 44%, U = 2156, Z = -2.34, p < 0.05, r = 0.19) (Table 3).
MD-1 training GPS data and the effect of congested schedule
MD-1 training GPS parameters for CS and NCS were not normally distributed (p < 0.01) (Table 4). Table 4 shows the percentile values of different MD-1 training load parameters for CS and NCS. The number of data points for CS and NCS differs between parameters. This is caused by the fact that due to poor GPS signal quality (HDOP < 1.1), GPS-based parameters were excluded from the analysis in some cases, which did not influence IMA-derived parameters. MD-1 training load parameters for NCS were significantly higher with small effect size than those for CS, except from sprint distance, distance > 30 km/h, maximal velocity and number of accelerations > 2 m/s2 (Table 5).
TABLE 4
Percentiles of training load data one day before the match (MD-1) for non-congested (CS no) and congested schedules (CS yes).
[i] Note: Both Global Positioning System (GPS) and Inertial Movement Analysis (IMA)-based metrics are shown. Every two rows show the same MD-1 training load parameter for non-congested (upper) and congested schedules (lower row). Shapiro (p)= p value of the Shapiro-Wilk normality test for each parameter for non-congested and congested schedules. High-intensity distance (>19.8 km/h), sprint distance (>25.1 km/h), high metabolic power distance (>25.5 W/kg), high-intensity micromovements/accelerations/decelerations/left changes of directions/right changes of directions (>3.5 m/s, microsensor based), number of accelerations/decelerations (>± 2 m/s2, GPS-based).
TABLE 5
The results of the Mann-Whitney U statistical tests comparing training load one day before the match for congested (CS) and non-congested (NCS) schedules.
[i] Note: U= Mann-Whitney U value, p= significance (<0.05), Z statistics, r=effect size. Negative Z-value indicates that MD-1 training load for that parameter was higher for NCS than for CS. Significant differences between CS and NCS are highlighted in red. High-intensity distance (>19.8 km/h), sprint distance (>25.1 km/h), high metabolic power distance (>25.5 W/kg), high-intensity micromovements/accelerations/decelerations/left changes of directions/right changes of directions (>3.5 m/s, microsensor based), number of accelerations/decelerations (>± 2 m/s2, GPS-based).
DISCUSSION
We examined the sensitivity of CK to CS in youth national team soccer players. The main findings were: 1) with fewer recovery days since the last match, CK on the second match day increased significantly, 2) CKMD+1 and CKMD+2 absolute values were significantly higher in CS than in NCS, 3) CKMD→MD+1% and CKMD→MD+2% relative changes were significantly higher in NCS than in CS, 4) finally most of MD-1 training GPS data were significantly higher in NCS.
CKMD was significantly higher in CS (CS: 309 U/L, NCS: 220 U/L), if the player played at least 60 minutes in one of the last 3 days leading to the second match. This finding is in agreement with a recent study comparing single- and multi-match weeks in the Premier League [11]. Another study partly confirms this result: 1–3rd division players of the experimental group played three consecutive matches with three and four recovery days in-between, whereas the control group only trained [9]. CKMD was significantly higher for the experimental group on the second and third MD, suggesting an incomplete recovery. Another study did not find any difference in CKMD between CS and NCS in elite adult soccer players [10]. These studies were executed in club environments. As far as we know, only three studies have examined the CK response to matches of national team soccer players, but direct comparison is not possible due to methodological differences. One study examined the 2014 World Cup preparation and group stage of the Croatian National team [12]. Low sample size, five recovery days between matches and lack of CKMD measurement are the main limitations for comparison. Similarly, CKMD was not determined for the Brazilian U-20 national team during a 9 match-long congested schedule [15]. Finally, only CKMD+2 values were reported for 68 adult German National team players during European Championships and World Cups over a 10-year period [19].
To the best of our knowledge, this is the first study to examine the effect of recovery time between two consecutive matches on the second CKMD value. CK values were higher on the second MD when the previous match was more than three, three, two or one day before (NCS: 220 U/L, CS3DAYS: 263 U/L, CS2DAYS: 355 U/L, CS1DAY: 493 U/L). This confirms the sensitivity of MD CK for the recovery time and therefore residual fatigue since the last match. This finding has important practical applications, as it suggests that 72 hours between youth matches might not be enough for full recovery when the player played more than 60 minutes during the first game. This finding should be taken into consideration when organising youth soccer tournaments. Equally, coaches should consider using squad rotations effectively to manage the load of the players. Our study did not examine the mechanism/s behind the CK increase. According to a recent review, physiological fatigue (due to impaired calcium release and uptake) and mechanical fatigue (tissue damage caused by mechanical stress) might overlap [27]. These phenomena might be part of a continuum, with physiological fatigue as a starting point and muscle injury as an end point [27]. Both can elevate CK and due to its large molecule size, once entered into the bloodstream, clearance is slow [27]. Further studies should examine whether elevated CK levels on the second match day impairs match physical performance or increases injury risk during congested schedules in youth soccer players.
CKMD+1 values were significantly higher in CS than in NCS (median: 678 vs 487 U/L). Direct comparison with the literature is challenging, as some studies did not report exact CK values [9]. Similar CKMD+1 values (506 ± 242 U/L) were reported for the Croatian national team with 5 recovery days between matches as for NCS in our study [12]. However, much lower (CS: 301 U/L, NCS: 295 U/L) [10] and slightly higher values (CS: 704 U/L, NCS: 686 U/L) [11] were also published in elite adult soccer players. In contrast to our findings, these researchers did not report significant difference in the CKMD+1 values between CS and NCS [10, 11]. One explanation for the discrepant findings might be the different definitions for CS between studies: two matches within four [10] or five days [11] or 2–4 days in the current study.
In contrast to CKMD+1, CKMD→MD+1% was significantly higher in NCS than in CS (NCS: 181%, CS: 135%). In case of CS, a higher CKMD (CS: 287, NCS: 183 U/L) was associated with a lower relative change in CKMD+1 than in NCS. Similar magnitude CKMD→MD+1% (NCS: 145%, CS: 116%) was reported for adult Premier League soccer players [11], but another study reported much lower relative changes (NCS: 61%, CS: 36%) [10]. Taking the timing of the measurement into consideration this finding is somewhat surprising. Similarly to our protocol, the first study measured CK 12–19.5 hours after the end of the match depending on kick off time [11]. As CK is reported to peak 24 hours after the match in team sports [5] and the authors of the second study measured CK after 24 hours [10], they expected to observe higher changes, but this was not the case. They hypothesized that this result was due to most matches occurring after the beginning of the preseason, when players were the most physically prepared [10]. Further studies either did not report exact CKMD and CKMD+1 values [9] or did not measure CKMD [12, 15], therefore cannot be used for comparison.
As CKMD→MD+1 absolute CK change did not differ between conditions (CS: 324, NCS: 298 U/), the influence of the repeated bout effect (RBE) might have been minimal on our results. According to the RBE, a similar magnitude second eccentric load within days or weeks will result in an attenuated muscle damage response than the first one [28, 29]. However, the short time (1–3 days) between matches might have offered inadequate recovery time for the second match, as suggested by the higher CKMD values in CS.
CKMD+2 values were significantly higher in CS (CS: 395 U/L, NCS: 303 U/L), while CKMD→MD+2% was significantly higher in NCS (NCS: 74%, CS: 44%). This suggests that our players were still recovering two days after the match, as median CKMD+2 was still higher than CKMD. This is in contrast to previous findings, where CKMD+2 values were lower than MD [10] or MD-1 values [12]. Unlike our population of youth players, the above findings were from studies of adult players [10, 12]. Our inclusion criteria was to include players with full matches only, whereas previous studies used either 75 minutes playing time as criteria [10] or no criteria at all [12]. Finally, we measured CKMD+2 ~39 hours after the end of the match compared to 48 hours [10], which might have allowed extra recovery time for the players.
Regarding the CK trend, our findings are in agreement with the literature: CK reached its peak one day after the match (measured ~15 hours after the end of it), which is within the range previously suggested [5, 10, 12]. The return of CK to baseline was outside of the scope of this study, as it is suggested to occur 42–48 [5, 10, 12] or even 72–120 hours [6, 7] after the match, and our last measurement point was ~39 hours after the final whistle.
Previous reviews have suggested that CK reaches its peak 14–48 hours after matches [5]. We found significantly higher CKMD and CKMD+1 absolute values in CS than in NCS. Therefore, the question arises whether MD-1 training load might have influenced this trend. The results showed that MD-1 training load was significantly lower during CS (11 out of 15 GPS parameters, Table 5). This suggests that the elevated CK on MD and MD+1 were not the consequence of higher training loads on MD-1 but the residual fatigue from the previous match played within 3 days. We did not find significant differences between CS and NCS in four GPS parameters: in addition to maximal velocity, the low volume of sprint distance, distance > 30 km/h, as well as number of accelerations > 2 m/s2 which might explain these findings. Interestingly, most previous studies investigating CS did not examine the effect of MD-1 training load on the CK response after matches [11, 12, 15], although the studies that have been performed are equivocal. Training load of the experimental and control group did not differ statistically when playing three consecutive matches with three and four recovery days in-between [9]. These authors examined total and high-intensity distance, as well as average and maximal heart rate as training load indicators. In this case, MD-1 training load did not seem to influence post-match CK response. Conversely, MD-1 training load (i.e., relative distance, relative high-intensity distance and number of accelerations) was significantly higher in CS than in NCS in another study [10]. The authors hypothesized that decreased load on MD-2 might explain these findings. Even though MD-1 training load was higher in CS, in contrast to our findings, CKMD and CKMD+1 did not differ significantly between CS and NCS. The elite adult population and attenuated post-match CK response might explain these discrepancies.
Limitations
Our study has several limitations. First, several age groups (U15-U21) were included in the study to increase sample size. Biological maturity has been shown to influence CK response [14], but it should have limited effect in our sample as most players were post peak height velocity. Second, regarding the statistical methods, it should be emphasized that CS and NCS samples were not fully independent, as each player needed to have at least one CS and one NCS data point to be included in the analysis. As a result, the number of CS and NCS data points for a player are not necessarily the same, and as such, we treated the samples as independent. Third, the CK analyser was changed to another brand during the study period and GPS/GNSS was updated to a newer model of the same brand. As validation studies confirmed the validity of all of the equipment, these changes might have had limited impact on our results. Fourth, our standard recovery protocol after matches might have influenced our results as suggested by the literature [30], however it was standardized between age groups, therefore its effect should be comparable. Fifth, due to the applied nature of the study, we were not able to measure CK exactly 24 and 48 hours after the matches, which might have influenced peak CK and CK recovery kinetics [5]. Sixth, caution is needed when translating these results to a club environment, as the focus of physical preparation in the national team is to maximize player readiness for consecutive matches played with 1–3 recovery days. Finally, CK only shows one aspect of the recovery process, therefore further studies are needed to examine additional possible recovery markers (e.g. lactate-dehydrogenase, myoglobin, perceived wellbeing, etc.).
CONCLUSIONS
These findings show the sensitivity of CK to congested schedules and its applicability to monitor muscle recovery in similar scenarios. Consistent with results from senior players, CKMD, CKMD+1 and CKMD+2 values were significantly higher in CS than in NCS in elite youth national team soccer players. Furthermore, as the number of recovery days between two matches decreased, the second CKMD increased, suggesting an incomplete recovery 24–72 hours after the first match. This might have important implications for the scheduling of youth tournaments, where often one or two recovery days are only available between consecutive matches. Future studies should investigate whether elevated CKMD values have a negative effect on match physical performance or match injury risk. As MD-1 training load was higher in NCS than in CS, it does not explain the higher postmatch CK response in CS. Rather it might be the consequence of residual fatigue from playing at least 60 minutes during the previous match. As post-match CK values were higher in CS, but absolute CK changes similar between CS and NCS, the repeated bout effect in our sample is likely to be negligible.