
Introduction
Transcatheter aortic valve implantation (TAVI) is a minimally invasive procedure that is being more often applied in the treatment of symptomatic severe aortic stenosis (AS) [1]. It is used as an alternative to surgical valve replacement (SAVR) usually in elderly patients with intermediate-to-high operative risk [1, 2]. The benefits of TAVI over SAVR include reduced trauma, no application of invasive cardio-pulmonary bypass (CPB), and decline in prevalence of such complications as atrial fibrillation, respiratory failure, bleeding or acute kidney injury (AKI) [2]. The need for fluoroscopy and angiography using a contrast agent to aid in the positioning of the valve may also contribute to AKI [3]. In addition, periods of hypotension due to the rapid pacing for balloon valvuloplasty and valve deployment may also lead to this complication [4, 5]. Together, the prevalence of AKI following TAVI is not trivial and kidney performance must be strictly monitored in the early post-procedural period [4]. Some researchers have claimed that one of the most prominent factors at the metabolic level responsible for a negative impact on kidney performance soon after TAVI and other cardiac surgical procedures is an inflammatory response and oxidative stress [6, 7].
Aim
Therefore, we decided to check if there was any association between blood morphological parameters reflecting inflammatory response and renal function after TAVI in a single cardiac surgical center.
Material and methods
Patients
Our study involved 176 consecutive TAVI patients (96 (54.5%) females and 80 (45.5%) males) with the mean age of 78.4 ±7.0 years who underwent TAVI through transfemoral (TF) access (TF-TAVI) between January 2013 and March 2017. Patients in whom TAVI bioprostheses were delivered through other accesses (such as transapical (TA), direct aortic (DA), or through the carotid artery (CA)) and those who had serious vascular complications and/or cardiac tamponade requiring surgical interventions were excluded from the study (Figure 1). Preoperative demographics and selected clinical data are summarized in Table I.
Figure 1
Enrollment process for the current study
CA – carotid artery (access), DA – direct aortic (access), SVC – serious vascular complications, TA – transapical (access), TAVI – transcatheter aortic valve implantation, TF – transfemoral (access).
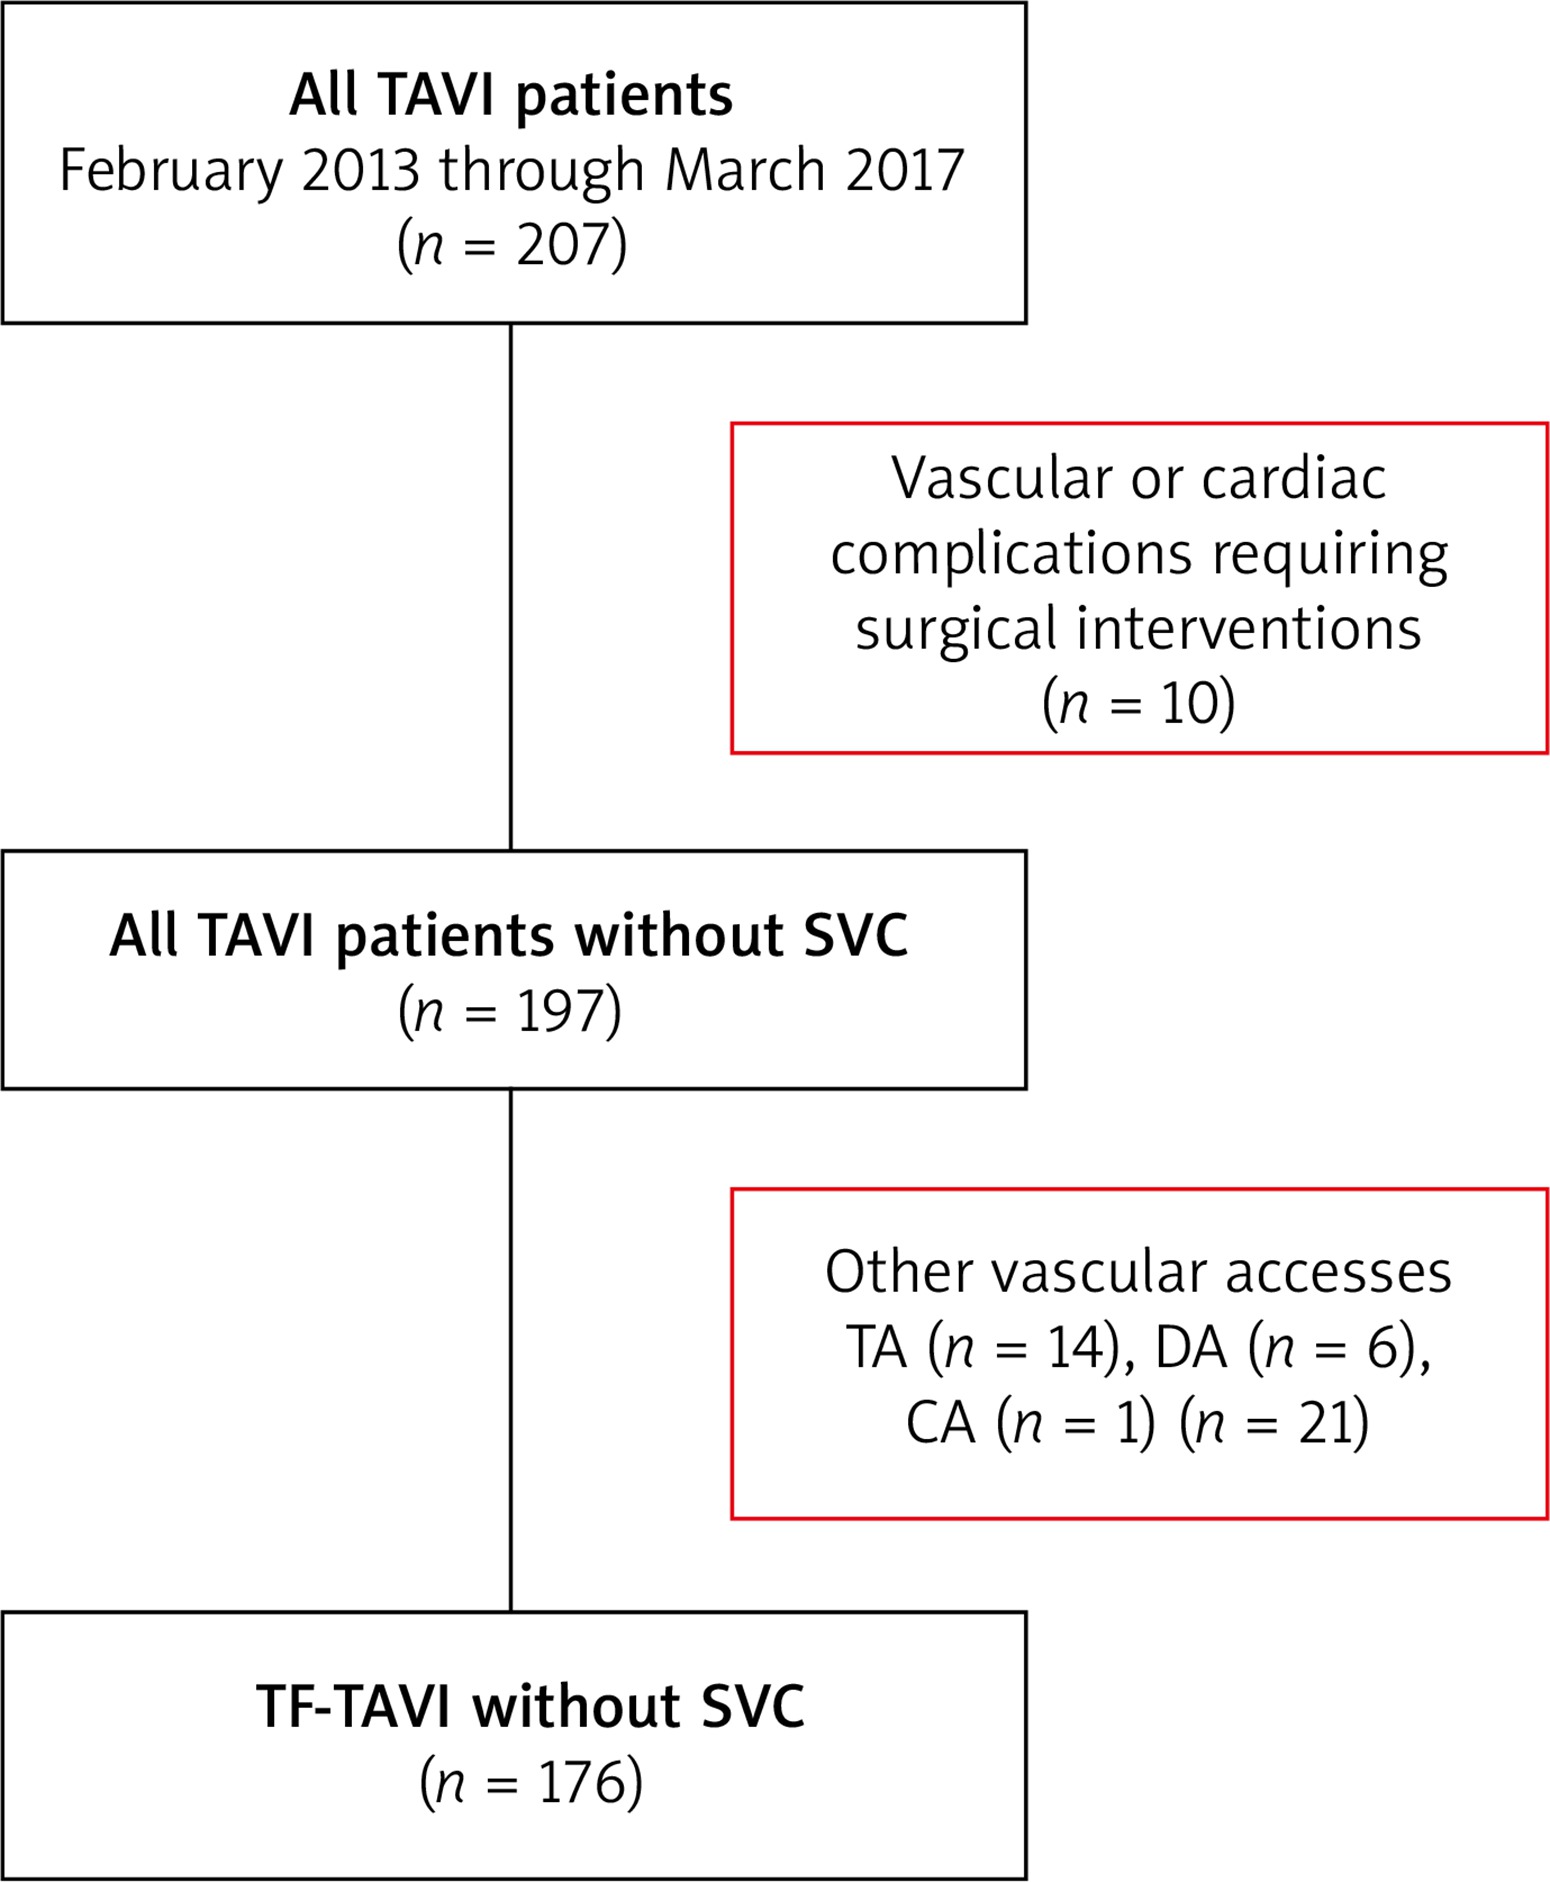
Table I
Preoperative demographics and selected clinical data (n = 176)
| Parameter | Value |
|---|---|
| Age [years] | 78.4 ±7.0 |
| Females | 96 (54.5) |
| BMI [kg/m2] | 28.0 ±4.7 |
| Obesity (BMI > 30 kg/m2) | 55 (31.3) |
| Hypertension | 125 (71.0) |
| DM | 58 (33.0) |
| COPD | 37 (21.0) |
| CKD (3+)* | 103 (58.5) |
| TIA or stroke in anamnesis | 31 (17.6) |
| MI in history | 64 (36.4) |
| Previous permanent pacemaker implantation | 27 (15.3) |
| AF | 66 (37.5) |
| EuroSCORE II (%) | 4.8 (2.9–9.2) |
| STS risk score (%) | 5.2 (3.3–14.3) |
Due to the retrospective nature of our analysis, we did not apply to the Local Bioethical Committee for approval. However, all principles outlined in the Declaration of Helsinki were respected.
Preoperative examinations
All severely symptomatic AS subjects were qualified for the TAVI procedure by the institutional multidisciplinary heart team consisting of an interventional cardiologist, cardiac surgeon, and specialist in echocardiography. This was done on the basis of available clinical data, laboratory and imaging studies’ findings such as coronary angiography, transthoracic echocardiography (TTE) and contrast-enhanced computed tomography (CT) with off-line reconstruction to evaluate the aortic valve and access site (femoral and iliac arteries).
In our analysis, we paid special attention to the basic morphological parameters such as counts of leucocytes (white blood cells – WBC), neutrophils (NEUT), lymphocytes (LYMPH), platelet (PLT), mean platelet volume (MPV), and markers of renal function (creatinine (CREA) and estimated glomerular filtration rate (eGFR) according to the MDRD formula). Moreover, a blood morphology-derived marker of inflammation, neutrophil-to-lymphocyte (NLR) ratio, was also assessed (Table II).
Table II
Preoperative laboratory results (n = 176)
[i] #Data are presented as the mean with standard deviation (SD) (if normally distributed) or the median with interquartile range (IQR) (the others).
[ii] eGFR – estimated glomerular filtration rate, HGB – hemoglobin concentration, HCT – hematocrit, LYMPH – lymphocyte count, MPV – mean platelet volume, NEUT – neutrophil count, NLR – neutrophil-to-lymphocyte ratio, PLT – platelet count, RBC – red blood cell count, RDW – red blood cell distribution width, WBC – white blood cell count.
Aortic valve implantation
General anesthesia or deep sedation was used during the procedure. A temporary pacemaker was inserted from the femoral vein for rapid pacing and as a backup in case of iatrogenic complete atrioventricular block.
In patients with the percutaneous femoral approach, two Proglides were introduced before insertion of the vascular sheath. The following aortic bioprostheses were implanted: CoreValve or CoreValve Evolut R (Medtronic Inc., n = 139), Lotus (Boston Scientific; n = 35), and Accurate (Symetis SA, n = 2). Once the prosthesis was correctly positioned and deployed, contrast injection was performed to assess the presence and degree of paravalvular leak (PVL). Control angiography of the access site was performed to assess vessel patency and possible bleeding. At the end of the procedure, TTE was obligatory to assess valve function and control the pericardial sac.
Postoperative course
All patients after the TAVI procedure were meticulously monitored. Renal function was monitored systematically by means of serum CREA concentration. Incidents of acute kidney injury were evaluated adopting the criteria of the VARC-3 Writing Committee [8]. Additionally, blood morphology was assessed every 12 hours throughout the first 2 days, then on a daily basis. For purposes of this study, we collected such data before (baseline, bs) then 1, 24, 48, and 72 hours following TAVI interventions and eventually at the time of discharge. Post-procedural maximal or minimal values (max/min) and max/min-to-bs ratio of these parameters were also calculated.
No time-related changes in erythrocyte parameters were assessed since in some patients, red blood cell concentrates had to be transfused; therefore the results could not be considered as having any scientific value.
Statistical analysis
First, all continuous variables were checked for normality by means of the Shapiro-Wilk W test. Those meeting the criteria of a normal distribution were presented as the mean with standard deviation (SD) and then analyzed using repeated-measures ANOVA followed by the post hoc Tukey HSD test (for time-related changes within groups). Otherwise (i.e., for non-normally distributed continuous variables), they were presented as the median with interquartile range (IQR: 1st to 3rd quartile) and then analyzed statistically by the non-parametric ANOVA Friedmann test followed by Dunn’s multiple comparisons of ranks. Correlations between blood morphology-derived inflammatory markers were tested using Spearman’s rank correlation coefficient. Categorical variables were presented as the numbers (n) with percentage (%) and then compared by means of the χ2 test. The latter was interpreted using the scale provided by Chung and Salkin, where an r between 0.8 and 1.0 (or –0.8 and –1.0) was defined as very strong, between 0.6 and 0.8 as strong, between 0.4 and 0.6 as moderate, between 0.2 and 0.4 as a weak relationship [9]. A p-value < 0.05 was considered statistically significant. All statistical analyses were performed using Statistica 13.3 software (TIBCO Software Inc., Palo Alto, CA, USA).
Results
Time-related changes of basic morphological parameters
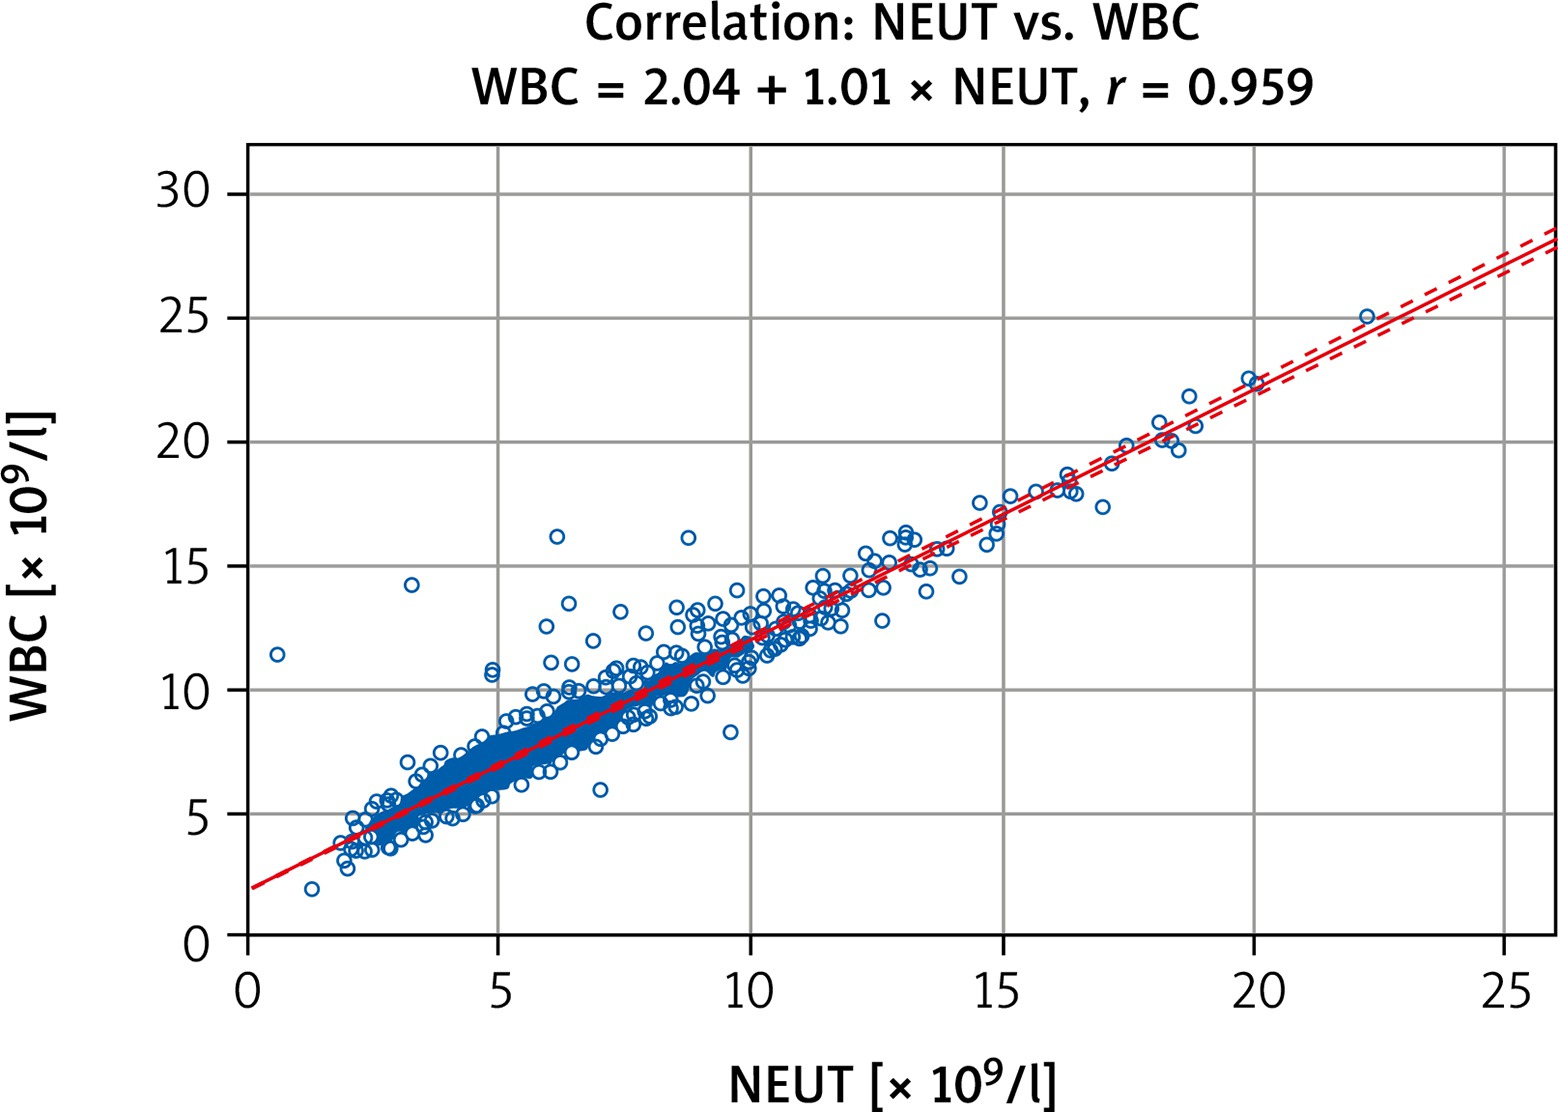
Both WBC and NEUT counts increased significantly (p < 0.001) after the procedure and reached peak values 24 hours afterward, from 7.24 ±2.05 to 9.51 ±3.16 × 10⁹/l and from 4.99 ±1.83 to 7.59 ±3.26 × 10⁹/l, respectively for WBC and NEUT (Figure 2 A). Their levels returned to the bs values at the time of discharge. Leucocytosis ≥ 12 × 109/l within the first 48 hours after TAVI was noted in 54 (30.7%) subjects. Otherwise, LYMPH counts declined markedly (p < 0.001) after the procedure with a minimum at the 24th hour (from 1.42 ±0.59 to 0.91 0.49 × 10⁹/l) and then started to increase to reach the baseline at discharge (e.g. usually on the 7th post-procedural day). Post-hoc analysis revealed significant differences (for all WBC, NEUT, and LYMPH) between sampling points 1 hour to 72 hours vs. baseline. Moreover, calculations of correlation revealed a very strong positive association between WBC and NEUT (r = 0.959; p < 0.001) (Figure 3). As a consequence of the aforementioned changes, a significant increase (p < 0.001) in NLR was also observed and its peak value was (median: 8.16, IQR: 5.69–12.61) noted 24 hours after TAVI (Figure 2 B).
Figure 2
Time-related changes of laboratory parameters following TAVI. Marked time-related variations were observed for leukocytes and their fractions (A) as well as for platelets (B). Consequently, a morphological parameter-derived marker of inflammation (C) changed also significantly. In the meantime, creatinine concentration increased markedly (D)
LYMPH – lymphocyte count, MPV – mean platelet volume, NEUT – neutrophil count, NLR – neutrophil-to-lymphocyte ratio, PLT – platelet count, WBC – white blood cell (leucocyte) count.
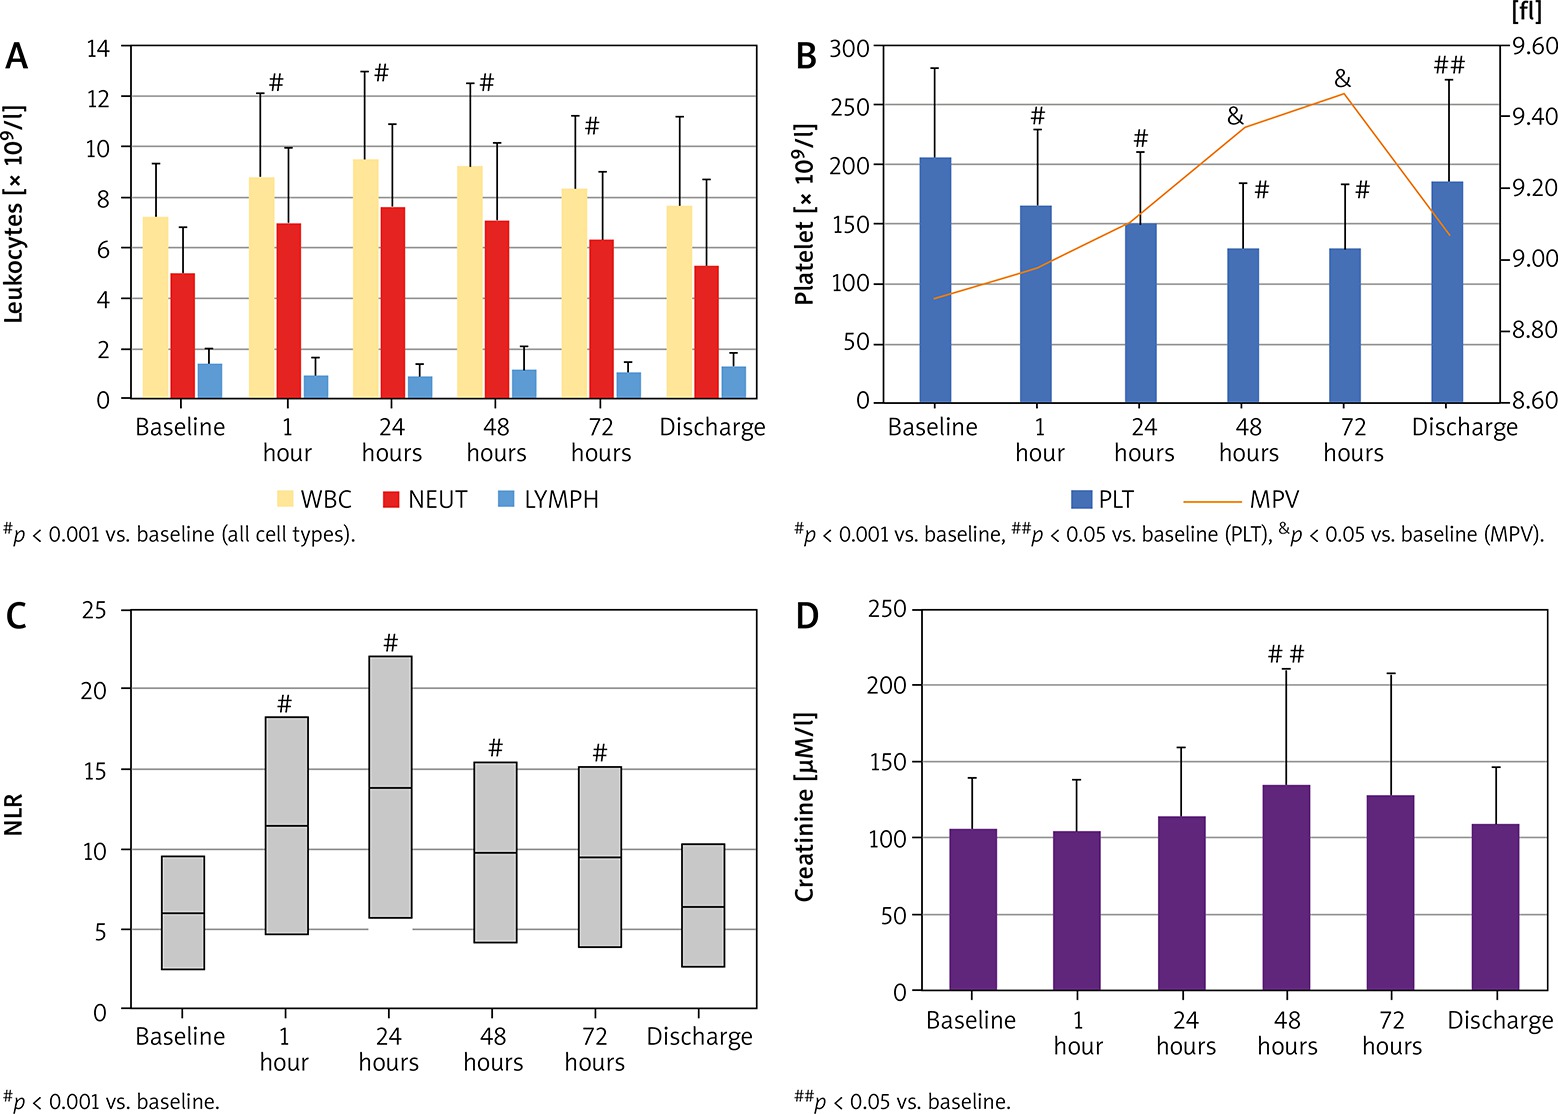
Platelet count (PLT) declined markedly with a minimum at the 72nd hour after TAVI (from 207 ±74 to 129 ±55 × 109/l; p < 0.001). But contrary to the other blood morphology parameters at discharge, it did not return completely to the admission level (187 ±85 × 109/l; p = 0.019 vs. baseline) (Figure 2 C). Mean platelet volume (MPV) increased significantly during hospitalization (p < 0.001). A post-hoc analysis revealed that at the 48th (9.4 ±1.2 fl) and 72nd (9.5 ±1.2 fl) hour following the procedure, platelets were markedly larger than not only before the procedure (8.9 ±1.1 fl; p < 0.001 vs. 48th and 72nd) but also 1 hour (9.0 ±1.1 fl; p = 0.017 vs. 48th and p = 0.006 vs. 72nd hour) after it. Of note, it returned to the admission value at the time of discharge (9.1 ±1.2 fl) (Figure 2 C).
Post-procedural renal function and AKI prevalence
TAVI was associated with a significant increase (p = 0.026 in ANOVA) in CREA concentration with a peak at 48 hours after the procedure (135.7 ±75.9 μM/l; p = 0.034 vs. bs and p = 0.014 vs. 1 hour) (Figure 2 D). Of interest, its level immediately after TAVI (104.3 ±34 μM/l) was comparable to the bs value (Table I).
Post-procedural AKI according to the VARC-3 criteria was noted in 65 (36.9%) TAVI patients. Among blood morphological parameters they (the AKI subgroup) had both higher maximal counts and relative changes in counts of WBC, NEUT and NLR, but markedly lower LYMPH compared to individuals without AKI (non-AKI subgroup) (Table III). Although minimal counts of PLT and maximal values of MPV throughout the post-procedural period did not differ between these groups, their relative changes (e.g. max/min-to-bs) were more pronounced in the AKI subset.
Table III
Maximal/minimal values of morphological parameters and their relative change vs. baseline
| Parameter | All (n = 176) | Non-AKI (n = 111) | AKI (n = 65) | P-value* |
|---|---|---|---|---|
| WBC max. [× 109/l] | 10.99 ±4.03 | 9.97 ±3.16 | 12.74 ±4.71 | < 0.001 |
| WBC max (48 h) ≥ 12 × 109/l (%) | 54 (30.7) | 25 (22.5) | 29 (44.6) | 0.002 |
| Δ& WBC (%) | 42.3 (22.0–76.2) | 34.3 (15.3–62.3) | 60.0 (40.1–109.8) | < 0.001 |
| NEUT max. [× 109/l] | 8.94 ±3.80 | 7.88 ±2.83 | 10.74 ±4.52 | < 0.001 |
| Δ NEUT (%) | 68.2 (37.7–125.7) | 60.5 (24.0–96.4) | 94.4 (53.4–143.1) | < 0.001 |
| LYMPH min. [× 109/l] | 0.77 ±0.38 | 0.82 ±0.38 | 0.68 ±0.35 | 0.012 |
| Δ LYMPH (%) | 45.3 (32.3–56.6) | 44.4 (30.2–55.0) | 47.4 (38.0–58.7) | 0.055 |
| NLR max. | 10.4 (7.3–14.9) | 8.4 (6.7–11.7) | 13.2 (10.1–20.9) | < 0.001 |
| Δ NLR (%) | 178.2 (114.7–311.3) | 158.8 (92.0–248.1) | 228.8 (145.9–359.7) | 0.004 |
| PLT min. [× 109/l] | 120 ±49 | 120 ±44 | 119 ±57 | 0.862 |
| Δ PLT (%) | 40.2 (30.8–48.9) | 39.7 (30.4–46.7) | 42.9 (32.9–52.4) | 0.036 |
| MPV max. [fl] | 9.8 ±1.3 | 9.7 ±1.7 | 10.1 ±1.5 | 0.061 |
| Δ MPV (%) | 8.4 (3.4–15.7) | 6.7 (2.4–13.5) | 13.3 (5.0–19.2) | 0.002 |
#Data are presented either as the mean with standard deviation (SD) (if normally distributed) or the median with interquartile range (IQR) (the others) whereas categorical data are presented as the number (n) with percentage (%);
* it refers to the comparison between AKI and non-AKI subgroups (bolded values indicate those of statistical significance);
Association between blood morphology and renal function
Correlation analysis revealed some associations between changes in values of morphological parameters and CREA concentration. Additionally, due to the fact that baseline parameters feature some variability, the correlation between their relative changes was also calculated. The strongest, although still moderate (see definition above), correlation between NLR and relative variation in CREA levels (Figure 4) was noted. The other, rather weak correlations, are outlined in Table IV.
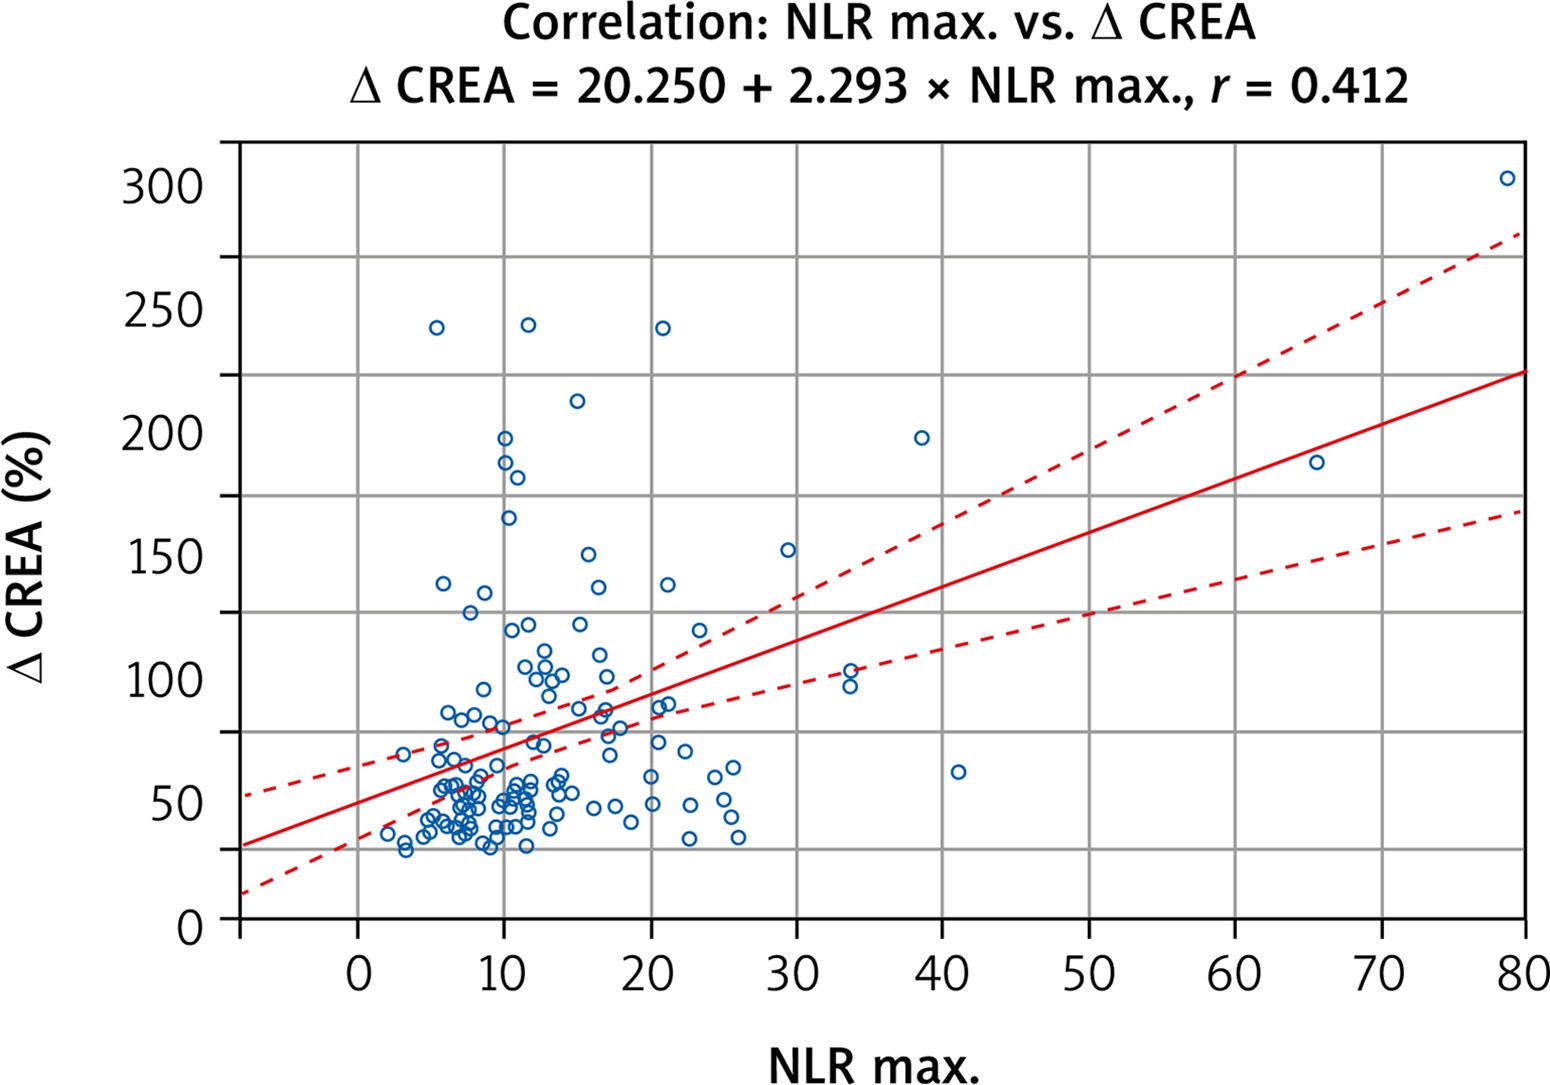
Table IV
Associations between absolute values and relative changes in blood morphological parameters and creatinine concentration
| Parameter | Max. creatinine [μM/l] | Δ creatinine (%) |
|---|---|---|
| WBC max. [× 109/l] | 0.305* | 0.306 |
| Δ& WBC (%) | 0.297 | 0.322 |
| NEUT max. [× 109/l] | 0.334 | 0.350 |
| Δ NEUT (%) | 0.230 | 0.303 |
| LYMPH min. [× 109/l] | –0.171 | –0.210 |
| Δ LYMPH (%) | 0.124 | 0.086 |
| NLR max. | 0.361 | 0.412 |
| Δ NLR (%) | 0.197 | 0.281 |
| PLT min. [× 109/l] | –0.065 | –0.037 |
| Δ PLT (%) | 0.118 | 0.168 |
| MPV max. [fl] | 0.120 | 0.041 |
| Δ MPV (%) | 0.185 | 0.251 |
Discussion
Our study showed that TAVI, while being considered a minimally invasive procedure, is still associated with an inflammatory response reflected by marked changes in some blood morphological parameters. Previously, leucocytosis ≥ 12.0 × 10⁹/l, among other parameters, was shown to characterize the systemic inflammatory response (SIRS) that can negatively impact outcomes after TAVI, including mortality [10]. Based on this hematological parameter, the incidence of SIRS after TAVI in our group (approximately 30%) was comparable or even slightly lower than in the previous reports [6, 10, 11]. It means that SIRS after minimally invasive valve implantation may still be a problem of clinical significance [10, 11]. Moreover, we did prove that the WBC count increase resulted mainly from the release of neutrophils from natural sources. In the meantime, LYMPH counts declined markedly after the procedure. Routine blood analysis does not allow to distinguish subpopulations of LYMPH, although the majority of them are probably T subtypes of LYMPH. It was proved earlier that the inflammatory level greatly influenced the differentiation and activity of T lymphocyte populations and that exposure to high levels of reactive oxygen species (ROS) decreases the capacity of their activation and proliferation [12].
As a consequence, the NLR value also changed markedly following the TAVI procedure. Recently, NLR has been an emerging biomarker of inflammation and of significant prognostic value. Therefore it has been studied in many disciplines of medicine, including cardiovascular medicine and surgery, in the last few years [13–15]. Among many others, a raised NLR value was also found to be associated with increased cardiac mortality, amputation in vascular operations, and raised risk of post-operative re-intubation [13]. In our experience, the NLR value was higher among individuals who developed AKI in the early postoperative period.
Of interest, the shape of changes in PLT and MPV in our TF-TAVI group looks like a mirror reflection. A decline in PLT is usually accompanied by an increase in MPV. The fluctuations in these basic thrombocyte parameters were found previously after cardiovascular interventions and were influenced by procedural invasiveness [16, 17]. Fewer changes in comparison to the baseline values were noted after minimally invasive procedures on the stenotic aortic valves [17]. The decrease in PLT was reported within a wide range from less than 30% to more than 50%; therefore our group was similar to the previous studies [16, 18, 19]. Many factors have been shown previously to contribute to a marked decrease in PLT, including advanced age, lower body mass, inevitable intraprocedural whole blood loss, the amount of the contrast infused, the time of the procedure, application of balloon-expandable prostheses, and the residual transvalvular gradient [18–20]. Of note, this effect is usually temporary, and not uncommonly 24 hours later (e.g. on the third post-procedural day) at least partial recovery is seen [21]. More pronounced drops in PLT were shown to be associated with poorer clinical outcomes, in our group in higher prevalence of AKI [16]. Declining PLT also reveals platelet activation and aggregation in a postoperative prothrombotic state. It can be a partial explanation why the nadir (the minimal value) in the early postprocedural period was lower among subjects who developed AKI, which may be due to endothelial dysfunction and platelet hyperactivity in organ microcirculation. MPV is another platelet parameter that was found to have predictive value for the development of early adverse events following cardiac procedures. It was found to be a predictor of mortality and morbidity (particularly atrial fibrillation) after coronary artery bypass grafting (CABG) [22]. Higher MPV after invasive surgical procedures may reflect two vascular trauma-initiated biological processes. In the first one, cytokines released to the vascular system together with ROS provoke the bone marrow to produce new and larger platelets [23]. On the other hand, circulating platelets respond to vessel injury by changes in morphological shape (and tend to be larger) and likely aggregation to prevent blood loss [24].
Herein, more pronounced changes in the above-discussed blood morphological parameters were noted in the patients who developed transient renal dysfunction fulfilling criteria of AKI according to the VARC-3 [8]. Therefore, our study supported earlier opinions that one of the mechanisms responsible for AKI could be inflammatory reactions [25]. We observed in this study a significant correlation between the peak value of NLR (an inflammatory marker) and relative change in creatinine level after the procedure. Additionally, higher NLR as well as an increased rate of leukocytosis as a valuable marker of SIRS, with possibly severe consequences, among AKI cases were proved herein.
The authors of this study are aware of obvious limitations related to retrospective data analysis. However, we hope this preliminary report warrants further clinical research to find more mechanisms involved in the development of AKI following TAVI procedures. We plan to assess the impact of some blood morphological variables on the early and long-term prognosis. Eventually, a better understanding of pathomechanisms leading to AKI can help develop more effective preventive strategies and make TAVI procedures safer for high-risk patients.
Conclusions
Transcatheter implantation of the aortic valve, although minimally invasive, is associated with significant changes in blood morphological parameters that reflect an inflammatory response to procedural trauma. They are more pronounced among subjects with post-procedural acute kidney injury.