
Introduction
Among women worldwide, cardiovascular disease (CVD) is the foremost contributor to mortality [1–3]. Notably, the transition through menopause is associated with an accelerated CVD risk. The period of menopausal transition is associated with a significant elevation in CVD risk. Postmenopausal women experience adverse changes in their cardiovascular risk profile – including increases in total cholesterol, triglycerides, low-density lipoprotein, and insulin resistance (IR) – alongside loss of the vasoprotective effects of oestrogen [1–3]. An independent association has been demonstrated in epidemiological research between elevated C-reactive protein (CRP) – a key biomarker of systemic inflammation – and increased risks of CVD events and mortality [4, 5]. Likewise, the triglyceride-glucose (TyG) index, calculated as ln [fasting triglycerides (TG) × fasting glucose/2], is a well-established surrogate of IR that correlates with incident diabetes and cardiovascular risk [2]. Both elevated CRP and an increased TyG index are risk factors for cardiovascular morbidity. However, relying on any single biomarker may not fully capture the complex interplay between metabolic dysfunction and inflammation in determining risk, especially in postmenopausal women who often exhibit both features concurrently.
Recently, the C-reactive protein-triglyceride-glucose index (CTI) has been proposed as a new composite measure that combines systemic inflammation and IR into a unified score [6]. The C-reactive protein-triglyceride- glucose index is calculated from CRP and TyG as 0.412 × ln (CRP [mg/l]) + ln (TG [mg/dl] × fasting plasma glucose (FPG) [mg/dl]/2) [2]. The rationale is that CTI provides a more comprehensive assessment of cardiometabolic dysregulation than either CRP or TyG alone [6]. Prior research has established a link between higher CTI levels and detrimental health consequences [7, 8]. For instance, CTI has been demonstrated to be associated with mortality in patients with coronary heart disease and type 2 diabetes [2], and it is significantly associated with the incidence of CVD and all-cause mortality among individuals with chronic kidney disease [3]. Additionally, CTI serves as a robust predictor for CVD mortality and all-cause mortality in broader cohorts [9]. These results collectively support the value of CTI as a novel and integrative biomarker of inflammation and metabolism that could aid risk stratification beyond traditional factors [10]. However, the relationship between CTI and mortality outcomes in generally healthy populations, particularly among postmenopausal women, remains underexplored.
The C-reactive protein-triglyceride-glucose index offers clinical practicality as it integrates two key pathophysiological pathways into a single, calculable score using commonly available laboratory parameters (CRP, triglycerides, and fasting glucose), potentially offering a more holistic risk assessment than any single biomarker in clinical practice. This analysis was designed to assess the association of the CTI with all-cause and cardiovascular mortality in a nationally representative sample of postmenopausal women in the United States. We hypothesized that higher CTI, reflecting combined inflammatory and metabolic burden, would be associated with a higher all-cause and cardiovascular-specific mortality risk in this cohort. The rationale for selecting the CTI in this population is that postmenopausal women frequently exhibit a concurrent rise in both inflammatory markers and insulin resistance, and the CTI is specifically designed to capture this synergistically detrimental interplay. We additionally sought to explore whether there is a threshold effect in the CTI-mortality relationship, given prior indications of possible non- linear dose-response [2]. By leveraging National Health and Nutrition Examination Survey (NHANES) cohort data with up to ~ 18 years of follow-up, this study provides insight into the prognostic relevance of CTI in postmenopausal women, a demographic facing rising cardiometabolic health challenges after menopause.
Material and methods
Study design and population
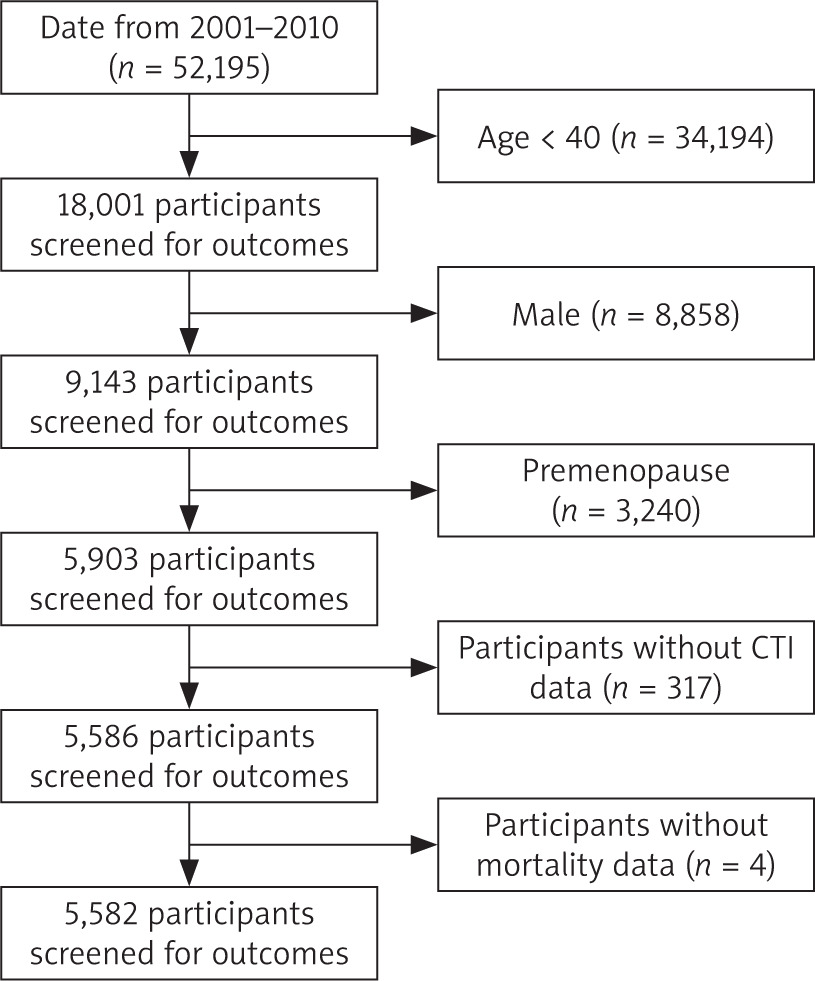
This study employed a retrospective cohort design using data obtained from the 2001–2010 cycles of NHANES. The National Health and Nutrition Examination Survey constitutes a population-based, continuously conducted series of cross-sectional surveys aimed at evaluating the health and nutritional status of civilian, noninstitutionalized residents of the United States [2]. The survey employs a stratified, multistage probability sampling method and comprises multiple data collection components, including household interviews, standardized physical examinations, and laboratory testing. For our study, we merged data from the 2001–2002 through 2009–2010 NHANES cycles and identified women who were postmenopausal at the time of their NHANES examination. Postmenopausal status was defined as self-reported absence of menstrual periods for at least 12 consecutive months or having had a bilateral oophorectomy/menopause-inducing surgery [11, 12]. We included participants aged 40 and above to capture the postmenopausal range, and excluded any women who were pregnant or still menstruating. We also excluded individuals with missing data on key variables (CRP, triglycerides, fasting glucose, or mortality follow-up information). The final analysis sample comprised 5,582 postmenopausal women (Figure 1).
Written informed consent was obtained from all participants, and the survey protocol received approval from the Research Ethics Review Board of the National Center for Health Statistics. This study, which relied on de-identified publicly available data, was granted an exemption from full review by the local Institutional Review Board. We followed STROBE guidelines for reporting observational studies [13, 14]. The study was conducted in accordance with the ethical standards of the Declaration of Helsinki.
Exposure: C-reactive protein-triglyceride-glucose index
Serum high-sensitivity CRP, FPG, and fasting TG were measured for each participant during the NHANES examination according to standardized protocols (details available from the Centers for Disease Control and Prevention NHANES laboratory procedures). Fasting measurements were obtained from morning examinees who fasted at least 8–12 hours. The C-reactive protein-triglyceride-glucose index was calculated for each individual as:
CTI = 0.412 × ln (CRP) + Ln/ln (TG [mg/dl] × FPG [mg/dl]/2) [2].
The constant 0.412 is a weighting factor for the inflammatory component (CRP) based on the index’s original development in prior research [15]. We treated CTI both as a continuous variable and in the categorical form for analysis. For categorical analyses, participants were divided into tertiles of CTI (tertile 1, tertile 2, tertile 3) based on the distribution in our study population. The middle tertile 2 served as the reference group in comparisons. In addition, we also conducted a restricted cubic spline modelling to evaluate the potential nonlinear association between CTI and mortality.
Outcomes: all-cause and cardiovascular disease mortality
The primary outcome was all-cause mortality, and the secondary outcome was cardiovascular mortality. Mortality status and cause of death were ascertained via probabilistic record linkage of NHANES participants with the National Death Index with follow-up extending through 31 December 2019. The duration of follow-up was determined from the baseline NHANES assessment until either the occurrence of death or 31 December 2019, whichever occurred earlier. Participants not found to be deceased by that date were censored as alive on 31 December 2019. The National Death Index provides underlying cause-of-death codes classified by ICD-10. We defined CVD mortality as any death with an underlying cause coded as cardiovascular disease, which included ischemic heart disease, heart failure, cerebrovascular events (e.g., stroke), and other atherosclerotic conditions (ICD-10 codes I00–I99). For the purpose of this study, all-cause mortality refers to death due to any cause.
Covariates
Based on a priori knowledge of factors associated with mortality in postmenopausal women, we included the following baseline covariates in our analyses: age (years, continuous), marital status (categorized as married/partnered/living with a partner vs. unmarried), poverty-income ratio (PIR) (a measure of socioeconomic status, continuous ratio of household income to the federal poverty threshold, with higher values indicating higher income) [2], smoking status (current, former, or never smoker), alcohol use (classified as non-drinker, former drinker, mild, moderate, or heavy drinker based on self-reported alcohol consumption; heavy drinking defined as > 1 drink/day on average for women), hypertension (yes/no, defined as a measured blood pressure ≥ 140/90 Hg mm, a self-reported previous physician diagnosis, or current use of antihypertensive medications), diabetes mellitus (yes/no, defined as FPG ≥ 126 mg/dl, haemoglobin A1c ≥ 6.5%, a self-reported prior diagnosis or current use of glucose- lowering medication), and body mass index (BMI) (kg/m2, continuous). These covariates were selected for adjustment because they represent key demographic, lifestyle, and clinical factors that could confound the association between CTI and mortality [2]. In NHANES, all covariate data was obtained via standardized questionnaires or measurements by trained personnel. Where necessary, we combined or simplified categories (e.g., marital status) to ensure adequate numbers of events in each subgroup. There was minimal missing data in the covariates; any missing values were handled using multiple imputation for consistency with complete-case analyses (the results were not materially different, so only complete-case results are presented).
Statistical analysis
The baseline characteristics of participants were summarized according to CTI tertiles. Continuous variables with an approximately normal distribution are presented as mean ± standard deviation, while skewed variables are reported as median (interquartile range). Categorical variables are expressed as percentages. Group differences for continuous variables were assessed by one-way ANOVA or Kruskal-Wallis tests, whereas χ2 tests were employed for categorical variables.
For time-to-event analyses, we used Cox proportional hazards models to evaluate the associations between CTI and both all-cause and CVD mortality. We verified the proportional hazards assumption by examining Schoenfeld residuals and time-interaction terms; no significant violations were observed. The primary analysis treated CTI as a continuous predictor. Given evidence of potential non-linear effects, we also performed a piecewise (threshold) analysis: we used an approach involving fitting a Cox proportional hazards model with an inflection point at a CTI value that best separated risk trends (determined via visual inspection of restricted cubic spline plots and model fit statistics). This approach identified CTI ≈ 4.16 as a candidate threshold. We therefore modelled CTI with separate linear terms for values below and above 4.16 to estimate the hazard ratios (HR) in each range. Additionally, we conducted categorical analysis by CTI tertiles to compare mortality risks in the lowest and highest tertiles relative to the middle tertile.
We built three Cox regression models:
Unadjusted;
Age, marital status; PIR; BMI, kg/m2-adjusted;
Fully adjusted for all covariates listed above (age, marital status, PIR, smoking, alcohol, hypertension, diabetes, BMI).
The primary results are presented from the fully adjusted models. Hazard ratios and their corresponding 95% CI were computed. Statistical significance was defined as a two-tailed p-value of less than 0.05.
To evaluate the robustness of the primary results, two sensitivity analyses were conducted. First, the analyses were rerun following the exclusion of individuals who died during the initial two years of the follow-up period, to address potential reverse causation bias (i.e., undiagnosed serious illness at baseline leading to both high CRP and early death). Second, participants who had a history of cancer at baseline were excluded, and we re-ran the models. We also stratified by presence of baseline conditions.
All statistical analyses were conducted using EmpowerStats software (X&Y Solutions, Inc., Boston, MA, USA), since our primary interest was in biological association and not national prevalence estimates, we present unweighted HR for interpretability (weighted analyses yielded similar conclusions).
Results
Baseline characteristics
A total of 5,582 postmenopausal women were included, with a mean age of 65.1 years (SD 11.2, range 40–85). The racial/ethnic composition was 74% White, 14% Black, 7% Hispanic, and 5% other. The mean baseline CRP was 4.6 mg/l (median 2.8, skewed right). The C-reactive protein-triglyceride-glucose index values ranged from approximately 2.5–6.5.
During a median follow-up of 141 months (approximately 11.8 years; interquartile range 115–168 months), a total of 1,846 participants died from all causes (cumulative incidence 33.07%). Among these, 582 women (10.43% of the cohort) died from cardiovascular causes. The remaining causes of death included cancer (approximately 22% of deaths), respiratory diseases, and other causes (Table 1).
Table 1
Baseline characteristics of the study population
Association of C-reactive protein-triglyceride-glucose index with all-cause mortality
Over a median observation period of 139.59 months, 1,846 deaths (33.07%) were recorded. Of those, 582 deaths (10.43%) were attributed to cardiovascular disease. Restricted cubic spline showed a non- linear dose-response relationship between CTI and all-cause mortality (Figure 2 A). In continuous unadjusted analysis, a one-unit higher CTI was correlated with a markedly increased risk of all-cause mortality (HR: 1.22, 95% CI:1.14, 1.31). These significant positive associations persisted after adjusting for demographics, sociodemographic, behavioural, and clinical confounders in the fully adjusted model (Table 2). When analysed by tertiles, compared to the second tertile (T2, reference), no statistically significant increase in risk was observed for the first tertile (T1) (HR 0.97, 95% CI: 0.86–1.10, p = 0.67). In contrast, the third tertile (T3) exhibited a 34% elevation in risk (HR 1.34, 95% CI: 1.19–1.51, p < 0.01). Segmented Cox regression analysis pinpointed an inflection point at 4.16. For CTI values below ~ 4.16 (approximately the median level in this cohort), there was no statistically significant association with all-cause mortality in fully adjusted models. The hazard ratio per 1-unit increase in CTI in this lower range was 0.87 (95% CI: 0.74–1.03, p = 0.10), indicating a possible trend toward lower risk with higher CTI in the low range, but this did not reach significance. In contrast, for CTI values above 4.16, a strong positive association emerged. Each 1-unit increase in CTI above the threshold was associated with an approximately 68% higher hazard of all-cause death (HR 1.68, 95% CI: 1.47–1.92, p < 0.01) (Table 3).
Figure 2
A) The association of C-reactive protein-triglyceride-glucose index with all-cause mortality. B) The association of C-reactive protein-triglyceride-glucose index with cardiovascular mortality
Adjusted for age (years), marital status, poverty income ratio, smoking status, alcohol use, hypertension, diabetes mellitus, body mass index (kg/m2). CTI – C-reactive protein-triglyceride-glucose index, RR – relative risk
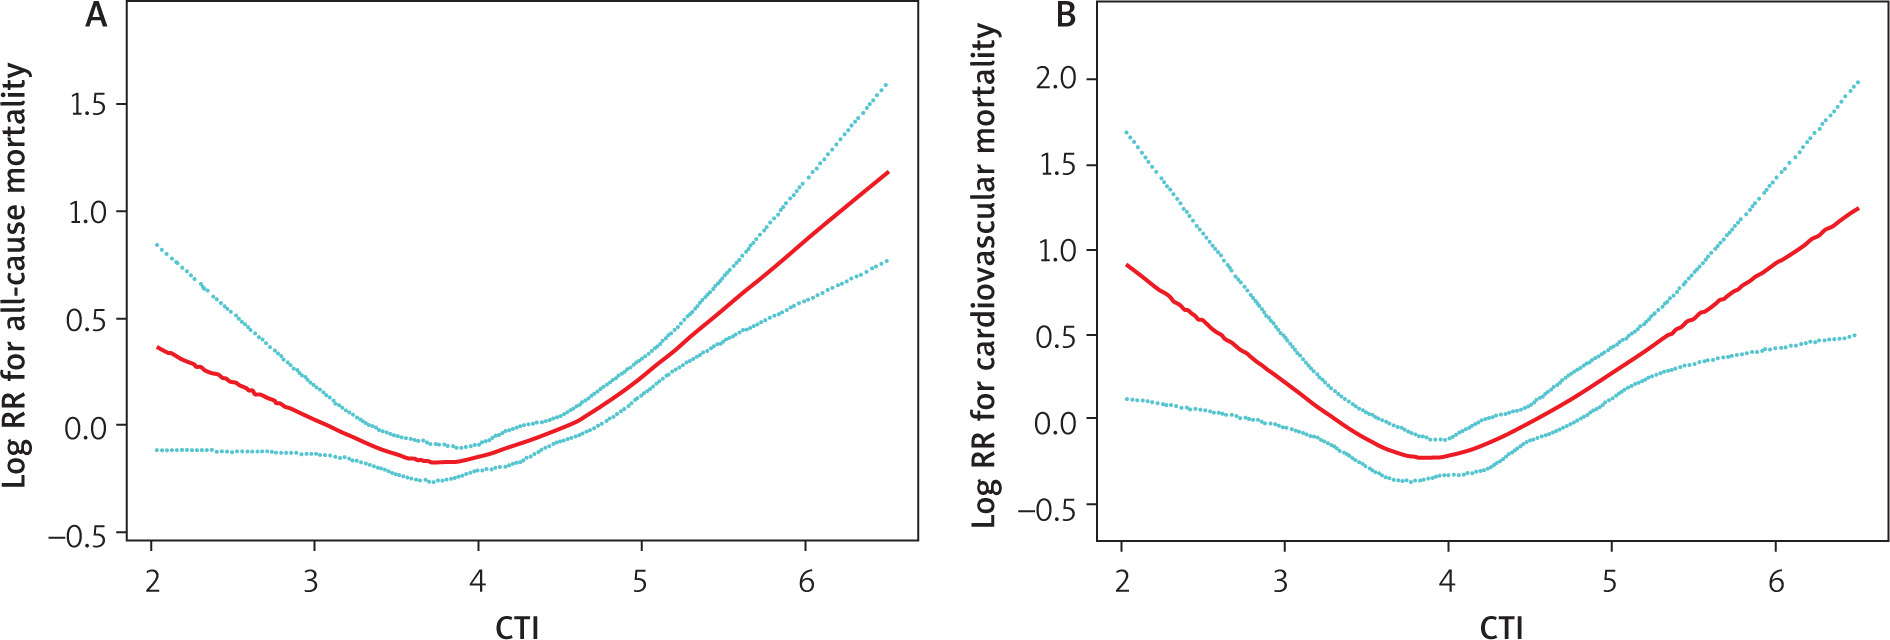
Table 2
The association between C-reactive protein-triglyceride-glucose index and all-cause and cardiovascular mortality
Table 3
Effect of C-reactive protein-triglyceride-glucose index level on all-cause and cardiovascular mortality
Association of C-reactive protein-triglyceride-glucose index with cardiovascular mortality
Associations between CTI and CVD-specific mortality were directionally similar to those for all-cause mortality. Restricted cubic spline showed a nonlinear relationship between CTI and cardiovascular mortality (Figure 2 B). In fully adjusted Cox models, each 1-unit higher CTI was associated with an HR of 1.26 (95% CI: 1.08, 1.47) for CVD mortality. In tertile analysis, compared to T2 (reference), T1 did not differ significantly (HR 0.99, 95% CI: 0.80–1.23, p = 0.94), whereas T3 was associated with a 43% increased risk (HR 1.43, 95% CI: 1.16–1.76, p < 0.01) (Table 2). Segmented Cox regression analysis pinpointed an inflection point at 3.78. Below CTI 3.78, the adjusted HR for CVD death per unit CTI was 0.47 (95% CI: 0.31, 0.71; p = 0.01), whereas above CTI 3.78, the HR per unit was 1.67 (95% CI: 1.38–2.02; p < 0.01) (Table 3).
Subgroup analysis
Subgroup analyses indicated that the correlation between higher CTI levels and elevated mortality risk remained evident across most demographic and clinical subgroups, underscoring the stability of this association. While the strength of the association varied in certain subgroups, such as being notably stronger in younger individuals and current smokers, the direction of the effect remained stable across the majority of populations examined (Table S1).
Survival curve analysis
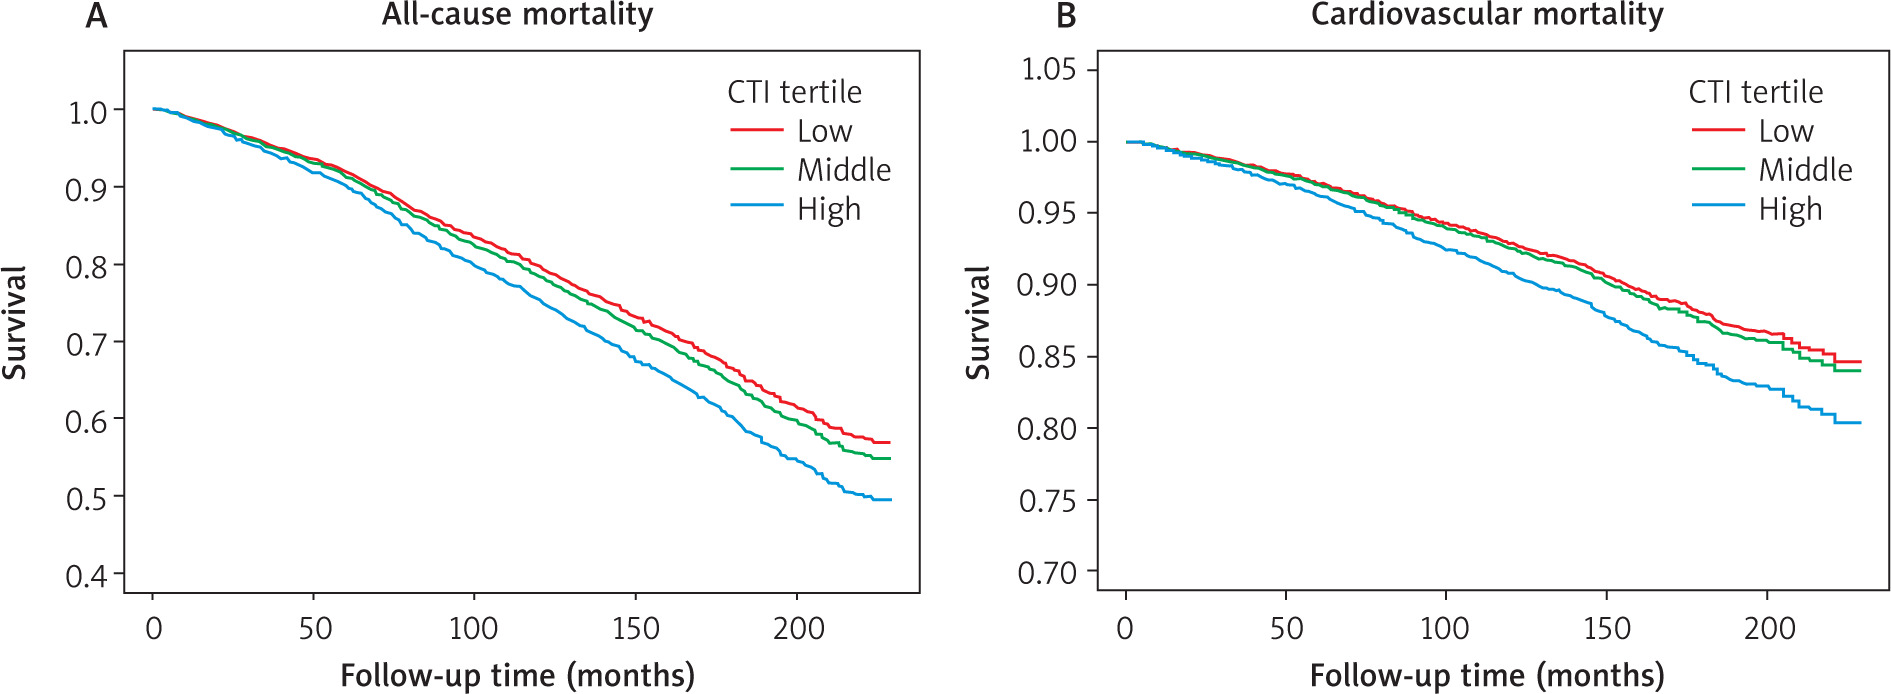
The Kaplan-Meier curves demonstrate a dose- response relationship between CTI levels and mortality. For both all-cause and cardiovascular death, the survival probability of the high CTI group was reduced. The curves diverged early and continued to separate over time, indicating a sustained increase in mortality risk associated with elevated CTI (Figure 3).
Sensitivity analyses
A sensitivity analysis was conducted after excluding 109 participants who died within the first two years following baseline. The findings remained robust and aligned with those of the primary analysis, as the HR comparing the highest versus the middle CTI tertile remained nearly unchanged.
Discussion
In this large, prospective investigation of postmenopausal women in the United States, higher levels of the CTI were independently linked to an elevated risk of both all-cause and cardiovascular mortality throughout a follow-up period of 18 years. These associations remained significant after comprehensive adjustment for demographic, lifestyle, socioeconomic, and clinical risk factors. To our knowledge, this is the first study focusing on CTI and mortality specifically in a postmenopausal female population.
These results extend and complement prior research on CTI in other populations. The C-reactive protein- triglyceride-glucose index was initially developed in the context of oncology: Ruan et al. [15] formulated CTI to predict survival in cancer patients and demonstrated that higher CTI portended worse prognosis. That work and subsequent studies have shown CTI to be a robust indicator of systemic inflammatory and metabolic stress that correlates with outcomes in various diseases [6, 8, 10]. Recently, Sun et al. [9] examined CTI in a general adult NHANES sample (including both men and women across a broad age range) and reported that individuals in the highest CTI quartile exhibited over two-fold higher all-cause mortality hazard/risk relative to those in the lowest quartile. Our study adds to this growing body of evidence by linking CTI between all-cause and cardiovascular mortality among an aging female population.
Several interconnected biological mechanisms underpin the association between elevated CTI and increased mortality. As a composite index, the CTI captures the synergistic detriment of two key pathways: systemic inflammation and insulin resistance. First, inflammation (captured by CRP in CTI) plays a causal role in atherosclerotic plaque formation and instability [16]. Elevated CRP indicates an active inflammatory milieu that can promote endothelial dysfunction [17], plaque rupture, and thrombosis [18], leading to fatal events like myocardial infarction or stroke. In postmenopausal women, systemic inflammation tends to rise due to increased adiposity and loss of oestrogen’s anti-inflammatory effects [19]. Second, the TyG component of CTI reflects IR [20, 21], which contributes to hyperglycaemia, high triglyceride levels, and low high-density lipoprotein cholesterol – a constellation that defines metabolic syndrome. Insulin resistance and its downstream effects accelerate CVD [22, 23] and also have been linked to certain cancers [24, 25] and even frailty [26–28]. Insulin resistance and chronic inflammation compromise endothelial integrity, diminish nitric oxide bioavailability, disrupt normal coagulation processes, and accelerate the development of atherosclerosis. Critically, IR and chronic inflammation engage in a vicious cycle; they collectively impair endothelial integrity, reduce nitric oxide bioavailability, and disrupt coagulation, thereby markedly accelerating CVD and related mortality [29, 30]. In postmenopausal women, the loss of oestrogen’s protective effects exacerbates both inflammation and IR [19], creating a physiological milieu where this inflammation-metabolic axis is particularly potent. While our findings highlight the clinical relevance of this axis, the precise molecular pathways warrant further elucidation.
Our findings have potential clinical implications. C-reactive protein-triglyceride-glucose index could be used as an easily calculable risk marker in primary care or cardiometabolic clinics, especially for postmenopausal women. The inputs (CRP, triglycerides, glucose) are often available from routine blood tests. A patient’s CTI can be computed and if found to be high, it may warrant aggressive management of risk factors.
Strengths of our study include the large, nationally representative cohort of older women with long-term follow-up and objectively verified outcomes. The relatively high number of events (over 1,800 deaths) gave us ample power to detect associations and explore non-linear effects. We used a rigorous approach to identify a threshold and confirmed the consistency of results with different modelling strategies. Other strengths include the use of objectively measured laboratory data rather than self-reported values, and the nearly complete mortality follow-up via linkage to the National Death Index. Additionally, this is one of the first studies to specifically highlight the utility of CTI in a general female population after menopause, thereby filling a gap in the literature.
Despite its strengths, our study has several limitations. First, the observational design precludes a definitive causal inference. It is possible that high CTI is a marker of underlying illness or unmeasured factors that truly drive mortality, rather than a direct cause. We mitigated confounding by adjusting for many covariates and performing sensitivity analyses, but residual confounding (e.g., by diet quality, physical activity, or access to healthcare) might still be present. Second, CTI was measured at a single time point (baseline). We could not account for changes in CRP, TG, or glucose over time; some women may have improved or worsened their metabolic-inflammatory status during follow-up, which could attenuate the associations if there is regression to the mean. Future studies with repeated measurements could examine how changes in CTI relate to outcomes. Third, our definition of postmenopausal was based on self-report and age, which may misclassify a small number of perimenopausal women as postmenopausal. However, given the age distribution (mean 65) the vast majority were truly postmenopausal. Finally, we lacked detailed data on diet quality, which is a known determinant of both metabolic-inflammation and long-term health outcomes. Future studies incorporating comprehensive dietary assessments are warranted to elucidate its role in the observed associations.
Future prospective trials and intervention studies are warranted to determine whether targeting and lowering CTI through lifestyle or pharmacological interventions can effectively reduce mortality risk in postmenopausal women [31].