
Introduction
Menopause marks the end of the female reproductive period and is a very important period for women [1]. Premature menopause occurs when ovaries no longer ovulate, and menstruation stops before the age of 40. If women experience such a condition before age 45, this is defined as early menopause [2]. In the past 60 years, women’s natural menopausal age has been increasing worldwide; over that period mean menopausal age has increased by 1.5 years, reaching 51–52 years [3, 4]. However, no downward trend in premature and early menopause among women in the United States has been observed [5]. Approximately 10% of women have early menopause before the age of 45, and premature menopause affects 1% of women before age 40. Premature/early menopause as an irreversible event could lead to some adverse consequences for women’s subsequent health, including increased risks of premature death, osteoporosis, cardiovascular disease, and mental disorders [6, 7].
The impact of changes in the endogenous hormone environment caused by menopause on the risk of type 2 diabetes mellitus (T2DM) in postmenopausal women is controversial [8–11]. A recent meta-analysis demonstrated that compared to women going through menopause over 45 years, premature menopause and early menopause had an increased risk of T2DM (odds ratio [OR]: 1.15, 95% confidence interval [CI]: 1.04–1.26; OR: 1.50, 95% CI: 1.03–2.19, respectively) [12]. Shen et al. found increased odds of 1.20 (95% CI: 1.03–1.39) for T2DM among women with early menopause compared to postmenopausal women with normal menopause age [1]. The T2DM risk in women with later menopause (> 52 years) was unclear (OR: 1.12, 95% CI: 0.99–1.28). The meta-analysis from Guo et al. on the dose-response relationship between age at menopause and T2DM indicated that there was a negative linear correlation between age at menopause and T2DM, and every 5-year increase in age at menopause could reduce the T2DM risk by 10% (RR = 0.90, 95% CI: 0.84–0.98) [13]. In contrast, some studies found no significant association between age at menopause and T2DM risk [14, 15].
The pathogenesis of premature and early menopause for T2DM risk is unclear. One possible mechanism is shorter exposure to endogenous estrogen, which may potentially have a protective role in pancreatic β-cell function. Estradiol could regulate the biosynthesis and secretion of insulin and the survival of β-cells by binding to receptor α in β-cells and phosphorylation of extracellular signal-regulated kinase [16]. Another possible mechanism is that estrogen deficiency leads to redistribution of body fat, which leads to an increase in central fat and induces an increase in insulin resistance [17]. Serum testosterone and sex hormone binding globulin (SHBG) concentrations change after menopause, and low concentrations of SHBG are related to central obesity and insulin resistance [18].
This analysis used cross-sectional observational data from the large-scale representative National Health and Nutrition Examination Survey (NHANES) to examine the association between age at menopause and T2DM in postmenopausal women. We hypothesized that women with earlier than expected menopause would have an increased risk for T2DM.
Material and methods
Data source and study populations
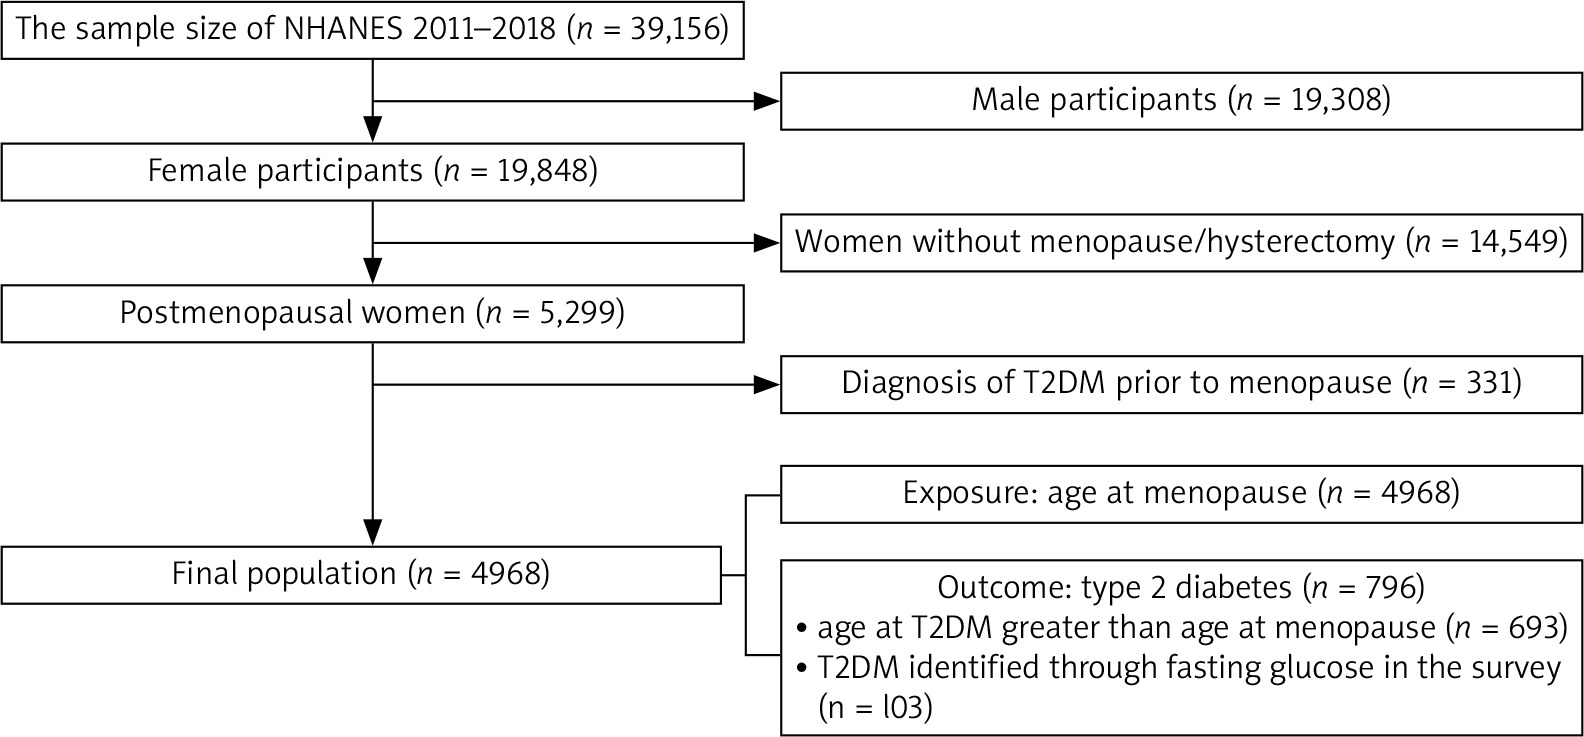
The data for this analysis were from the 2011–2018 NHANES, a cross-sectional probability survey of Centers for Diseases Control and Prevention for US residents aged 0–85. The study design, data collection, analysis, and manuscript drafting were conducted in strict compliance with the Declaration of Helsinki and guidelines on Enhancing the Quality and Transparency of Health Research (https://www.equator-network.org/), etc. The Centers for Diseases Control and Prevention’s National Center for Health Statistics Ethics Review Board approved NHANES data collection from the participants. Our study included women who self-reported menstrual cessation for more than 12 months. The inclusion criteria included having gone through menopause or hysterectomy. To begin with, we filtered the 2011–2018 NHANES datasets (n = 39,156) through the limitation of sex and menstrual cessation of menopause and hysterectomy. There were 5,299 postmenopausal women in the dataset. Additionally, we excluded 331 women who had developed T2DM before menopause. Thus, a total of 4,968 postmenopausal women were included in the study (Fig. 1).
Dependent and independent variables
The outcome of this study was having T2DM following menopause. We used questionnaire and laboratory data to determine the diabetes status of the study subjects. By the questions “Have you ever been told you have diabetes by a doctor?” and “are you taking antidiabetic medication/insulin?” we determined the diabetic status of participants. Additionally, data on age at diabetes onset were available in the NHANES database. In this study design, we only included the outcome of T2DM after stopping menstrual cycles, excluding those women in which T2DM occurred prior to stopping menstrual cycles. Based on the guidelines of the American Diabetes Association, we also identified participants as having T2DM if their fasting blood glucose were greater than or equal to 126 mg/dl [19]. Of note, due to changes in instruments to test fasting glucose before and after 2015 in NHANES, fasting blood glucose values in 2015–2018 were adjusted (0.9776 × the original glucose value + 0.4994) so that the pooled fasting glucose results were compatible [20]. We identified 103 T2DM participants by their fasting glucose level. Finally, there were 796 participants who had T2DM after menopause. The exposure variable, age at menopause, was categorized as less than 40 years, 40–44 years, 45–54 years, and 55 years or older [12].
Potential confounding variables
Control variables in this study included age, race/ethnicity, marital status, education, income, alcohol consumption, smoking, body mass index (BMI), hypertension, high cholesterol, family history of diabetes, gestational diabetes, ever taking female hormones, ever taking birth control pills, hysterectomy, and oophorectomy. The racial classification was non-Hispanic white, non-Hispanic black, Hispanic and others. Education level included high school or below and college/university or above. We divided marital status into married/living with partner, widowed/divorced/separated, and never married. Smoking was based on the question: “Have you smoked at least 100 cigarettes in your life?” Drinking was based on the response to the question “Have you had at least 12 alcohol drinks/1 year?” BMI as a continuous variable was the quotient of weight (kg) divided by height (square meters). Hypertension and high cholesterol came from self-reports by the survey participants. Physical activity was quantified by metabolic equivalent scores. The metabolic equivalent score was the sum of the minutes of vigorous work-related/leisure-time activity and moderate vigorous work- related/leisure-time activity per hour each week [21]. The family history of diabetes, gestational diabetes, taking female hormones, and taking birth control pills were all based on positive answers to the corresponding questions in the interview questionnaire.
Statistical analysis
The National Health and Nutrition Examination Survey analysis guideline was the major reference tool for merging data from 2011–2018, applying sampling weights, strata, and clusters [22]. We performed univariate analysis for descriptive statistics, producing unweighted and weighted frequency and proportions (%). The comparison of the weighted proportions among different groups was conducted by the Rao-Scott χ2 test. We applied t-tests to compare the mean values of continuous variables between two groups. Metabolic equivalent scores-physical activity was standardized since its standard deviation was very large.
For multivariable analysis, as NHANES was a complex multi-stage sampling design, we performed logistic regression model analysis accounting for stratification, cluster, and sampling weight for the unadjusted and adjusted OR value between age at menopause and T2DM. Model 1 was unadjusted, and model 2 was the full model including all the variables in Table 1. We chose the potential covariates by backward selection (significant association at p < 0.15). Model 3 consisted of significant covariates, omitting those non-significant covariates. We assessed possible effect modifications of the relationship between age at menopause and T2DM for the following covariates: age, race, education, BMI, smoking, hypertension, high cholesterol, physical activity, and family history of diabetes. However, the interaction effects of age at menopause and the above potential covariates on T2DM were not significant. Thus, model 3 was the final model.
Table 1
Characteristics of postmenopausal women according to type 2 diabetes mellitus in National Health and Nutrition Examination Survey 2011–2018
We entered age at menopause as a continuous independent variable into the logistic models to estimate the unadjusted and adjusted ORs of T2DM for each year delay in age at menopause. We also performed the linear regression model for age at T2DM with age at menopause to quantify the relation. All statistical analysis was performed using SAS version 9.4 (SAS Institute Inc., Cary, NC). A two-tailed p-value of less than 0.05 was considered to indicate statistical significance.
Results
Basic characteristics of the study population
The mean age of the 4,968 postmenopausal women was 62.1 years, with a range of 13–80 years. Their mean age at menopause was 44.2 years, with a range of 12–65 years. The proportions of T2DM were significantly different according to race, marital status, education, income, physical activity, BMI, alcohol drinks, family history of diabetes, hypertension, high cholesterol, gestational diabetes, hysterectomy, oophorectomy, and age at menopause. Smoking and taking female hormones were not significantly different among the different groups. Among these postmenopausal women, 26.1% of women experienced premature menopause before age 40 and 15.4% had early menopause between 40–44 years. There was a statistically significant difference in the mean age at menopause between women with and without T2DM (Table 1).
Comparison of type 2 diabetes mellitus prevalence by age at menopause
Table 2 shows that the overall adjusted prevalence of T2DM among menopausal women was 11.8% in the United States. Age at menopause under 40 years had the highest (15.0%) adjusted prevalence of T2DM, followed by age at menopause of 40–44 years (13.0%), and the lowest prevalence (9.8%) in women entering menopause at ages of 44–54 years.
Table 2
Type 2 diabetes mellitus prevalence by age at menopause for postmenopausal women in United States, National Health and Nutrition Examination Survey 2011–2018
Association of age at menopause and type 2 diabetes mellitus
Table 3 provides the unadjusted and adjusted ORs for the association between age at menopause and T2DM among postmenopausal women. After adjusting for the confounding variables of age, race, education, smoking, BMI, physical activity, family history of diabetes, hypertension, high cholesterol, and gestational diabetes, the adjusted ORs of T2DM with menopause age of < 40 years, 40–44 years and ≥ 55 years were 1.97 (95% CI: 1.47–2.63), 1.27 (95% CI: 0.90–1.79) and 0.98 (95% CI: 0.66–1.45), respectively, with the reference group of menopausal age of 45–54 years. Adjusting for the same covariates, each increase by 1 year in age at menopause was associated with a 3% reduction in the prevalence of T2DM (95% CI: 2–5).
Table 3
Unadjusted and adjusted odds ratios for the association between age at menopause and type 2 diabetes mellitus among postmenopausal women in United States, National Health and Nutrition Examination Survey 2011–2018
Age at menopause and age at type 2 diabetes mellitus
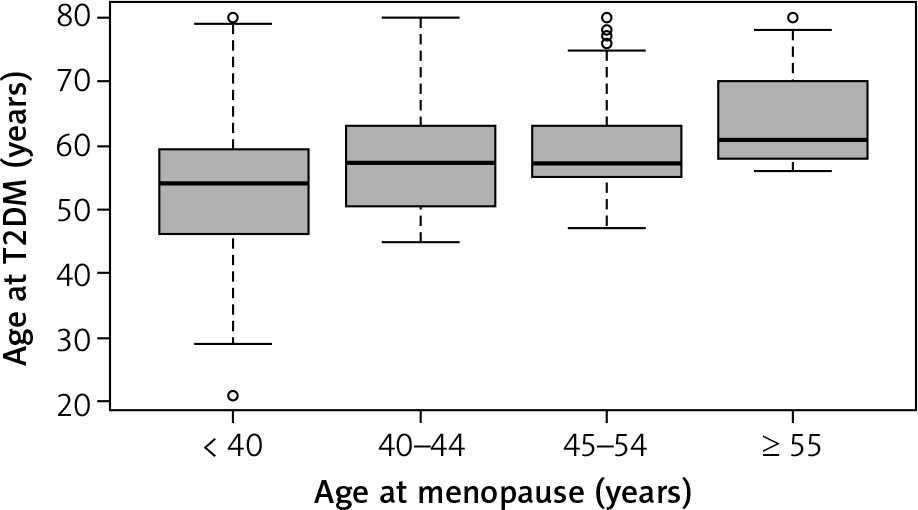
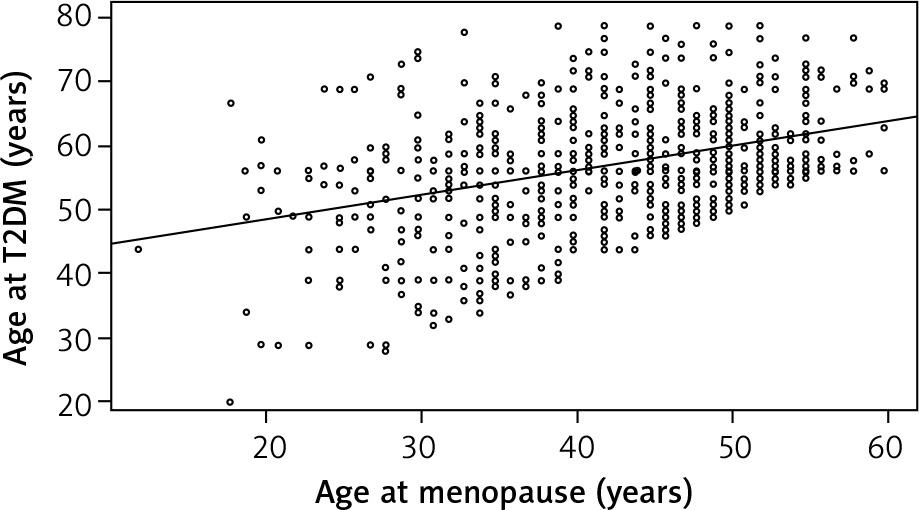
Among 4,968 participants, 796 women developed T2DM after menopause cessation. The overall mean age at T2DM was 57.2 years. The mean age at menopause was 42.9 years in T2DM women. The mean age at diabetes for age at menopause of < 40, 40–44, 45–54 and ≥ 55 years was 52.8, 57.5, 59.0 and 63.9 years, respectively (F = 42.4, DF = 3, p < 0.0001) (Fig. 2). The correlation coefficient between age at diabetes and age at menopause is 0.38 (p < 0.0001). Figure 3 visualizes the linear trend of age at diabetes with age at menopause. Among women with later age at menopause, T2DM developed at a later age. The unadjusted linear regression model demonstrated that each 1-year increase in age at menopause could delay age at T2DM by 0.38 years. After controlling for the covariates of race, marital status, education, income, smoking, family history of diabetes, BMI, physical activity, hypertension, high cholesterol, and gestational diabetes, the adjusted model indicated that each 1-year increase in age at menopause might lead to a decrease in age at T2DM of 0.39 years (Fig. 3).
Discussion
We found that the weighted proportion of premature menopause (< 40 years) was more than a quarter among postmenopausal women in the United States. The weighted prevalence of T2DM was the highest in women with premature menopause (Table 2). Age at menopause before 40 was significantly associated with T2DM (Table 3). Furthermore, age at menopause was significantly correlated with age at T2DM. The younger the age at menopause, the younger was the age at T2DM diabetes (Fig. 3).
More than one in four postmenopausal women had menopause before age 40. In the United States as a whole, we estimated that approximately 14 million women suffered from premature menopause. The total mean age at menopause was 44.2 years old. Stratified by with and without hysterectomy, the corresponding mean ages at menopause were 40.2 and 47.0 years old. An earlier study using NHANES from 1999 to 2010 indicated that the mean age at natural menopause was 49 years, and the mean age at hysterectomy was 38 years [23]. Zhang et al. reported that the mean age at natural menopause was 48.8 years in Chinese women [24].
The weighted prevalence of T2DM was the highest among women with premature menopause, being the lowest in women having menopause at the age of 45–54 years. Many studies focusing on this topic did not show weighted prevalence of T2DM [1, 7, 14, 24]. The unweighted and weighted T2DM prevalence in our study was 16.0% and 11.8% in the postmenopausal women, respectively. A study from China indicated that the T2DM prevalence was 17.0% in 16,299 postmenopausal women [1]. Zhang et al. reported that the prevalence of T2DM among 15,406 postmenopausal women was 12.7% [24].
After adjusting for the confounders, women undergoing menopause before 40 years had 1.97 times the risk of developing T2DM compared to women having menopause between 45 and 54 years. The risk for women with early menopause (40–44 years) and later menopause (over 55 years) was not statistically significantly higher than in the reference group. A meta-analysis of age at menopause and T2DM showed that among 13 studies, only 5 found that early menopause was related to the risk of T2DM [12]. Most current studies on this topic had different cut point groups and reference group of age at menopause, leading to inconsistent research results. A cohort study from the Netherlands indicated that with age at menopause greater than 55 years as the reference group, the adjusted HRs for T2DM for < 40 years, 40–44 years, and 45–55 years were 3.7 (95% CI: 1.8–7.5), 2.4 (95% CI: 1.3–4.3) and 1.60 (95% CI: 1.0–2.8) [25]. Another retrospective cohort study of 22,426 women from Japan showed no significant association between early menopause (< 45 years) and T2DM compared to age at menopause of 45–53 years in the adjusted model [14].
Additionally, our results showed that for every 1-year delay in age at menopause, the risk of T2DM decreases by 3%. The result was similar to other relevant studies. For example, Shen et al. reported that for every 1-year delay in menopause age, the incidence of diabetes decreases by 2% (RR: 0.98, 95% CI: 0.97–0.99) [1]. Muka et al. found that the incidence of T2DM decreased by 4% for each year delay in menopause age (HR: 0.96, 95% CI: 0.94–0.98) [7]. Other studies also provided evidence that as age at menopause increased, the risk of T2DM might decrease [26, 27].
The correlation coefficient between age at T2DM and age at menopause was 0.38. According to Cohen’s effect size, a correlation coefficient of 0.30 can be considered to indicate a correlation of medium strength [28]. Women with premature menopause were the youngest (mean age of 52.8 years) to suffer from T2DM, and women with age of menopause of over 55 years had T2DM at the oldest age (mean age of 63.9 years). Premature menopause may advance the age of the onset of T2DM by 6 years compared to women with menopause age of 45–54 years, by 11 years in contrast with women with menopause age over 55 years. Moreover, the linear relationship between age at diabetes and age at menopause demonstrated that for every 1-year increase in age at menopause, the age at T2DM might be delayed by 0.39 years. We found little literature on the relationship between age at menopause and age at T2DM. The research conducted by Jacobs et al. showed that the mean age at T2DM in women was 63.4 years, and 50% of women were diagnosed with T2DM in the age range of 54–76 years [29].
The main strength of this study was the use of the nationally representative NHANES sample 2011–2018, involving many women with premature menopause. Moreover, since the outcome variable was based on the manipulation where age at T2DM was greater than age at menopause, it could offset the shortcomings of cross-sectional data regarding causal identification to a certain extent. Furthermore, we determined the value of the dependent variable based on the combination results of the questionnaire and fasting blood glucose, so the value of the outcome variable should be accurate. Since the NHANES survey included the variable of age at diabetes, it allowed us to explore the link between age at menopause and age at T2DM. Regarding the limitations of this study, the value of the independent variable and most control variables were derived from the questionnaire data, and there would inevitably be recall bias [30]. Some participants could not accurately remember their age at menopause/diabetes. Due to the data from the cross-sectional survey, the covariates such as hypertension and high cholesterol could only represent the characteristics when participants joined in the survey, not being the characteristics before the onset of T2DM.
Conclusions
Women undergoing menopause before the age of 40 had a significantly increased risk of T2DM. The risk of T2DM tended to decrease with increasing age at menopause. Each increase by 1 year in age at menopause was associated with a 3% reduction in the prevalence of T2DM. The younger the age at menopause, the younger was the age when T2DM may develop. For women with premature menopause, the age of 57 years may be a dangerous period for the onset of T2DM. More cohort studies are warranted to further confirm the findings.