
Introduction
Non-alcoholic fatty liver disease (NAFLD) is the most common chronic liver disease worldwide, and its prevalence is increasing year by year, affecting nearly 38% of the global population [1, 2]. It is mainly due to the accumulation of fat in the liver rather than other specific causes such as alcohol, drugs, and viruses [3]. NAFLD ranges from simple steatosis and hepatitis to liver fibrosis and cirrhosis and eventually to hepatocellular carcinoma [4, 5]. In recent years, a significant consensus has emerged in the global hepatology community regarding the nomenclature of NAFLD. An international academic consortium comprising experts from 22 countries, through a rigorous Delphi consensus process, has proposed renaming NAFLD to “metabolic dysfunction-associated steatotic liver disease (MASLD)”, with steatotic liver disease (SLD) being recommended as an umbrella term [6, 7]. Epidemiologic studies reveal MASLD as the most prevalent chronic liver disorder worldwide, affecting approximately 25% of adults, with disease progression potentially leading to severe hepatic fibrosis, cirrhosis, and ultimately end-stage liver failure. The updated nomenclature not only addresses the exclusionary limitations and stigmatizing connotations of the original “non-alcoholic” designation but also establishes an objective diagnostic framework centered on metabolic dysregulation.
Although the etiology of MASLD has been comprehensively studied in recent years, thyroid function remains one of the most important factors regulating hepatic lipid metabolism. Epidemiological data suggest that the prevalence of MASLD in patients with hypothyroidism and hyperthyroidism is in the range of 35.7-36.3% and 11.95-21.5%, respectively [8–10]. Thyroid hormones play an essential physiological role in lipid metabolism, such as lowering cholesterol and triglyceride [11, 12]. Similarly, the liver is critical for thyroid hormone regulation. Dysregulation of thyroid hormone is associated with a range of liver diseases, such as MASLD [13] and liver cancer [14]. Previous studies have shown that hypothyroidism, including reduced levels of thyroxine (T4) and elevated levels of thyroid stimulating hormone (TSH), is associated with an increased risk of MASLD [14–16]. In addition, serum levels of free thyroxine (FT4) and free triiodothyronine (FT3) were significantly negatively associated with the risk of MASLD [17]. However, it is essential to note that the effect of thyroid function on MASLD and long-term prognosis has been controversial. Results of a meta-analysis showed no significant association between MASLD and subclinical, dominant, or global hypothyroidism [18]. Another study of 1675 older adults suggested that elevated FT3 and reduced TSH were independently associated with a higher incidence of MASLD [19]. However, this difference may be attributed to limitations of observational studies, such as reverse causality.
In recent years, thyroid function has been associated with an increased risk of cardiovascular death. The findings highlight the impact of TSH on long-term prognosis, even if thyroid function is within the normal range [20]. Another study in Norway found an association between high TSH levels and cardiovascular mortality [21]. However, the association is inconsistent [22]. This may be due to the presence of appropriate acquired resistance to thyroid hormone in people with normal thyroid function in MASLD. Therefore, a series of indicators to assess thyroid hormone sensitivity are used in the clinic, including the Thyrotroph T4 Resistance Index (TT4RI), the thyrotropin resistance index (Thyroid-Stimulating Hormone Index – TSHI), and the Thyroid Feedback Quantile-based Index (TFQI) [23]. Impaired thyroid sensitivity is a risk factor for hypertension, diabetes, and cardiovascular diseases [24, 25] and is also associated with impaired thyroid sensitivity and metabolic disorders [26]. Nevertheless, the association of thyroid hormone sensitivity with long-term mortality in euthyroid people with MASLD remains unclear.
To fill these evidence gaps, this study explored the association between thyroid function and thyroid hormone sensitivity and all-cause death and cardiovascular death in a nationally representative sample of U.S. adults with normal thyroid function in the MASLD population.
Material and methods
This study’s data are from the National Health and Nutrition Examination Survey (NHANES), a stratified, complex multistage sampling survey conducted by the Centers for Disease Control and Prevention (CDC) to ensure that the sample is representative of the US deinstitutionalized civilian population, designed to assess the health and nutritional status of US adults and children. All data are available from the NHANES website (https://wwwn.cdc.gov/nchs/nhanes/Default.aspx). The NHANES study protocol was approved by the National Center for Health Statistics Research Ethics Review Committee, which ensured that all participants signed written informed consent.
Study population
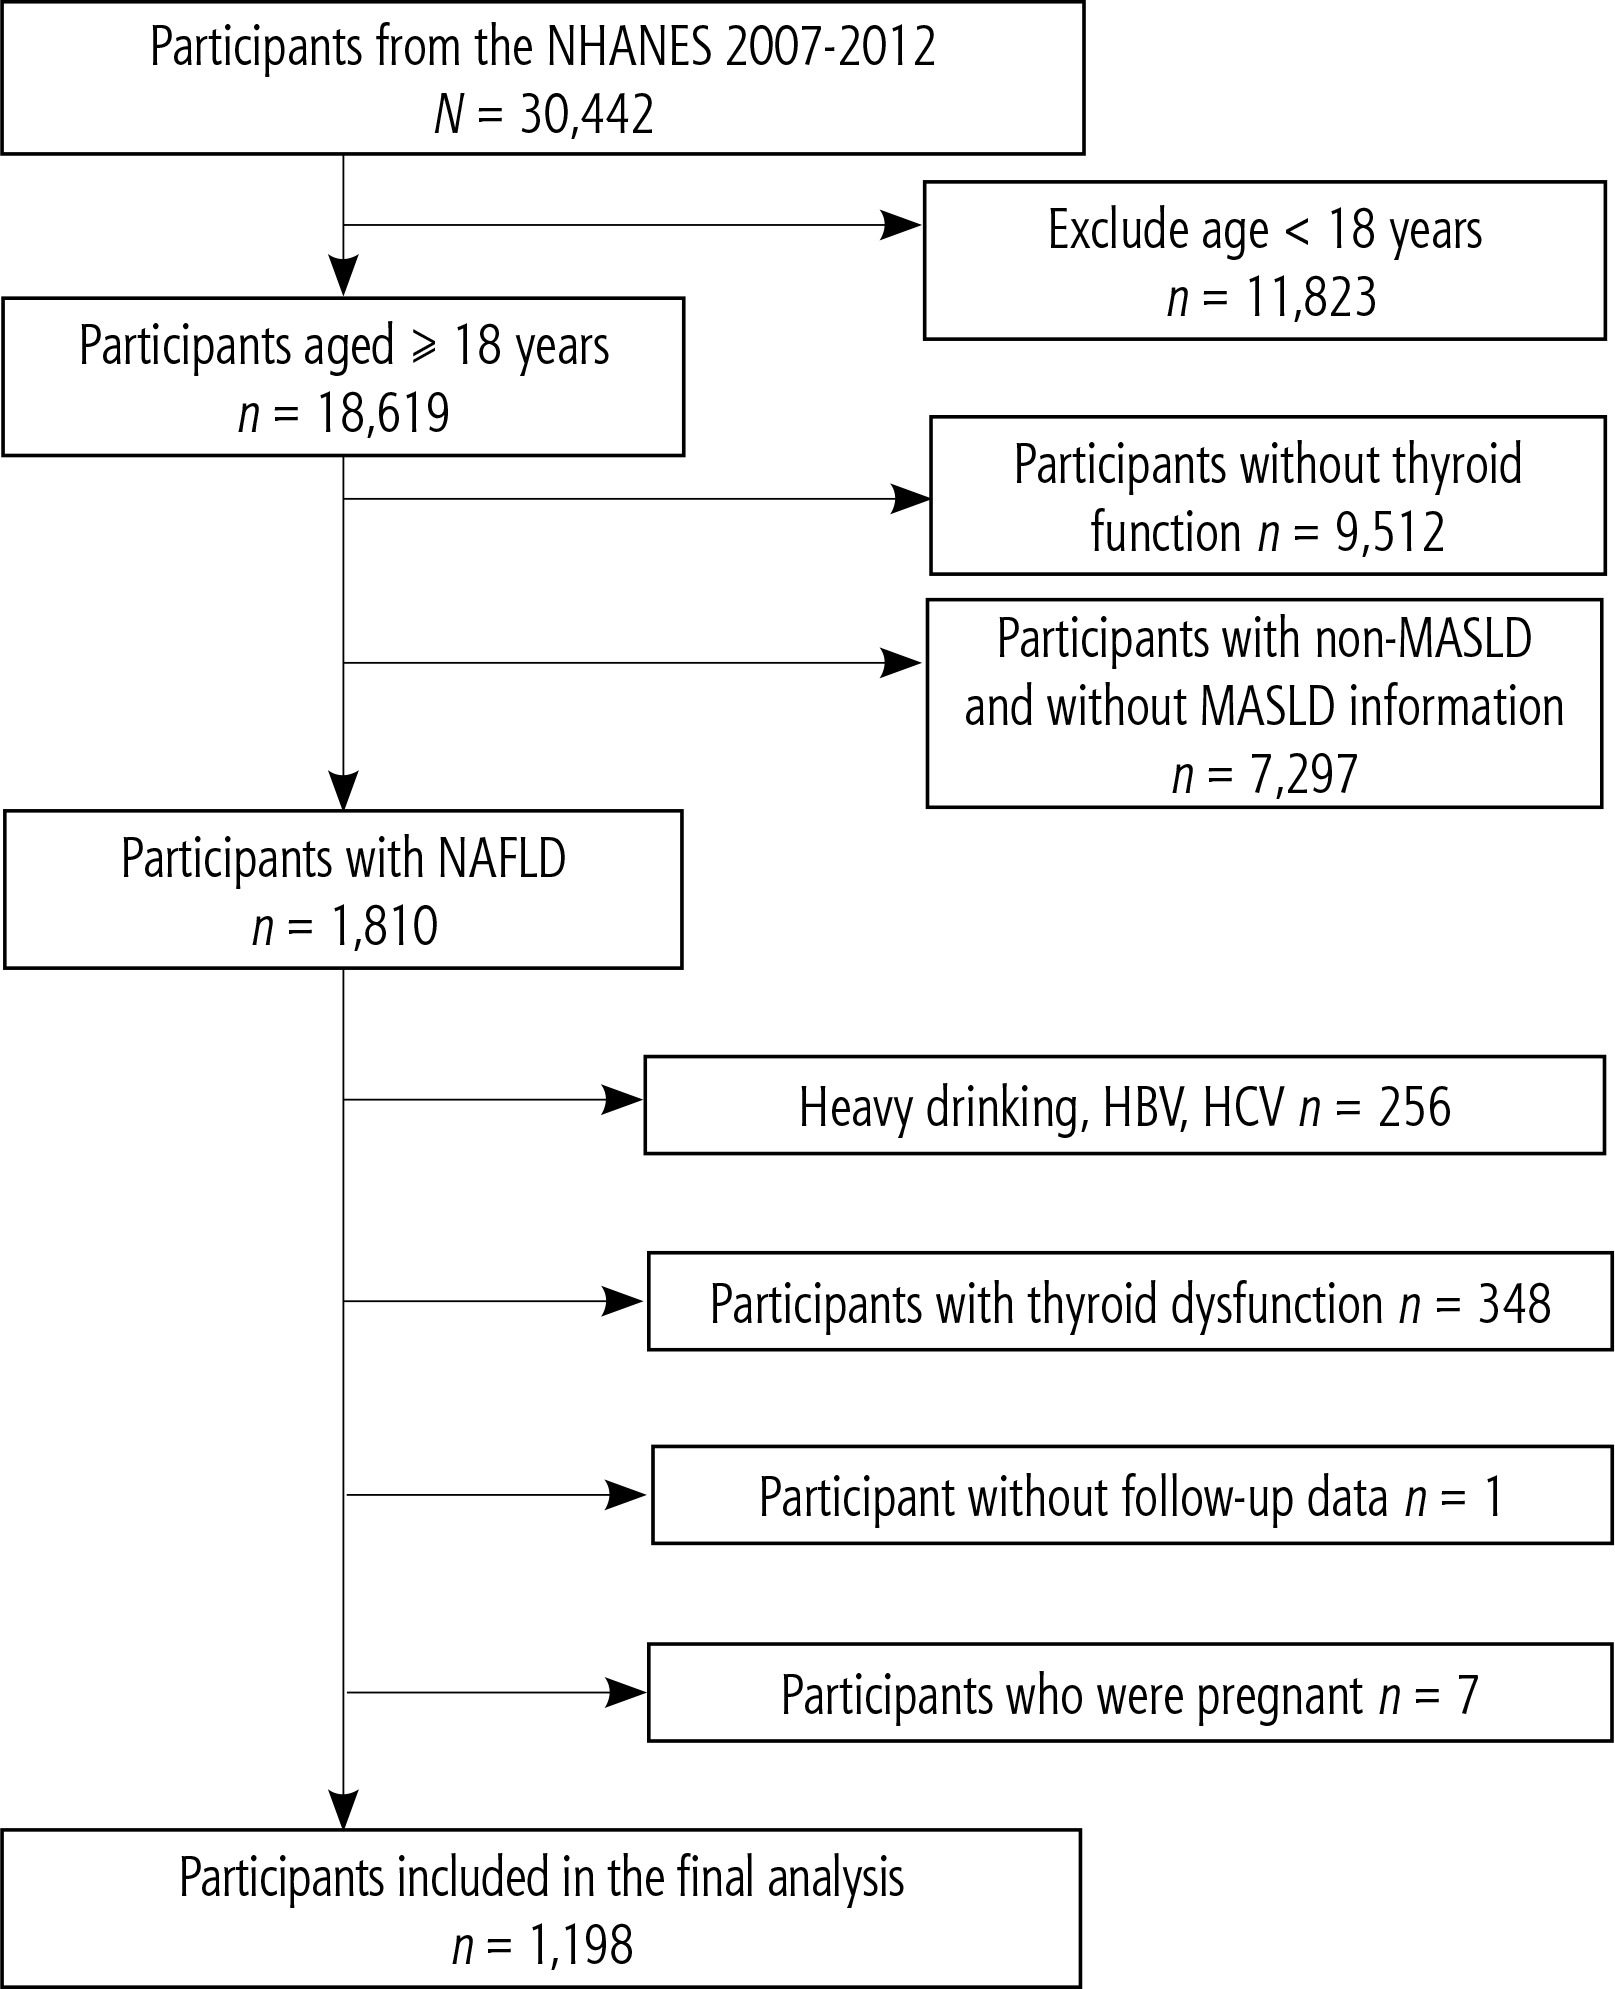
We used data from three NHANES cycles from 2007 to 2012 (2007-2008, 2009-2010, 2011-2012), enrolling 30,442 participants (Fig. 1). The study excluded participants who were younger than 18 years at baseline (n = 11,823), participants with incomplete information on thyroid function (n = 9,512), participants without MASLD or with missing MASLD information (n = 7,297), participants with heavy alcohol consumption (≥ 14 g/day for women and ≥ 28 g/day for men), participants with hepatitis B virus or hepatitis C virus (n = 256), participants with abnormal thyroid function (n = 348), and participants with missing data on death status (n = 1) and pregnancy status (n = 7). A total of 1198 participants were included in the study.
Definition of MASLD
FibroScan is a relatively standard method for assessing hepatic steatosis and liver fibrosis. However, data prior to 2017 in NHANES lack FibroScan measurements. Therefore, this study employed the widely applicable fatty liver index (FLI) to assess SLD, with a FLI score of ≥ 60 for SLD [27]. FLI is a comprehensive scoring system that assesses waist circumference (WC), γ-glutamyltransferase (GGT) levels, triglyceride levels, and body mass index for the identification of steatohepatitis. FLI is calculated by the following formula: FLI = [(e0.953*loge (triglycerides) + 0.139*BMI + 0.718*loge (GGT) + 0.053*WC – 15.745)/(1 + e0.953*loge (triglycerides) + 0.139*BMI + 0.718*loge (GGT) + 0.053*WC – 15.745) × 100.
MASLD was defined as the presence of SLD and one or more of the following cardiometabolic risk factors [6]: 1) body mass index (BMI) ≥ 25 kg/m2 or WC ≥ 90 cm for men or 80 cm for women; 2) fasting blood glucose ≥ 100 mg/dl, blood glucose level ≥ 140 mg/dl or hemoglobin A1c ≥ 5.7% or diabetes mellitus or diabetes treatment or diabetes mellitus; 3) blood pressure ≥ 130/85 mmHg or use antihypertensive drugs; 4) triglycerides ≥ 150 mg/dl or use lipid-lowering drugs; 5) high density lipoprotein cholesterol 40 mg/dl in men and ≤ 50 mg/dl in women or use of lipid-lowering drugs. MASLD does not include excessive alcohol intake or chronic viral hepatitis (hepatitis B or C).
Assessment of thyroid function and thyroid hormone sensitivity
Thyroid function was determined by measuring TT3, TT4, FT3, FT4, TSH, and TgAb. TT3, TT4, and FT3 levels were detected by competitive binding immunoenzyme assay. In addition, FT4 concentrations were measured using a two-step enzyme immunoassay, while TSH levels were estimated using a third-generation two-site immunoenzyme (“sandwich”) assay. TgAb concentrations were measured by a two-step immunoenzyme “sandwich” assay.
TSHI is calculated as follows: TSHI = log TSH (mUI/l) + 0.1345 × FT4 (pmol/l) [28]; TT4RI is calculated as follows: TT4RI = FT4 (pmol/l) × TSH (mIU/l) [29]. Before calculating TFQIFT4, FT4 and TSH are first converted into quantiles between 0 and 1 by applying the cumulative experience distribution function (cdf) to the hormone concentrations of the population. The mathematical function is TFQI = cdf FT4 – (1 – cdf TSH) [25]. TFQI ranges from –1 to 1.
Assessment of covariates
Information on participants’ demographic characteristics, smoking status, high blood pressure, and presence of diabetes was collected using a standardized questionnaire. Races were classified as non-Hispanic white, non-Hispanic black, Mexican American, and other. Education levels were categorized as less than a high school diploma, high school/equivalent, and college or above. Household income-to-poverty ratios were classified as ≤ 1.3, 1.3-3.5, and > 3.5. BMI was classified as < 25 kg/m2, 25-29.9 kg/m2, and ≥ 30 kg/m2. Smoking status was categorized as current smoker, former smoker, or never smoker. Never smokers were classified as those who reported smoking < 100 cigarettes in their lifetime. People who have smoked > 100 cigarettes in their lifetime are considered current smokers, while those who have smoked > 100 cigarettes and have quit are considered former smokers. Diabetes was determined to meet at least one of the following criteria: 1) self-reported physician diagnosis of diabetes; 2) taking anti-diabetic drugs or insulin; 3) fasting blood glucose level ≥ 126 mg/dl; 4) blood glucose level ≥ 200 mg/dl after oral glucose tolerance test; 5) hemoglobin A1c (HbA1c) level ≥ 6.5%. Hypertension is defined as a self-reported physician diagnosis of high blood pressure, or taking antihypertensive medications or mean systolic blood pressure (ASBP)/mean diastolic blood pressure (ADBP) ≥ 140/90 mmHg. The estimated glomerular filtration rate (eGFR) was calculated using the Chronic Kidney Disease Epidemiological Collaboration Formula (CKD-EPI) [30].
In addition, laboratory blood parameters were evaluated, including high-density lipoprotein cholesterol (HDL-C), total cholesterol (TC), triglycerides, uric acid, alkaline phosphatase, aspartate aminotransferase (AST) and alanine aminotransferase (ALT). Detailed measurement information is recorded in the laboratory medical Technician Procedure manual.
Assessment of mortality
The end events we looked at included all-cause death and cardiovascular mortality. Mortality data were determined by correlation with National Death Index (NDI) records as of December 31, 2019. The cause of death was determined using ICD-10. Cardiovascular mortality was defined as deaths from heart disease (I00-I09, I11, I13, I20-I51) and cerebrovascular disease (I60-I69).
Statistical analysis
Considering the NHANES sampling survey design, all analyses in this study combine sample weights, strata, and primary sampling units to ensure that the results are representative of the U.S. population. In order to address the reduction in sample size due to missing values, multiple imputation by chained equations (MICE) was performed in this study.
Continuous variables are reported as weighted mean ± standard deviation (SD), and categorical variables are reported as numerical values and weighted percentages. The quantile of FT4 levels and the occurrence of death events were determined based on the population distribution characteristics of the participants. Comparisons between groups were made using Student’s t-tests and χ2 tests. Cox proportional hazard models were used to estimate hazard ratios (HRs) and 95% confidence intervals (CIs) for the association of thyroid function and thyroid hormone sensitivity with the risk of all-cause and cardiovascular mortality. We fit three statistical models. Model 1 was not adjusted. Model 2 was adjusted for age (continuous), sex (male or female), race (non-Hispanic white, non-Hispanic black, Mexican American, other), education level (less than high school education, high school/equivalent, college or above), family income-poverty ratio (≤ 1.3, 1.3-3.5 and > 3.5), BMI (< 25 kg/m2, 25-29.9 kg/m2, ≥ 30 kg/m2), smoking status (current smoker, former smoker, and never smoker), diabetes (none or none), hypertension (none or none). Model 3 further adjusted for total cholesterol (TC) (continuous), HDL-C (continuous), triglyceride (continuous), eGFR (continuous), uric acid (continuous), alkaline phosphatase (continuous), AST (continuous), and ALT (continuous). Kaplan-Meier curve analysis and the log-rank test were used to assess survival in the sensitivity tertile of thyroid function and thyroid hormones before entering the model. To explore the dose-response association between thyroid function and sensitivity to thyroid hormones and all-cause and cardiovascular mortality, a restricted cubic spline (RCS) with four knots (5th, 35th, 65th, and 95th percentiles) was constructed based on Model 3. The likelihood ratio test was used to determine the significance of the nonlinear relationship.
In addition, stratified analyses were performed according to age (≤ 60 years or > 60 years), gender (female or male), race (non-Hispanic white or other), BMI (< 30 kg/m2 or ≥ 30 kg/m2), hypertension (no or yes), and diabetes (no or yes). Potential interactions were assessed by including the corresponding multiplicative and additive interaction terms.
We performed several sensitivity analyses to test the robustness of our findings. We performed the primary analysis only among participants with complete covariate data to reduce potential bias due to missing information. Second, we have reduced the potential for reverse causal bias by excluding deaths that occurred within two years at baseline. Finally, we excluded participants who had cardiovascular disease (CVD) at baseline to reduce the effect of CVD on the risk of death.
All analyses were performed using R software (R version 4.3.2). P < 0.05 was considered statistically significant.
Results
Baseline characteristics of study participants
Among 1,198 U.S. adults included in the study, 539 (44.7%) were women, the mean age was 50.1 ±15.4 years, and 546 (69.5%) were non-Hispanic white. The baseline characteristics of participants based on the FT4 level quantile are summarized in Table 1. Participants with higher FT4 levels were older and had higher TC levels. They also had high levels of TT4, TSH, TSHI, TT4RI, and TFQIFT4.
Table 1
Baseline characteristics of euthyroid patients with MASLD in NHANES 2007-2012 –
[i] Continuous variables are presented as weighted averages ± standard deviations; categorical variables are presented as unweighted counts (weighted percentage).
[ii] BMI – body mass index, TC – total cholesterol, HDL-C – high-density lipoprotein cholesterol, AST – aspartate aminotransferase, ALT – alanine aminotransferase, FT3 – free triiodothyronine, FT4 – free thyroxine, TT3 – total triiodothyronine, TT4 – total thyroxine, TSH – thyrotropin, TgAb – thyroglobulin antibodies, TSHI – thyroid stimulating hormone index, TT4RI – Thyrotroph T4 Resistance Index, TFQI – Thyroid Feedback Quantile-based Index
During a median follow-up of 11.1 years (12,188.8 person-years), 178 (14.9%) all-cause deaths were recorded, of which 46 (3.8%) were cardiovascular deaths. Participants who died during the follow-up period tended to be older and were more likely to be male, non-Hispanic white, less educated, to have lower income, be current smokers, and to have diabetes and hypertension. In addition, FT3 and TT3 levels were often lower, while FT4, TSHI, and TFQIFT4 levels were higher (Table 2).
Table 2
Baseline characteristics of participants according to outcome events in NHANES 2007-2012
[i] Continuous variables are presented as weighted averages ± standard deviations; categorical variables are presented as unweighted counts (weighted percentage).
[ii] BMI – body mass index, TC – total cholesterol, HDL-C – high-density lipoprotein cholesterol, AST – aspartate aminotransferase, ALT – alanine aminotransferase, FT3 – free triiodothyronine, FT4 – free thyroxine, TT3 – total triiodothyronine, TT4 – total thyroxine, TSH – thyrotropin, TgAb – thyroglobulin antibodies, TSHI – thyroid stimulating hormone index, TT4RI – Thyrotroph T4 Resistance Index, TFQI – Thyroid Feedback Quantile-based Index
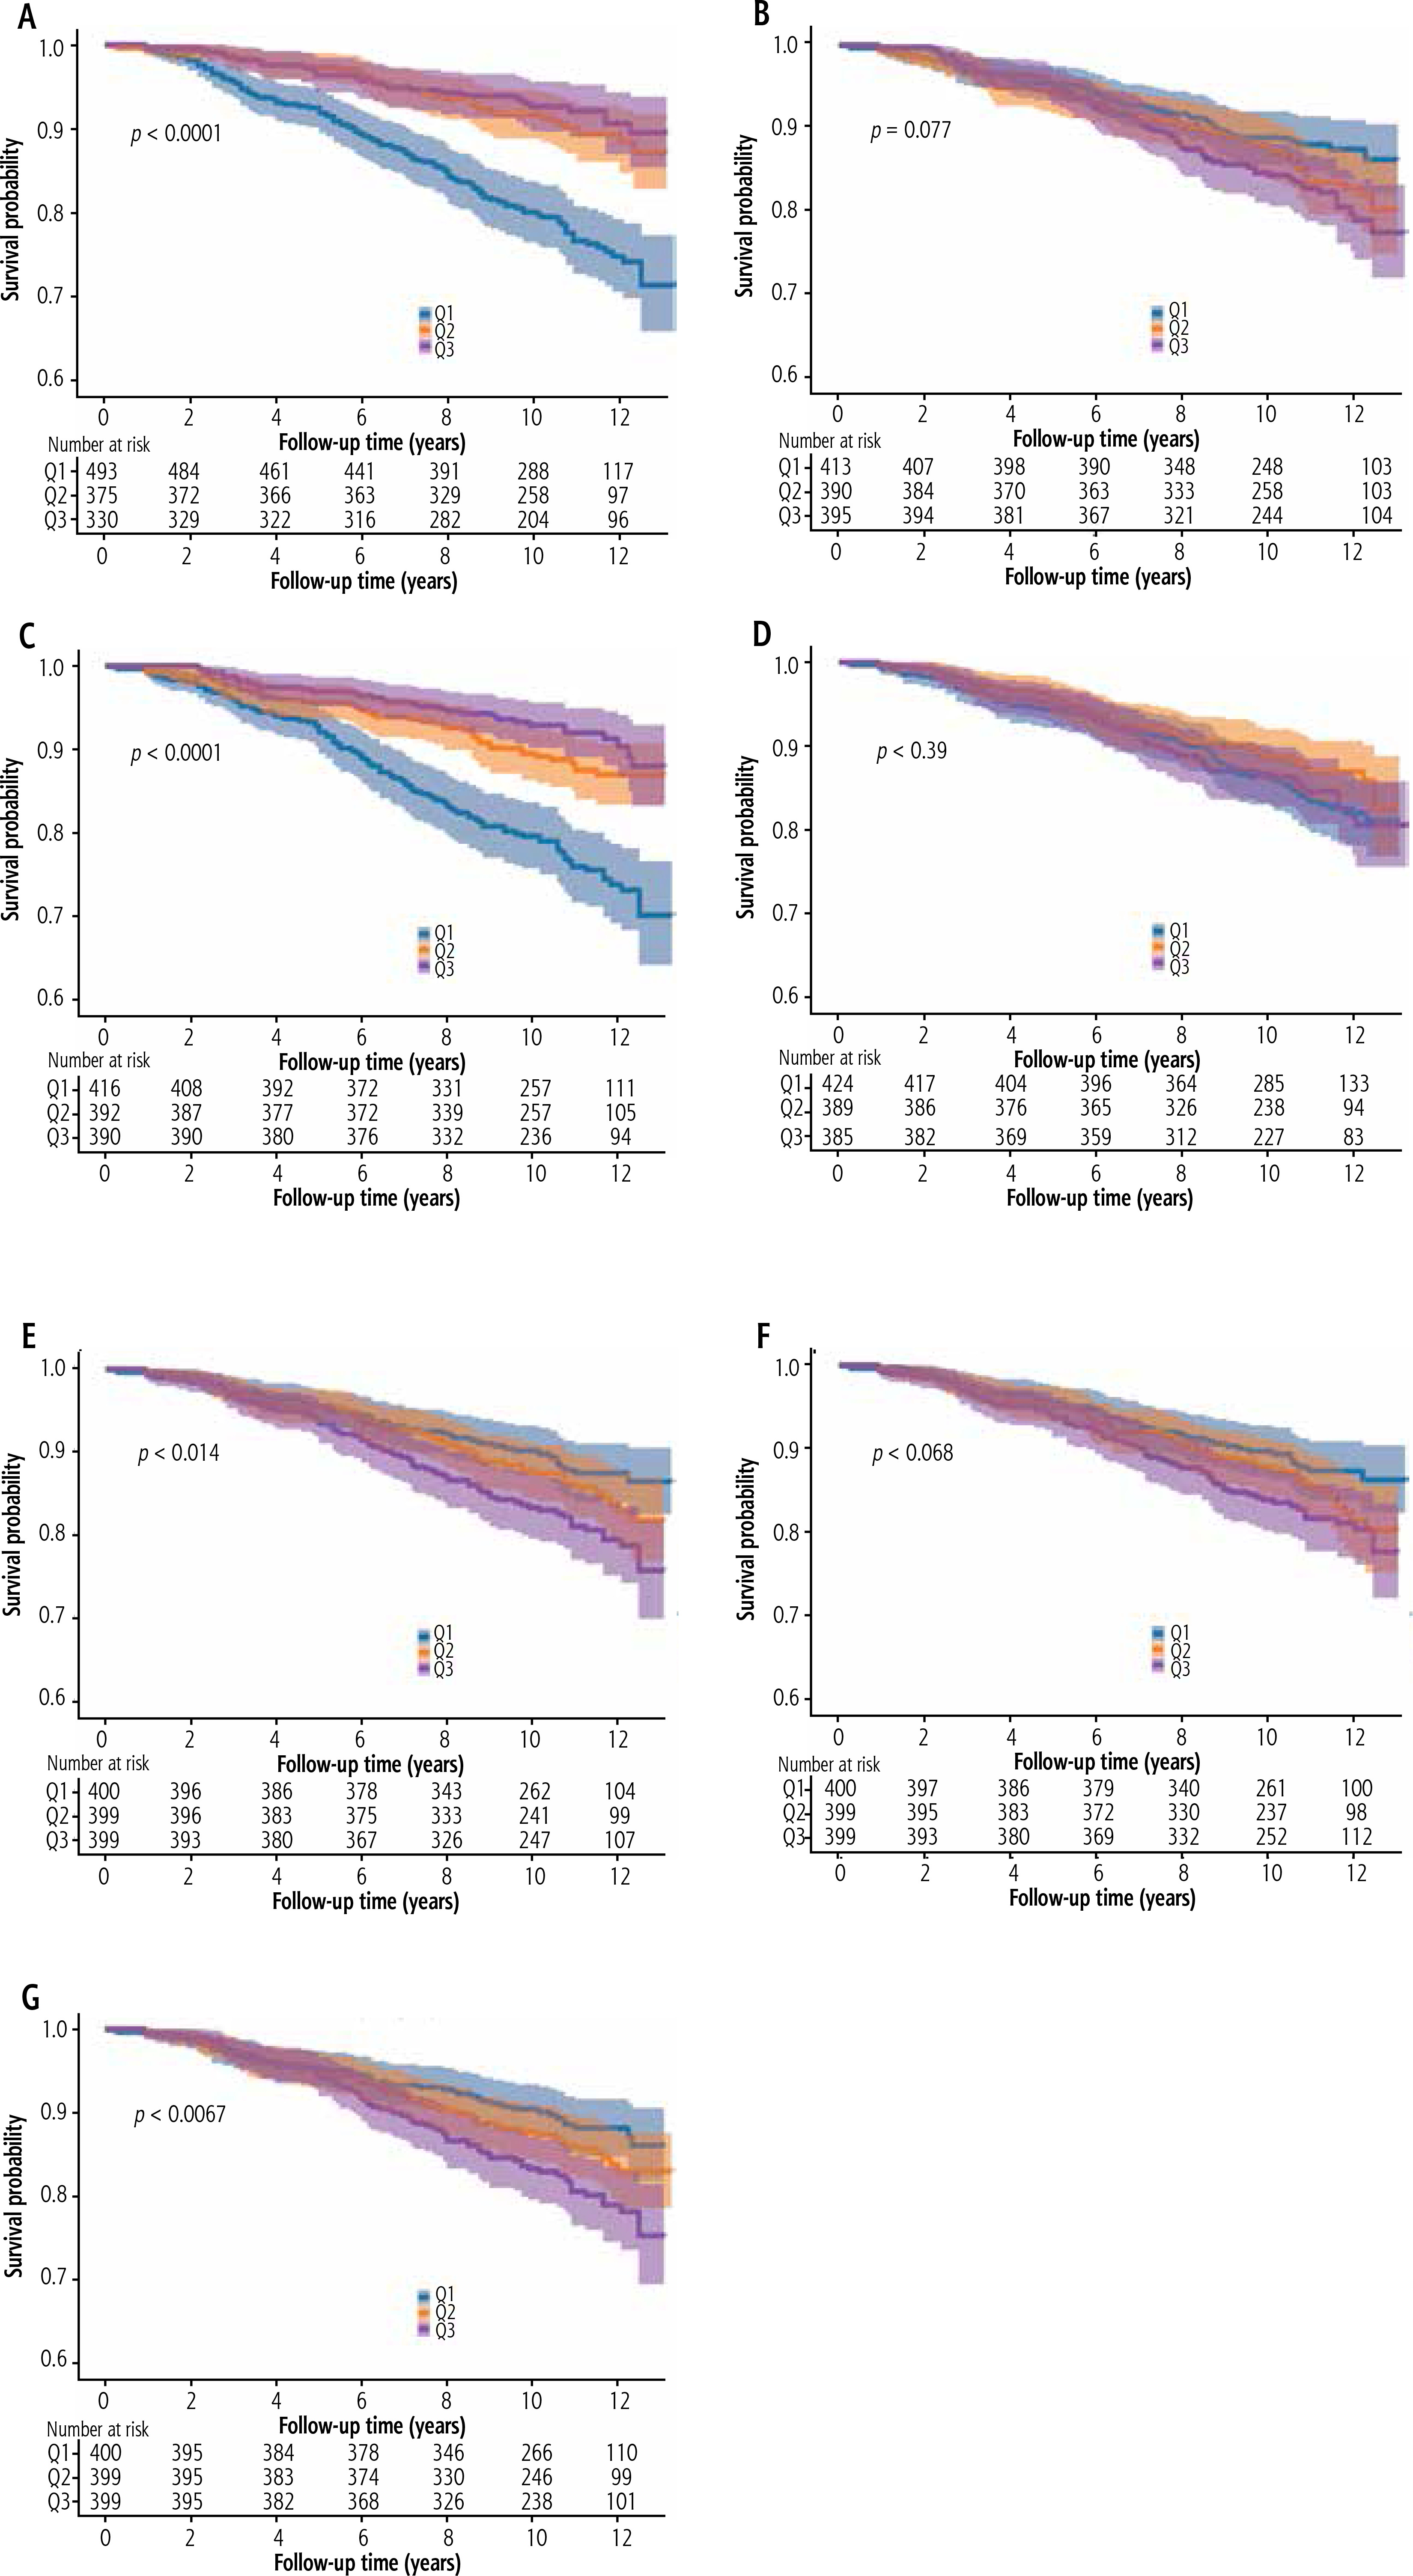
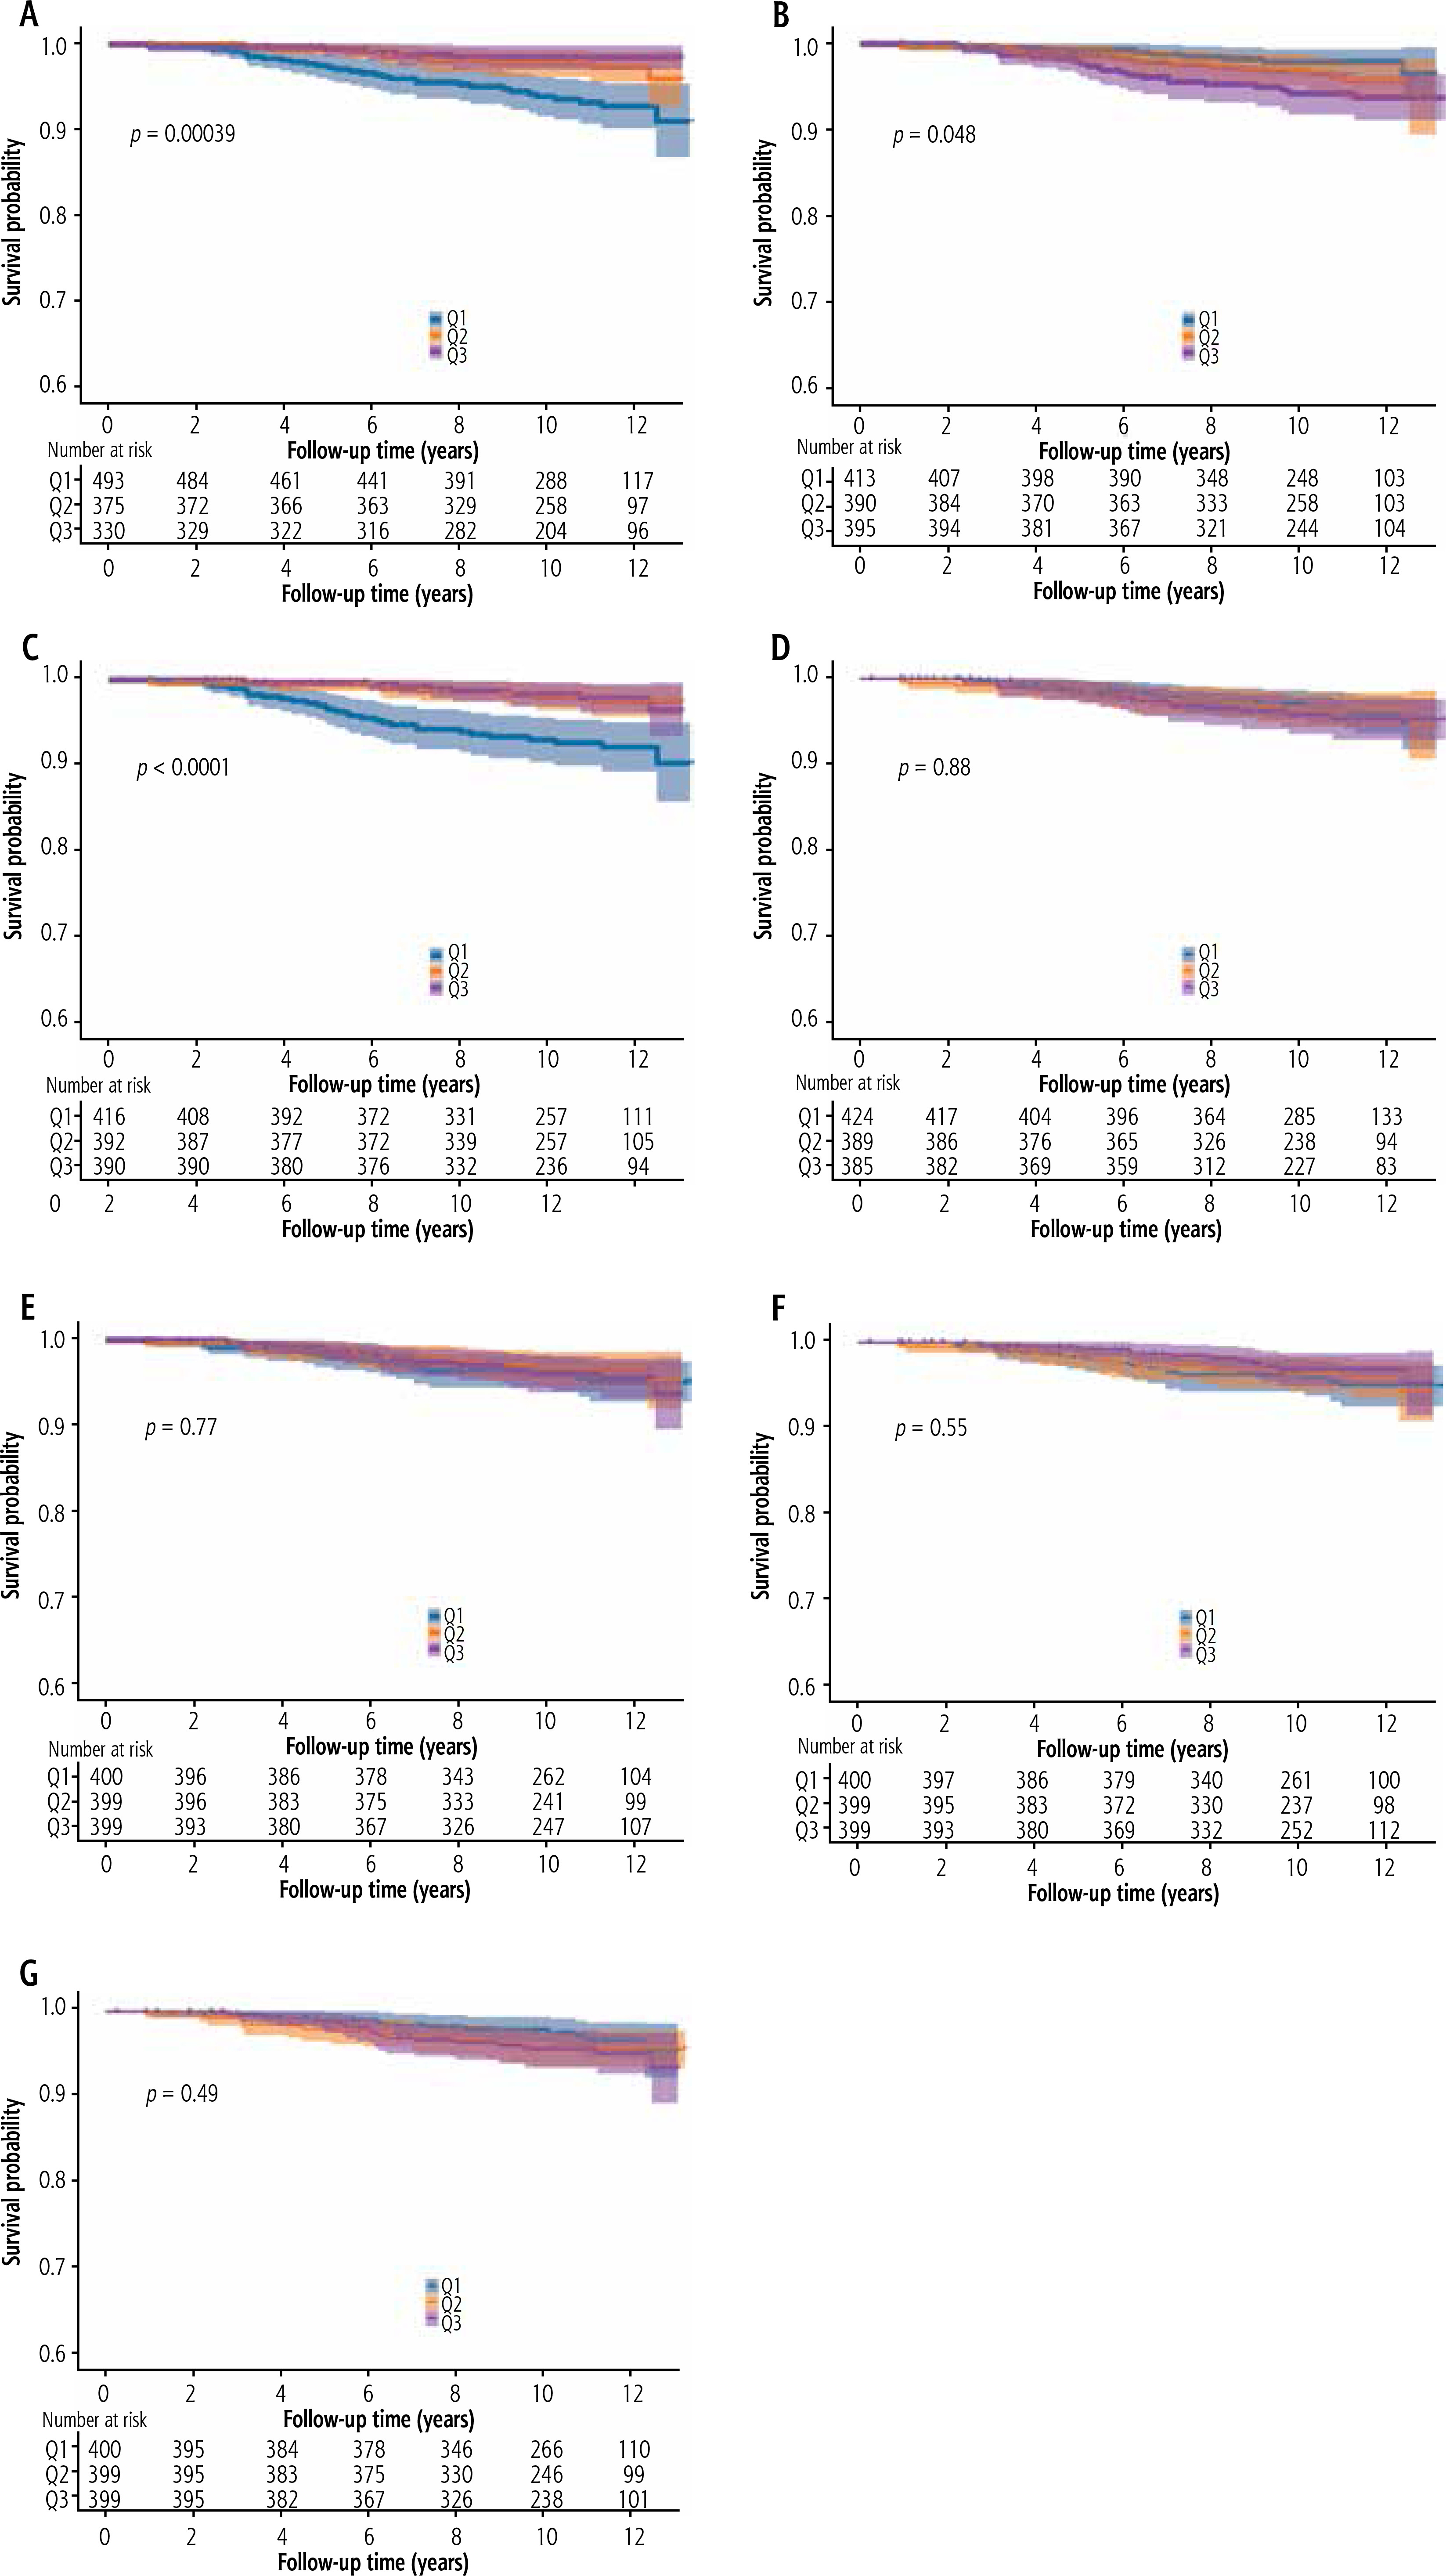
Kaplan-Meier survival curves of thyroid function and thyroid hormone sensitivity for all-cause and CVD mortality
Kaplan-Meier survival curves for long-term all-cause mortality and cardiovascular disease mortality for thyroid function and thyroid hormone sensitivity are shown in Figures 2 and 3. For all-cause mortality, differences in levels of FT3, TT3, TSHI, and TFQIFT4 were observed between groups. For CVD mortality, differences in levels of FT3, FT4, and TT3 were observed between groups.
Association of thyroid function and thyroid hormone sensitivity with all-cause mortality and CVD mortality
As a continuous variable, FT4 level was independently associated with all-cause mortality after full adjustment for potential confounders (Table 3). The hazard ratio (HR) was = 1.162 per 1-unit increment, 95% CI: 1.044-1.293. FT4 level and TSH level were positively associated with CVD mortality with HR = 1.353 per 1-unit increment and 95% CI: 1.168-1.567, and HR = 0.527 per 1-unit increment, 95% CI: 0.311-0.894. Other thyroid functions and thyroid hormone sensitivity were not significantly associated with either all-cause death or CVD mortality in fully adjusted models.
Table 3
Association of thyroid function and thyroid hormone sensitivity with all-cause and cardiovascular disease (CVD) mortality in euthyroid patients with MASLD
[ii] Model 1 is not adjusted. Model 2 is adjusted for age, gender, race, education level, family income-poverty ratio, smoking status, BMI, hypertension, and diabetes. Model 3 is further adjusted for TC, triglycerides, HDL-C, uric acid, eGFR, alkaline phosphatase, AST and ALT.
[iii] BMI – body mass index, TC – total cholesterol, HDL-C – high-density lipoprotein cholesterol, AST – aspartate aminotransferase, ALT – alanine aminotransferase, FT3 – free triiodothyronine, FT4 – free thyroxine, TT3 – total triiodothyronine, TT4 – total thyroxine, TSH – thyrotropin, TgAb – thyroglobulin antibodies, TSHI – thyroid stimulating hormone index, TT4RI – Thyrotroph T4 Resistance Index, TFQI – Thyroid Feedback Quantile-based Index
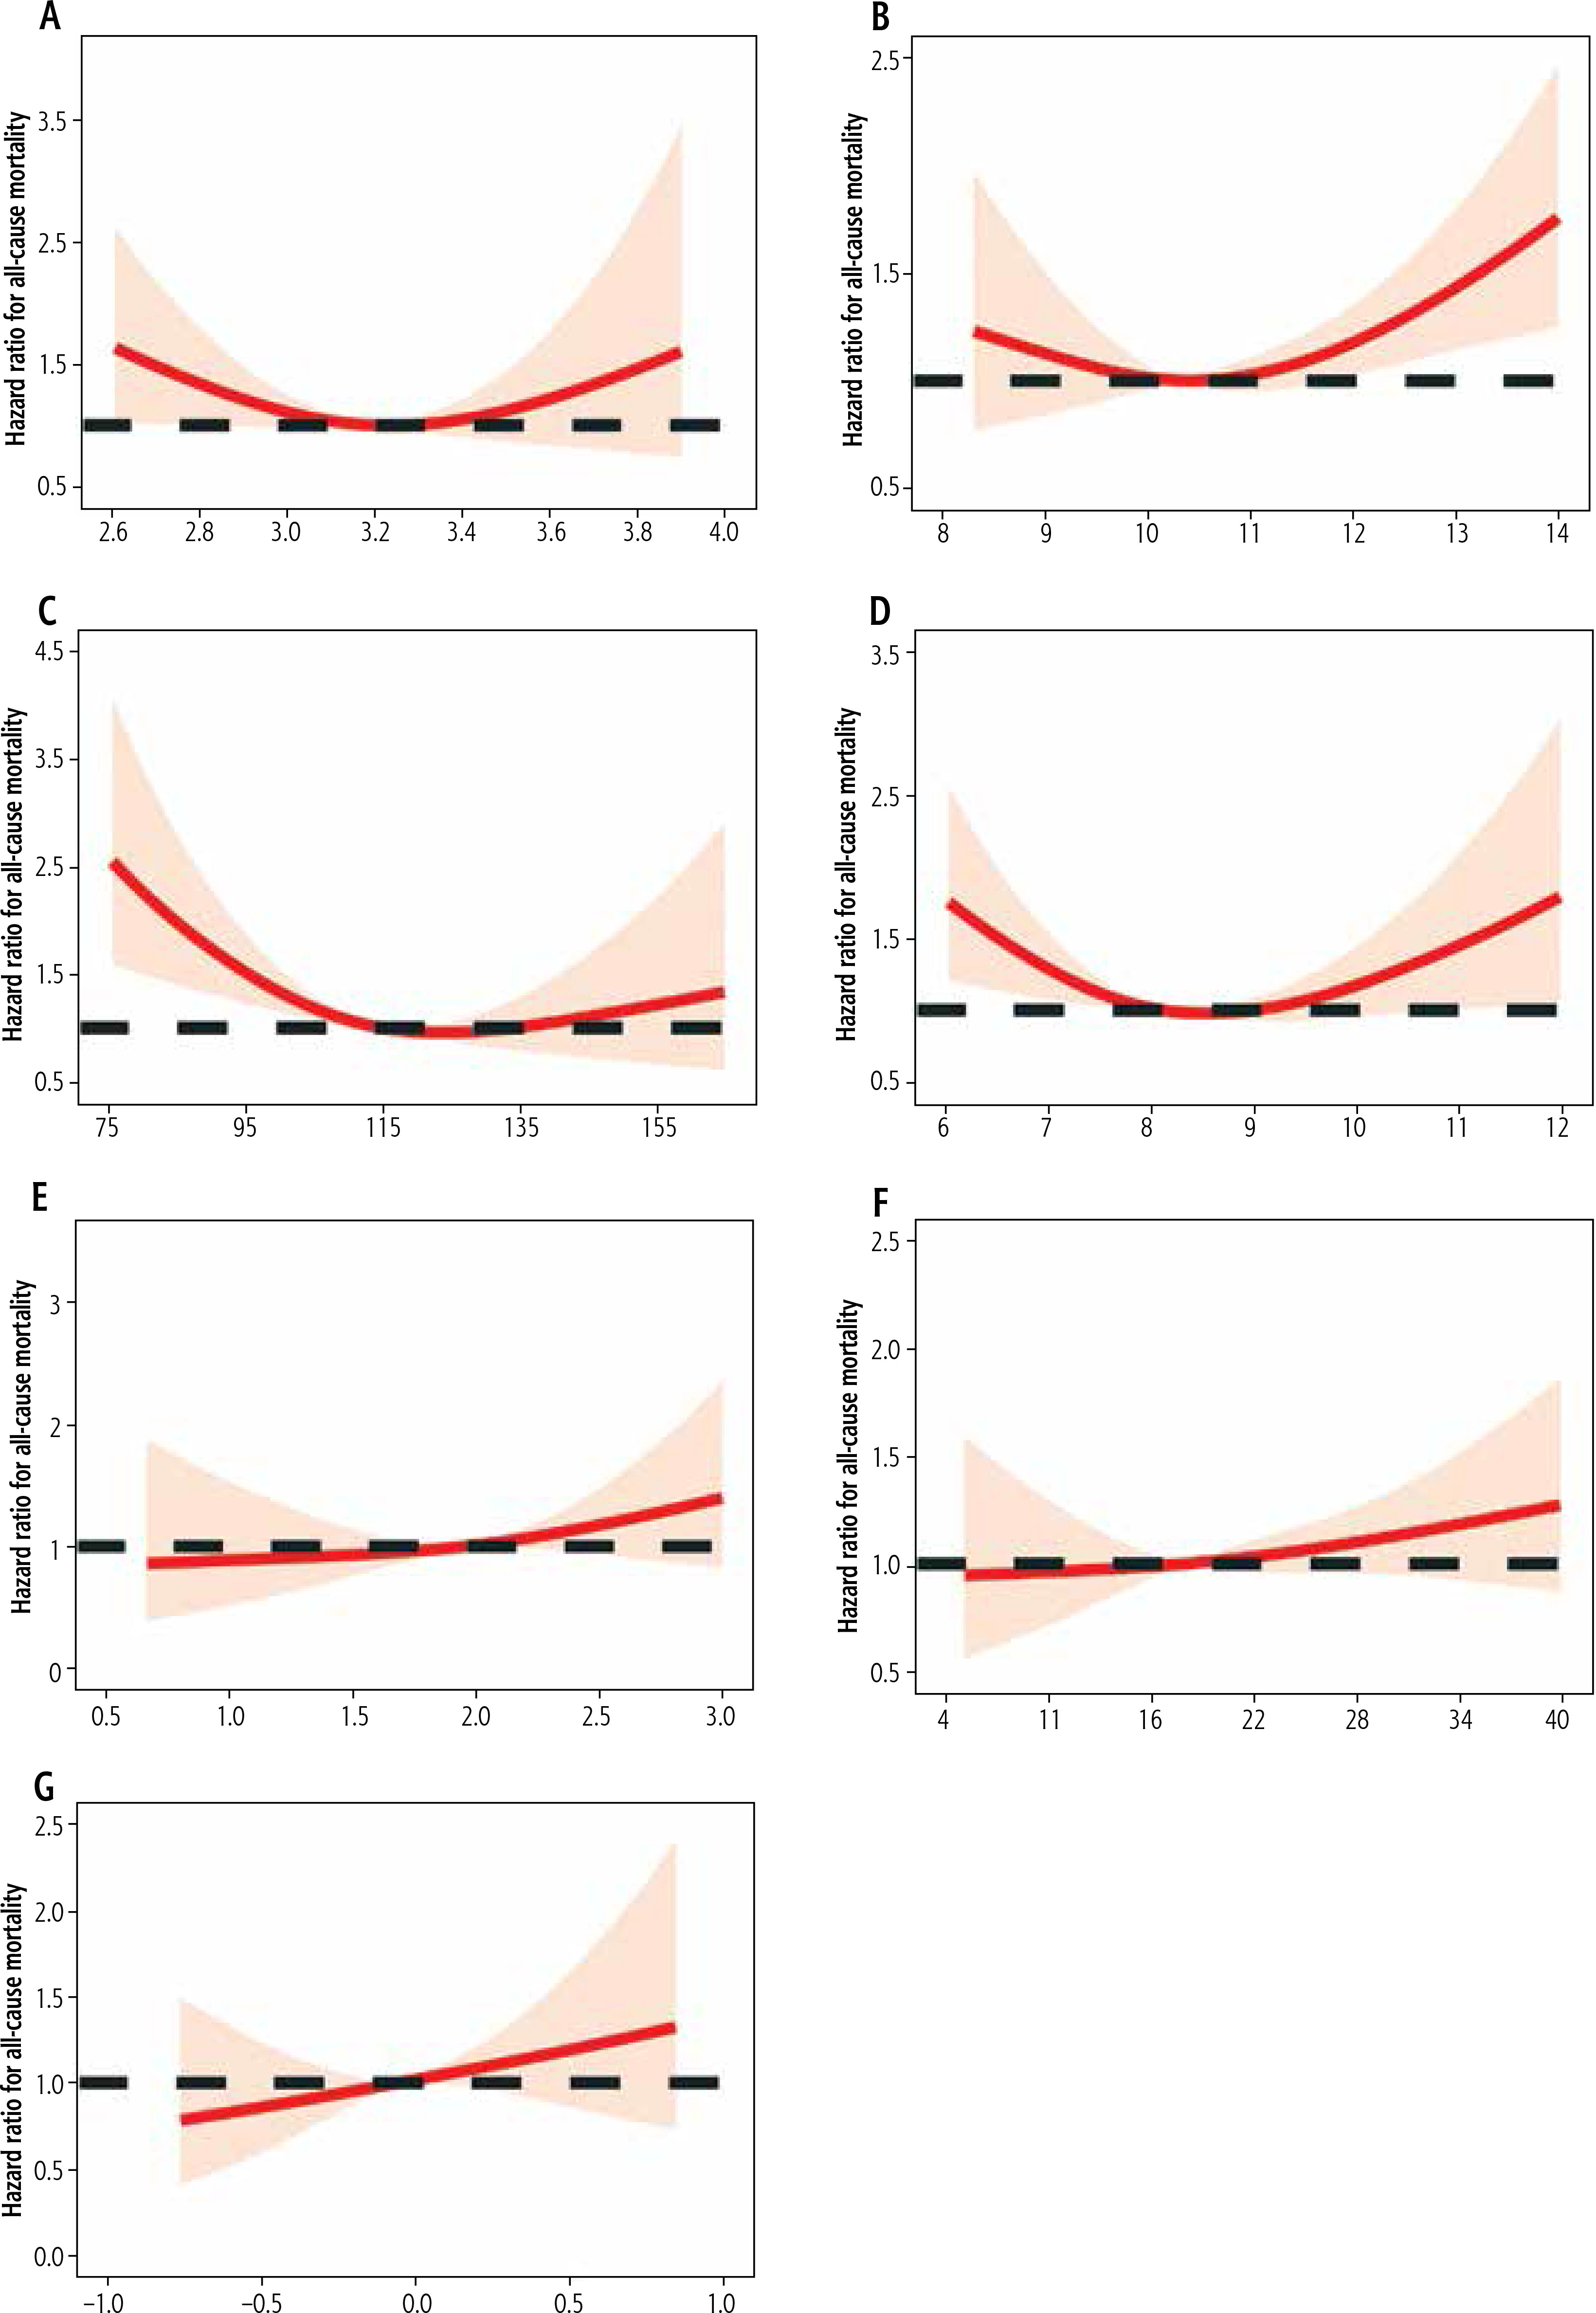
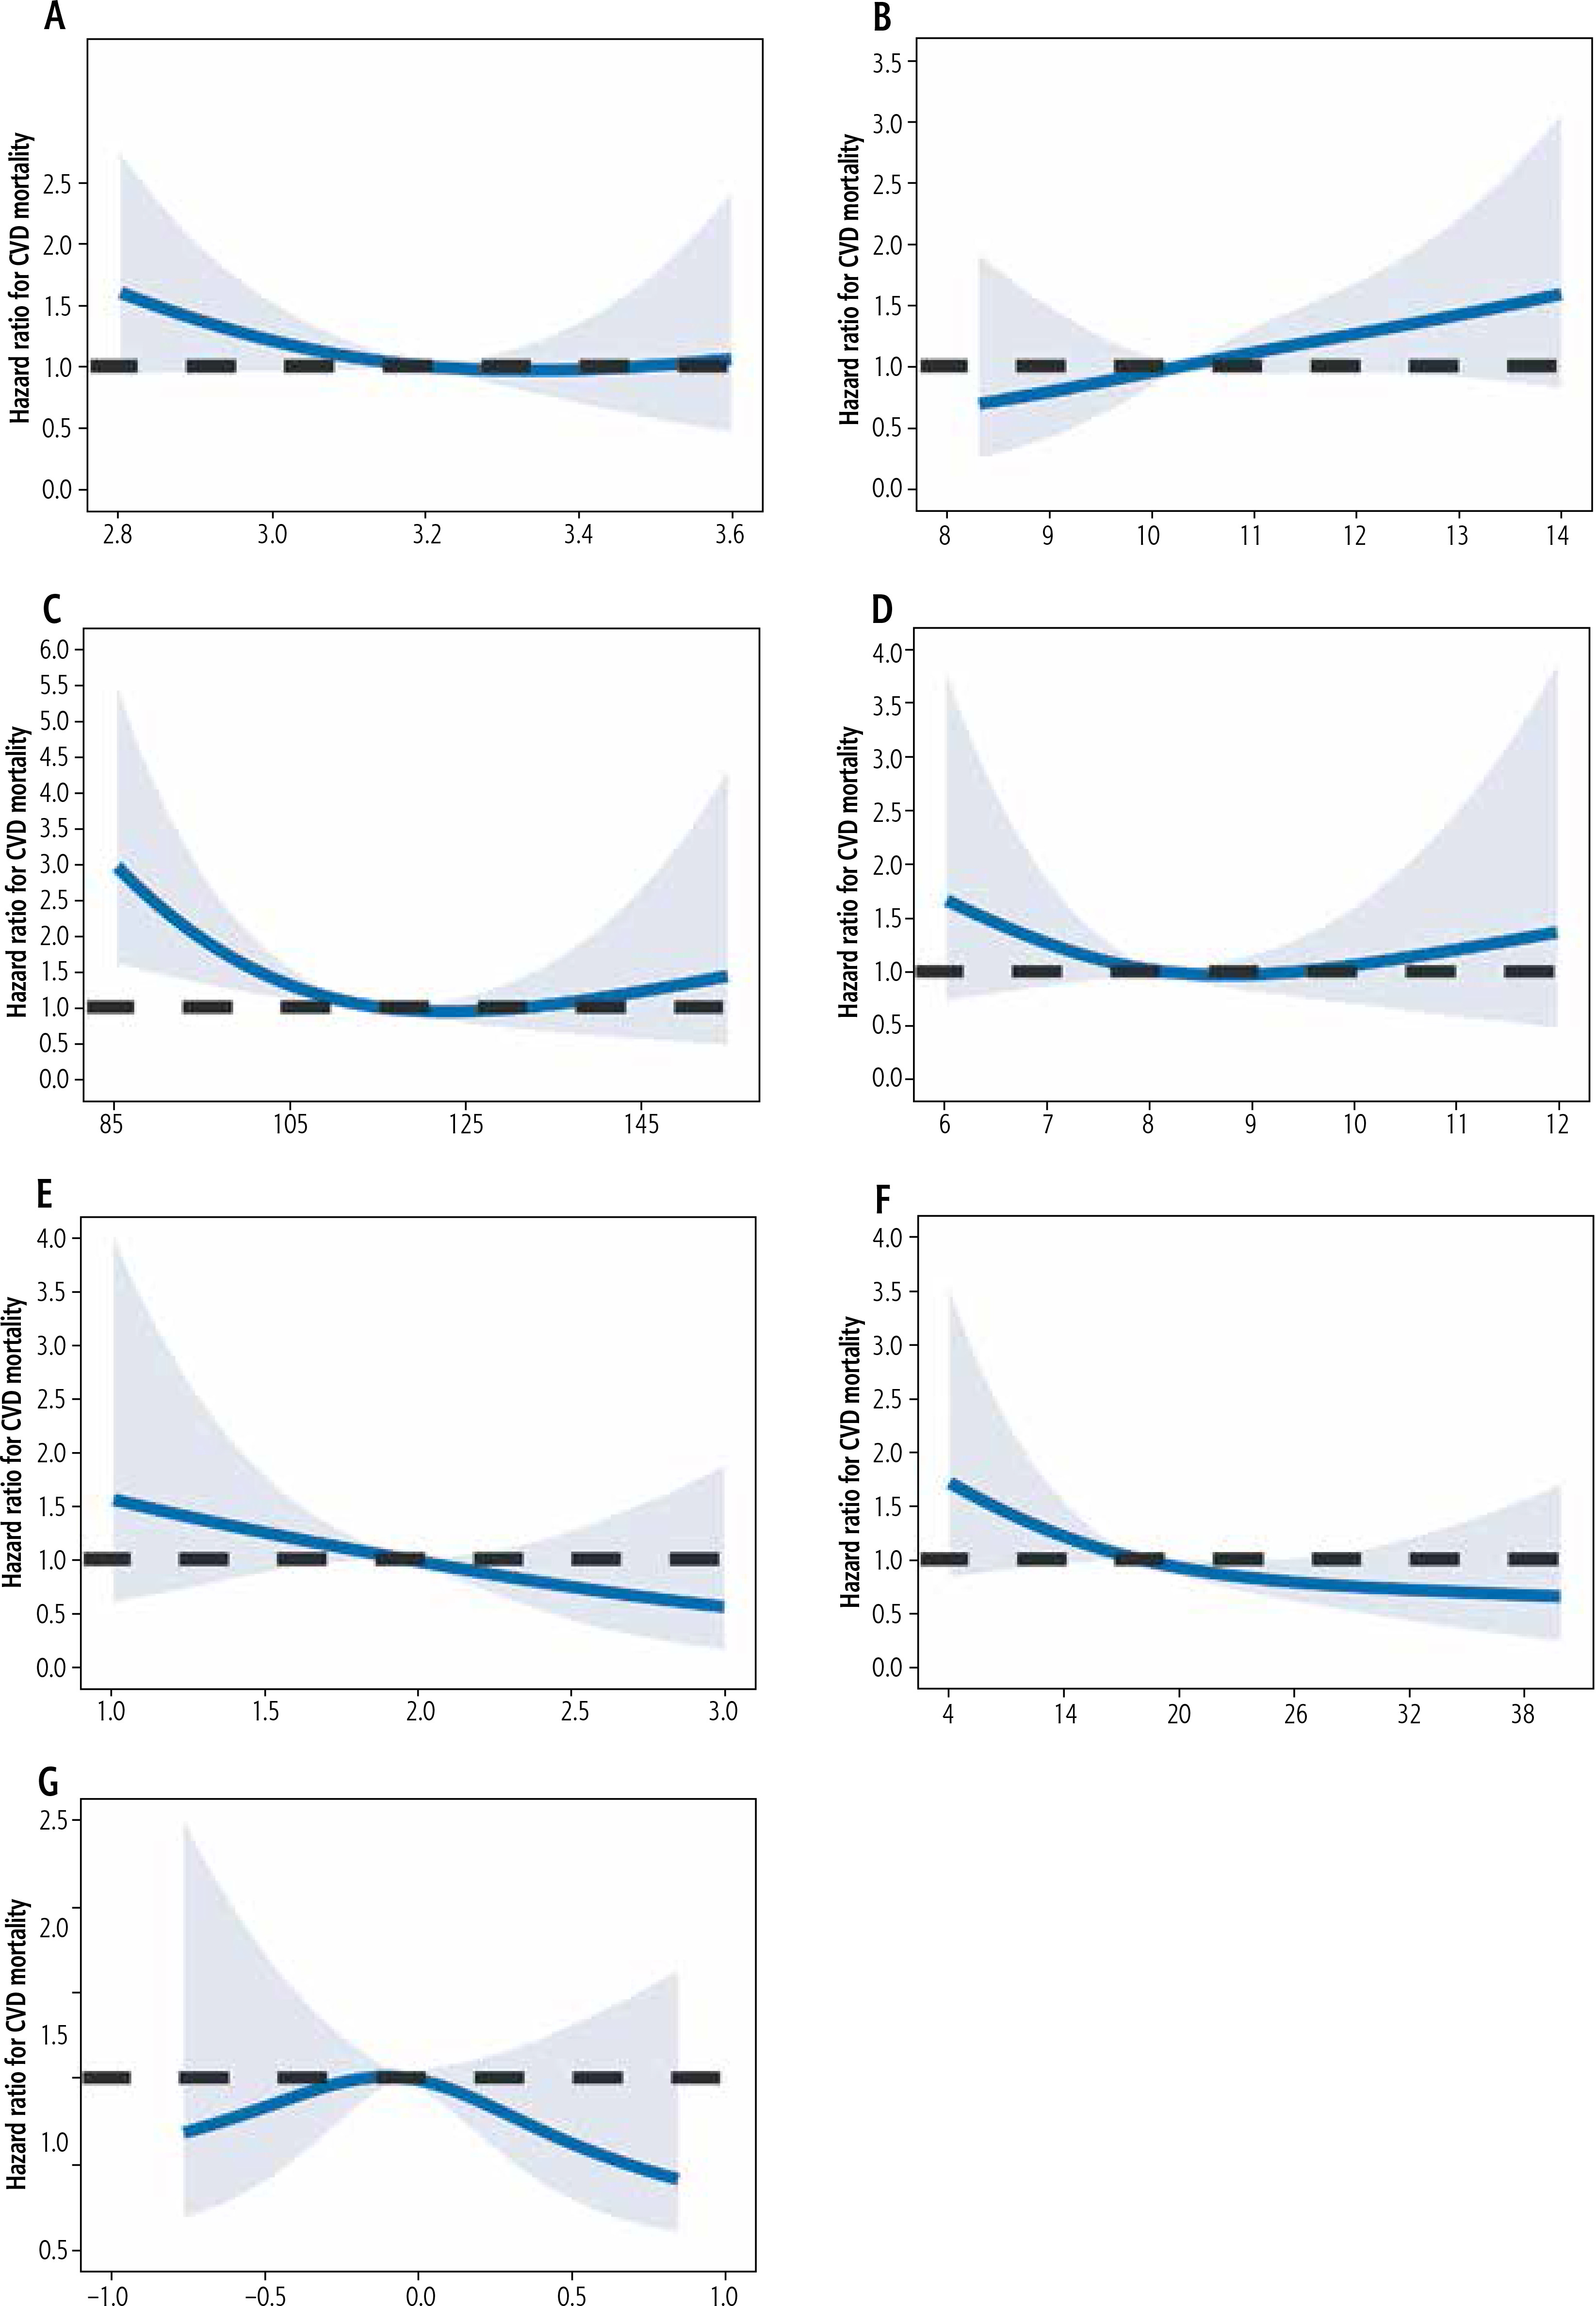
In addition, according to RCS analysis, FT3, FT4, TSHI, TT4RI, and TFQIFT4 in MASLD patients with normal thyroid function were significantly linearly positively correlated with all-cause mortality risk. TT3 and TT4 levels were associated with approximately U-shaped risk of all-cause mortality (P non-linear = 0.0091 and 0.0014, respectively). Similarly, TT3 levels showed a significant nonlinear relationship with CVD mortality (P nonlinear = 0.0016) (Figs. 4 and 5).
Stratified analysis
Associations between thyroid function and thyroid hormone sensitivity and all-cause death and CVD mortality were not uniformly significant in subgroups stratified by age (≤ 60 years or > 60 years), gender (female or male), race (non-Hispanic white or other), BMI (< 30 kg/m2 or ≥ 30 kg/m2), hypertension (no or yes), diabetes (no or yes) (Tables S1-S6). However, we still observed associations between FT4 and mortality in some subgroups. In particular, significant associations were observed in women, non-white race, BMI ≥ 30, and diabetes. In addition, we observed significant interaction effects, especially the additive interaction test.
Sensitivity analysis
In sensitivity analysis, to assess the effect of multiple interpolations, we analyzed participants without imputed data, and the results remained unchanged (Table S7). When participants who died within the first two years of follow-up were further excluded, the association of FT4 with all-cause mortality and cardiovascular disease mortality did not substantially change (Table S8). Finally, when participants with CVD at baseline were excluded, consistent results were observed (Table S9).
Discussion
To our knowledge, this is the first study to explore the relationship between thyroid hormone levels and thyroid hormone sensitivity and all-cause mortality and cardiovascular mortality in MASLD patients with normal thyroid function. Our review found that higher levels of FT4 within the normal range are associated with an increased risk of all-cause mortality, with a dose-response relationship. The normal range of FT4 levels is connected with an increased risk of CVD mortality. These relationships are unrelated to traditional confounding factors, including demographic characteristics, lifestyle, economic and social factors, blood lipid levels, etc. However, it is worth noting that in MASLD patients with normal thyroid function, thyroid function indicators (FT3, TT4, TgAb, TSH) and thyroid hormone sensitivity (TSHI, TT4RI, TFQIFT4) are not significantly correlated with all-cause mortality and cardiovascular disease mortality. Layered analysis and sensitivity analysis explained the robustness of our research results.
Thyroid hormones play an important role in regulating glucose, fat metabolism, and mitochondrial function. Previous studies have shown a close association between thyroid dysfunction and cardiovascular disease [31] and cancer [32]. FT4 is the most direct indicator of thyroid hormone biological effects and has become the preferred indicator for diagnosing clinical hyperthyroidism. However, the association between FT4 and mortality risk is not consistent. Some clinical research results have raised concerns about the safety of long-term mortality risk associated with high FT4 levels [32–36]. For example, an analysis primarily targeting elderly American community residents with normal thyroid function showed that elevated levels of FT4 within the normal range were associated with an increased risk of mortality [34]. However, three clinical studies targeting the elderly population showed that the relationship between FT4 levels and long-term all-cause mortality was not significant [36–38]. In addition, a thyroid function association study of patients with acute heart failure during hospitalization found a significant negative correlation between FT4 levels and left ventricular ejection fraction (LVEF), but no significant association with 30-day risk of mortality was observed [34]. Therefore, in the long-term dynamic process of FT4 affecting all-cause mortality and cardiovascular events, in addition to regulating oxidative stress and lipid metabolism, there may also be a potential negative impact on myocardial contractility, with unknown mechanisms. The results of this study suggest that FT4 levels within the normal range are significantly positively correlated with the risk of all-cause mortality and cardiovascular mortality, but the relationship between TSH and mortality has not been confirmed. This may be due to changes in pituitary sensitivity and pituitary TSH settings, with differences in TSH suppression caused by higher FT4 levels between young and old adults. In our subgroup analysis of age, we found differences in FT4 among different age groups, while TSH had no effect in any age group. However, there is a significant additive interaction between FT4, TSH, and age, indicating that the impact of thyroid hormones on long-term mortality risk is to some extent influenced by age.
However, it is still unclear whether thyroid hormones, especially FT4, affect all-cause mortality and CVD mortality in MASLD patients with metabolic disorders and increased risk of cardiovascular and cerebrovascular diseases. Previous studies have shown that hypothyroidism is associated with the incidence of MASLD [39, 40]. In a large cohort followed up for 23 years, low thyroid function was found to be associated with an increased risk of all-cause mortality and cardiovascular death in MASLD patients [41]. In addition, in vitro and in vivo studies have shown that hypothyroidism induces MASLD through the pleiotropic effect of thyroid hormones on insulin secretion and adrenergic stimulation of fat breakdown in adipose tissue. Hypothyroidism has been identified as a potential modifiable factor in MASLD, and potential therapeutic targets for treating hypothyroidism-related MASLD have been identified. Our research suggests that even in patients with normal thyroid function, reduced thyroid function has an impact on mortality, which expands the scope of improving prognosis through the treatment of hypothyroidism. Notably, although the main mechanism by which significant changes in thyroid function affect the prognosis of MASLD is currently achieved through cardiovascular events, TT3 did not have a substantial effect on cardiovascular death in our study. This may be due to low T3 syndrome and the dynamic changes in T3, in which case FT4, affecting thyroid hormone activity, is unaffected.
Through long-term follow-up of multiple ethnic populations in the United States, we found a significant linear correlation between FT4 and all-cause mortality and CVD mortality. After completely adjusting for potential confounding variables, the relationship between FT4 and all-cause mortality and CVD mortality remained almost unchanged, indicating that this association seems unlikely to derive from other metabolic-related factors. Therefore, this result suggests that although MASLD patients maintain normal levels of FT4, they should try to reduce this level as much as possible. Interestingly, our research results provide the opposite explanation for the association between TT3 levels and all-cause mortality and CVD mortality, suggesting a positive dose-response relationship between TT3 and all-cause mortality and CVD mortality, which exhibits an inverse “J” shape. This to some extent guides MASLD patients to improve prognosis by increasing TT3 levels within the normal range.
It is worth noting that the results of this study demonstrate a relatively weak relationship between thyroid hormone sensitivity and mortality. After adjusting for demographic characteristics, lifestyle, and socio-economic factors, there was a significant positive correlation between TFQI and all-cause mortality. However, after further adjusting for blood indicators such as blood lipids, this association was not significant. Similarly, associations of TSHI and TT4RI were only observed in the risk model without adjusting for confounding factors. Our research results are inconsistent with the results of observational studies conducted in the general population. Previous results have shown that decreased thyroid hormone sensitivity is associated with an increased risk of hypertension, diabetes, and cardiovascular disease [24, 25, 42]. In 2019, Laclaustra et al. [25] proposed the TFQI indicator for detecting mild thyroid hormone resistance in the population to evaluate thyroid hormone sensitivity. The results indicate that TFQI is more reliable in assessing thyroid hormone sensitivity compared to TSHI and TT4RI. A longitudinal observational study of 3750 participants without thyroid disease found that, compared to the group with the highest TFQI (TFQI ≤ p5), the TFQI > p95 group had a 161% increased risk of mortality (HR = 2.61, 95% CI: 1.16-5.89) [43]. Another study involving 3750 euthyroid Spanish participants showed that TFQI still had a strong association with all-cause mortality [43]. Although the exact mechanism of TFQI in assessing the risk of MASLD and mortality is still unclear, we consider that FT3 is mainly derived from the deiodination of FT4, which can be considered as an energy expenditure and a compensatory mechanism for fat accumulation, and can better reflect the sensitivity of thyroid hormones [44]. Similarly, we also noted the potential impact of TSHI and TT4RI on all-cause mortality and cardiovascular mortality. Since TSH is regulated by the negative feedback of FT4 and is thus regarded as incapable of objectively reflecting thyroid function, researchers have proposed TSHI to better assess the function of the pituitary-thyroid axis. Excessive or insufficient TSHI is associated with an increased risk of all-cause mortality [45, 46]. A prospective cohort study involving 1470 patients with normal thyroid function found that higher levels of TSHI and TT4RI increased the risk of long-term adverse cardiovascular events and CVD mortality after a median follow-up of 111 months [47]. We did not observe a significant relationship between thyroid hormone sensitivity and all-cause mortality and CVD mortality in the MASLD population with normal thyroid function. However, this potential effect has been observed in our specific subgroups, such as non-Hispanic white people, diabetes people, and non-hypertensive people. Further large-scale prospective studies are needed to investigate these associations.
This study is based on a prospective cohort study with long-term follow-up, which is the first to evaluate the relationship between thyroid hormones, thyroid hormone sensitivity, all-cause mortality, and cardiovascular mortality in MASLD patients with normal thyroid function in American adults. This study carefully adjusted for multiple potential confounding factors, including demographic characteristics, lifestyle, economic and social factors, and blood lipid levels. However, we still need to consider some limitations. Firstly, due to the small sample size and follow-up of cardiovascular death events, the possibility to generalize the research results to a wider population may be limited. Secondly, due to the observational study design, there are still potential confounding factors that have not been considered, making it impossible to determine causal relationships. Thirdly, there may be differences between the results of subgroup analysis and sensitivity analysis and the overall population results, so the interpretation of the results should be cautious. Fifth, this study did not consider the use of drugs that may affect thyroid function, such as propiconazole, metronidazole, glucocorticoids, amiodarone, etc., which may affect the stability of thyroid hormones in patients’ blood. Finally, we were unable to track longitudinal data on patients’ thyroid function, as thyroid hormones fluctuate greatly due to other factors, and a single indicator alone cannot fully represent the true level of individual patients.
Conclusions
In summary, in this nationally representative sample of U.S. adults with normal thyroid function with MASLD, we found that increased FT4 levels were significantly linearly positively associated with all-cause mortality and cardiovascular mortality. In contrast, increased TT3 levels were significantly negatively associated with all-cause mortality. However, other indicators of thyroid function and thyroid hormone sensitivity were not associated with mortality, and further studies are needed.


