
Introduction
Cancer is a growing health, social and economic problem of the Polish population. It is the second leading cause of death in Poland and the leading cause of premature mortality (among people aged younger than 65) especially in the female population: it accounts for 35% of deaths among young women and 49% among middle-aged women [1]. Looking at measures such as incidence and mortality rates may not provide a complete picture of the effect of the disease. The number of deaths alone does not reflect the complete burden on society, as some cancers harm younger people more than others. The aims of this study were: 1) to quantify the impact of death due to the most frequently recorded cancer-related causes of death in Poland by estimating the years of potential life lost (YPLL) and mean YPLL and 2) to compare different mortality statistics which include measures of the burden of cancer deaths on both the population and individual patients. YPLL measures the average time an individual would have lived had he or she not died prematurely, in an attempt to highlight the economic and social impact of premature mortality [2]. Mean YPLL provides a measure of the burden of cancer to the individual patient rather than the population as a whole and is calculated by dividing the overall YPLL value by the total mortality value (equivalent to calculating the average of the remaining life expectancy values weighted by the number of deaths in each age group). Accurate estimations of YPLL and mean YPLL are imperative for evaluating cancer management and understanding the disease burden on society [3, 4]. Earlier reports have shown that the contribution to cancer-caused YPLL and mean YPLL varies substantially according to cancer site [5–7]; therefore a detailed analysis at the national level seems desirable.
Material and methods
The cancers selected for this study included the 11 most frequently recorded cancer-related causes of death in Poland (ICD-10 codes: C16, C18, C20, C25, C34, C50, C56, C61, C64, C67, C71). Absolute numbers of cancer deaths by site, gender and five-year age groups were obtained from the Polish National Cancer Registry [1]. The most current available data were for 2015; thus 2015 was the year chosen for all of the analyses in this study. The causes of death for the analysed cancers were defined using ICD-10 codes [8]. YPLL was calculated by applying the up-to-date reference life tables proposed by the Institute for Health Metrics and Evaluation and recently used in the Global Burden Of Disease study (GBD 2015), with the normative standard life expectancy of 86.59 years at birth, not age-weighted or discounted [9]. Each YPLL value was calculated by multiplying the mortality values by the remaining life expectancy values for each age category and summing across all of them. In order to perform direct comparison with percentage mortality, YPLL for an individual cancer site was expressed as a percentage of the total years of life lost from all cancers. Figures for YPLL were used to produce an additional mortality statistic – the mean YPLL. Mean YPLL is an average derived by dividing YPLL by the actual number of deaths for each cancer site over a defined time period. Total and mean YPLL were computed for each of the selected cancers for both sexes combined. In order to compare YPLL and mortality parameters the YPLL of each cancer was expressed as a percentage of the total YLL to cancers, and related to the number of deaths (mortality) of each cancer as a percentage of the total number of deaths of cancer. The results of these calculations indicate the relative difference between the YPLL and mortality.
Results
Mortality
The total numbers of deaths due to cancer in 2015 was 100,601. The age-at-death distribution for all cancers is presented in Figure 1.
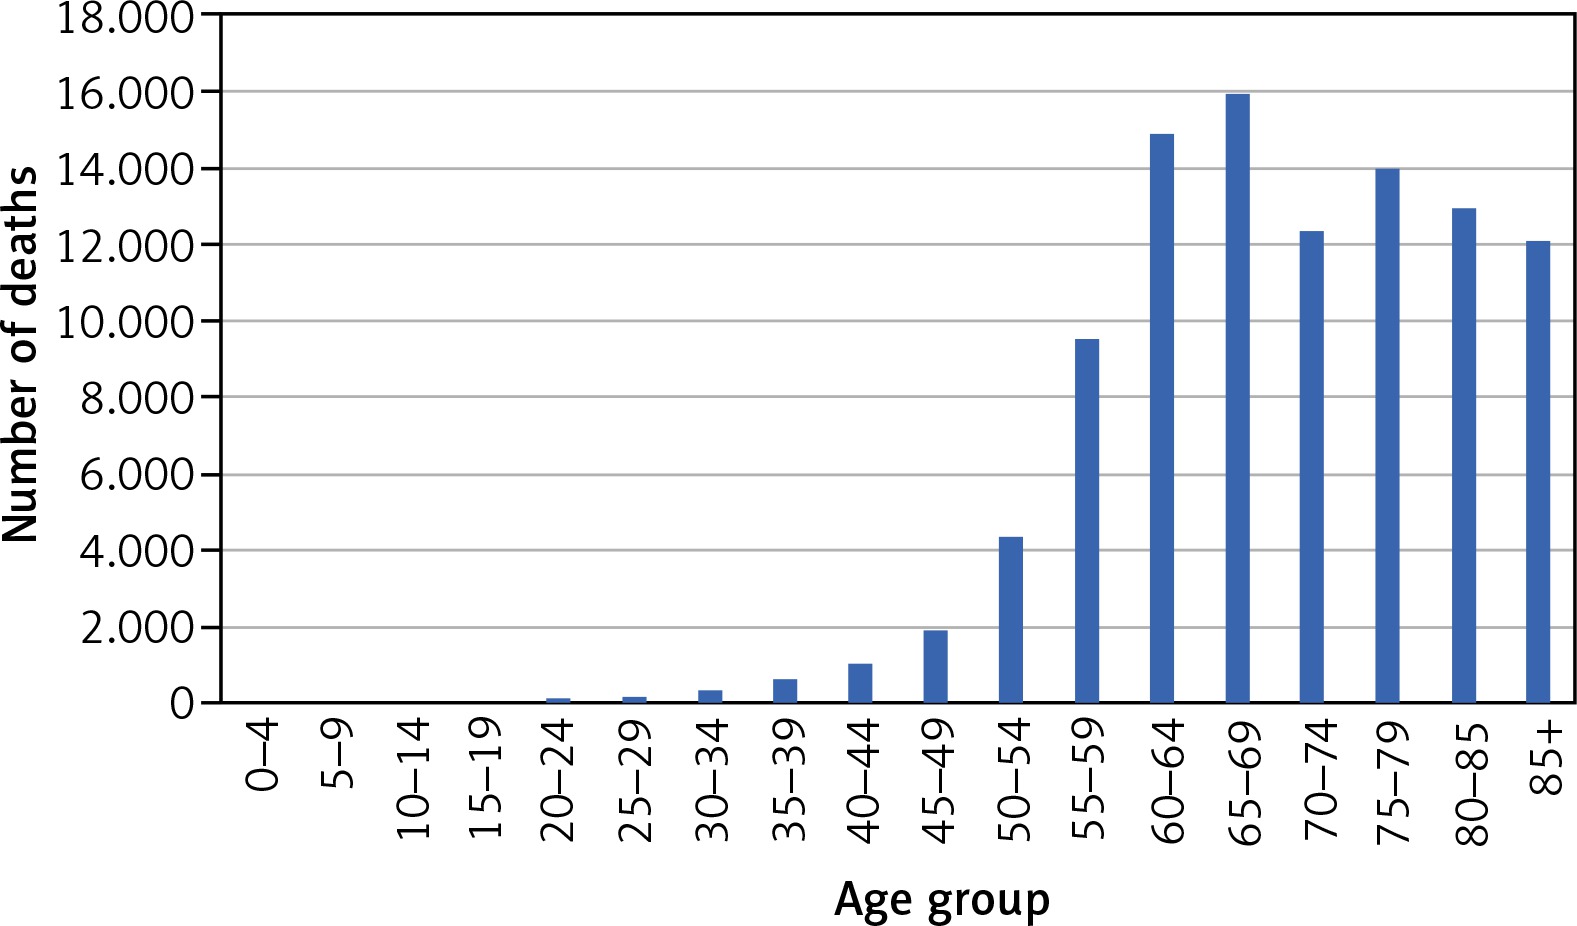
Out of the total number of deaths, 1.3% were among those aged 20–39 years, 16.8% were among those aged 40–59 years, 56.8% were among those aged 60–79 years, and 25% were among those aged 80 years and older. Lung and bronchial cancer caused the largest proportion of deaths, followed by colon, breast and stomach cancer (Table 1) but this ranking differs substantially in individual age groups. For the population aged 20–39 years, the leading cause of cancer death was malignant brain tumours (n = 166), followed closely by breast cancer (n = 154). For the population aged 40–59 years, the leading cause of cancer death was lung cancer (n = 4,220), followed by breast cancer (n = 1,437), stomach cancer (n = 896), colon cancer (n = 888), brain cancer (n = 740) and ovary cancer (n = 694). Among people aged 60–79 years the leading cause of cancer death was lung cancer (n = 15,959), followed by colon cancer (n = 4,529), breast cancer (n = 3,030), stomach cancer (n = 2,952) and pancreatic cancer (n = 2,913).
Table 1
Mean YPLL, YPLL percentage and mortality percentage in Poland in 2015 for 11 specific tumour sites. The relative difference between YPLL and mortality is given by the ratio % YPLL/% mortality. Sites are shown in order of this ratio and mean YPLL
Years of potential life lost
The total YPLL in 2015 was 1,990,457, with 23.6% from lung and bronchial cancer, 6.7% for colon cancer, 6.7% for breast cancer, 5.2% for stomach cancer, 4.9% for pancreatic cancer.
Mean YPLL was 19.79 years for all cancers, both sexes combined, and varies considerably by tumour site (Table 1). The cancers contributing to the highest mean YPLL were brain cancer (26.12), ovarian cancer (22.32), lung and bronchial cancer (20.93) and breast cancer (20.76). Prostate cancer has the lowest mean YPLL of 14.3 years.
Mortality versus other measures of cancer burden
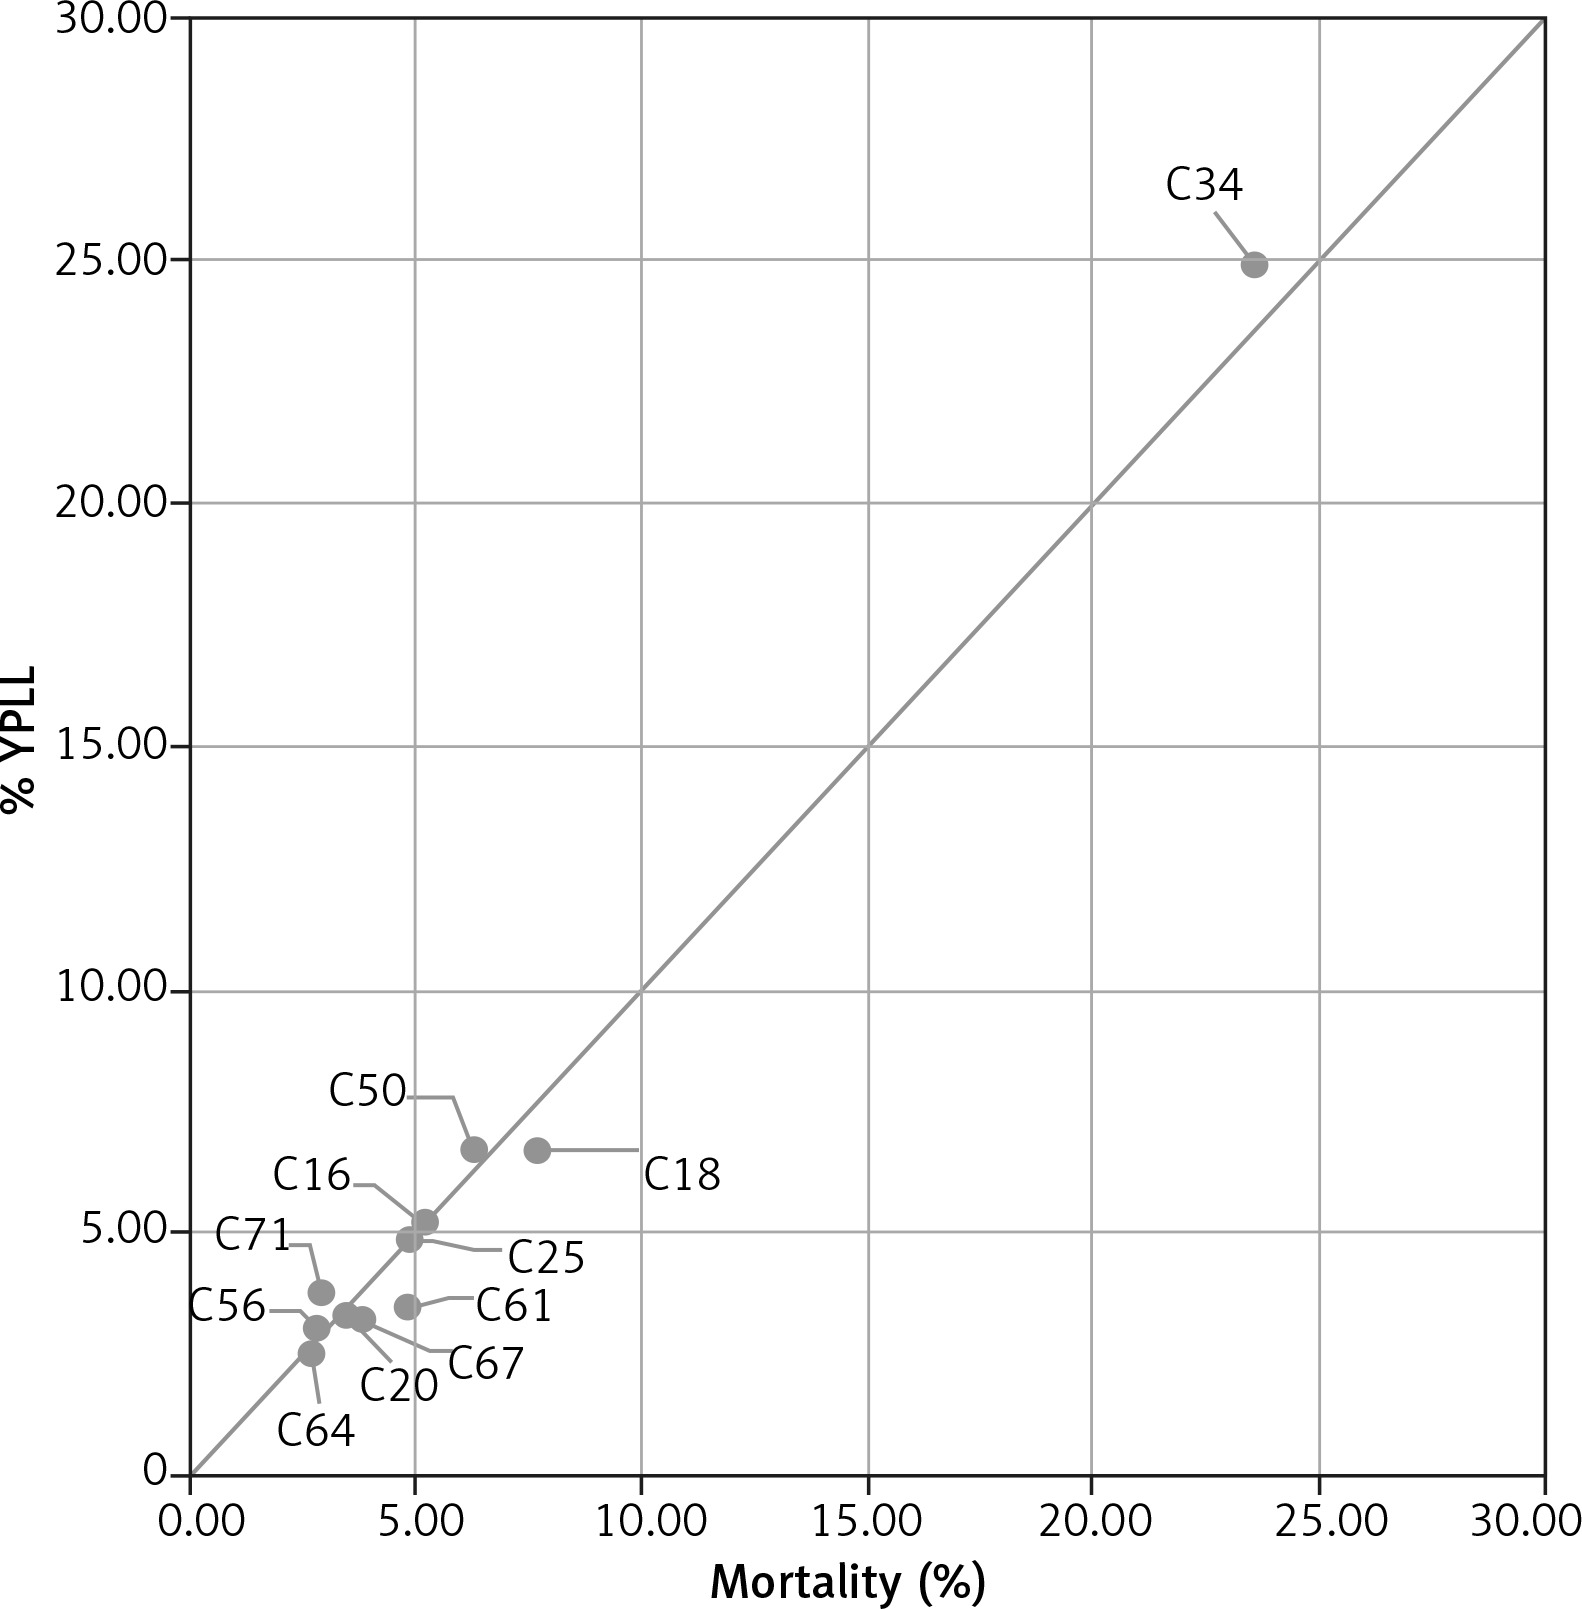
Figure 2 presents a simple plot of YPLL of each cancer expressed as a percentage of the total YPLL to cancers vs number of deaths (mortality) of each cancer as a percentage of the total number of deaths of cancer, for 11 cancer sites, both sexes combined. Cancers for which the population burden exceeds their simple mortality are shown above and to the left of the line of equity (x = y), while those below and to the right have higher mortality relative to YPLL. The positions of cancers of the brain, ovary, lung and bronchial and breast to the left of the line of equity indicate that the population burden from these cancers is rather higher than suggested by the mortality percentage. On the other hand, the population burden of prostate and bladder cancer is rather lower than expected. Pancreatic, stomach and kidney cancers are represented similarly by percentage and mortality percentage, so the YPLL (%)/mortality (%) ratio is close to unity (Table 1). The use of mean YPLL considerably changes the ranking of cancers. Table 1 shows the mean YPLL for tumour sites in order of descending mean YPLL and – for comparison – the YPLL percentage and mortality percentage for each site, for both sexes combined. Brain cancer is notable because of the highest mean YPLL of all 11 tumours sites but rather low (2.9%) mortality and 3.8% YPLL. With the mean YPLL of only 14.3 years, prostate cancer has a smaller impact on an individual patient than suggested by the mortality percentage and YPLL percentage. Of the eleven cancers contributing to the highest percentage of mortality, three (brain, ovarian and kidney cancer) are positioned higher according to mean YPLL than according to YPLL percentage and mortality percentage. Colon cancer is noteworthy because of the relatively high YPLL and mortality percentage, 6.7% and 7.7%, respectively (the second position in the ranking), whereas mean YPLL of approximately 17.28 indicates that the impact per patient is rather moderate (the ninth position in the ranking).
Discussion
Main finding of this study
We analysed three burden metrics for 11 different types of cancer in Poland. Our study revealed that for most cancer types the YPLL (%)/mortality (%) ratio is similar, but it ranged from 0.72 (prostate cancer) to 1.31 (brain cancer). The use of mean YPLL as an indicator of individual cancer burden considerably changes the ranking of the mortality from different tumours, especially brain, ovarian and prostate cancer. The highest mean YPLL applies to brain and ovarian cancers, which have the overall lowest age of death: 63 and 67.26 years, respectively. These numbers are lower than the mean age at death for prostate cancers (76.8), which have the lowest mean YPLL. Our results indicate that looking at measures such as mortality rates may not provide a complete picture of disease effect and the different mortality statistics used here may be useful in public health considerations of cancer burden.
What is already known on this topic
To our knowledge, such a detailed analysis using the GBD 2015 methodology has not been performed before in Poland. Our results correspond with findings from other countries, as previous works have also shown discrepancies between mortality rates and other measures of cancer burden [5–7, 10–14]. Other studies which have reported cancer-caused mean YPLL have found comparable but generally considerably lower mean YPLL estimates, e.g. the mean YPLL for brain cancer was 20.1 [5], 22 [6] and 19.93 [7], for ovarian cancer –16.3 [5], 17 [6] and 17.54 [7], for breast cancer – 13.5 [5], 16 [6] and 18.78 [7], for prostate cancer – 6.1 [5], 7.9 [6] and 9.64 [7]. These differences may be explained by numerous factors, including not only country-specific differences in age at diagnosis, in age at death and/or in total time after diagnosis, but also the time the analyses were performed, applying alternative reference life tables used previously in the GBD studies.
What this study adds
The use of mean YPLL to indicate the impact of a tumour type on individual patients considerably changes the ranking (e.g. ovarian, kidney, colon, lung and bronchial, stomach cancer), and two tumour sites (brain and prostate cancer) have a rather large difference among all three measures (mortality, YPLL and mean YPLL). YPLL shows that the population burden from cancers of the brain and ovary is more significant and the population burden from prostate, bladder and colon cancer is rather less significant than suggested by crude mortality rates. Similar conclusions can be drawn from the analysis of mean YPLL, but considering this measure provides a more sensitive estimation of the impact of cancer death due to less frequent cancers such as brain and ovarian cancer with mean YPLL of 26.12 and 22.32 years, respectively, while the mean YPLL for other cancers ranged from 14 to 21 years. Our study indicates that, although slightly more difficult to calculate than simple mortality percentage, YPLL and mean YPLL have added value in demonstrating the effect of individual tumour sites on both the whole population and individual patients, are complementary to routinely reported mortality statistics and may be useful in the debate on public health issues.
Limitations of this study
This study is subject to certain limitations. One of them may be the overall quality of death certificate data collected for analysis. However, it should be emphasized that the assessment of cancer mortality in Poland in 2015 was based on data obtained from death certificates collected by the Central Statistical Office. The mortality data are a fundamental source of demographic and cause of death information for the whole of Poland and therefore seem to be the most comprehensive and reliable source for this study. Disability-adjusted life years as well as quality-adjusted life years may provide information that complements the population-based metrics such as YPLL, but they are not calculated in the present study because of poor availability of detailed information about the period of disease before death.
Conclusions
Different indicators of cancer deaths show different aspects of mortality and are complementary. Our analysis suggests that considering YPLL and mean YPLL accentuates the effect of cancer on society and individual patients and may be useful in public health debate. YPLL and mean YPLL rates can assist in the performance of three basic public health functions: the establishment of research and resource priorities, the surveillance of temporal trends in premature mortality and the evaluation of the effectiveness of programme interventions. With certain limitations, YPLL and mean YPLL can serve these functions at a national, state, or local level. Addressing research efforts for prevention and/or treatment of the major causes of YPLL may result in a substantial impact on general life expectancy.


