
Introduction
Lung cancer is the leading cause of cancer-related deaths worldwide, with the majority of cases being non-small cell lung carcinomas [1]. The 8th TNM staging system is used to categorize non-small cell lung carcinoma for potential treatment options [2, 3]. If there are no medical and social contraindications, surgery is the most effective method for treating early-stage non-small cell lung cancer (NSCLC) [3]. For the rest of the group, locally advanced or widespread stages of the disease involve a single or combination of chemotherapy, immunotherapy, and/or radiotherapy; surgical treatment might be added for a very select subgroup of these [2, 4].
Patients undergoing thoracic surgery often inquire about the duration of the procedure, potential risks, expected hospital stay, and treatment success [5, 6]. Among these concerns, the length of hospital stay (LOS) is also a key consideration for healthcare providers, as it impacts resource utilization and planning [5, 6]. However, the literature lacks a standardized timeframe for LOS following NSCLC surgery, which varies based on patient characteristics, surgical approach, perioperative events, and institutional practices [5–8]. Prolonged LOS is associated with higher costs, increased risk of hospital-acquired infections, and greater social burden [7, 8]. Factors such as older age, comorbidities, reduced pulmonary function, neoadjuvant therapy, and open surgery contribute to extended stays [9–12]. Conversely, preoperative pulmonary rehabilitation and minimally invasive techniques such as video-assisted thoracic surgery (VATS) or robotic-assisted thoracic surgery (RATS) may reduce LOS and improve efficiency [11, 13, 14]. Predicting LOS preoperatively could enhance planning, resource management, and patient counseling.
Artificial intelligence (AI) mimics the way neurons in the human brain transmit and process signals, and deep learning (DL) – a subfield of AI – uses multi-layered neural networks to handle complex datasets [15–18]. These networks consist of input, hidden, and output layers, and learn through feedback mechanisms to minimize error and improve performance [15]. Typically, 80% of data are used for training and 20% for testing model accuracy [15]. In thoracic surgery, AI is increasingly applied in diagnostic radiology, pathology, robotic-assisted procedures, and drug development [17–21]. The integration of AI into clinical practice offers opportunities for improved precision, efficiency, and patient outcomes.
The FCNN (Fully Connected Neural Network) algorithm consists of multiple interconnected layers, where each neuron in a layer forms connections with every other neuron. These connections are established using the backpropagation principle [22, 23]. The algorithm’s objective is to rapidly acquire knowledge and sustain a minimal rate of mistakes, using an input layer, an output layer, and concealed intermediate layers [24–26]. The application of artificial intelligence and machine learning algorithms in the field of general health medicine has witnessed a notable rise, resulting in various benefits such as improved time management, enhanced patient comfort, facilitated teaching and learning, and reduced costs [27].
Aim
This study aimed to develop a deep learning model using FCNN architecture to predict whether the postoperative hospital stay of NSCLC patients undergoing thoracic surgery would be ≤ 9 days or > 9 days. By leveraging clinical and perioperative data, our goal was to contribute a practical tool to anticipate hospital stay duration and potentially enhance perioperative planning.
Material and methods
The study received approval from the local ethics committee of our institution (Ethics committee number: 22.06.2022; 83045809-604.01.01-415691) after undergoing the necessary ethical review process. After receiving approval from the ethics committee, we conducted a retrospective compilation of the data. The data were collected from the patient’s medical files and the hospital database.
The study included patients who underwent lung resection and systematic lymph node dissection for NSCLC at our clinic between 2001 and 2023. During this period, our basic and fundamental medical and surgical approaches did not undergo any radical changes. The same groups and the new members adapted to them were in charge of the patients. Therefore, potential new modalities in the surgical and postoperative care were incorporated into the service and reflected as normal real-life data. However, we added data on these topics as input data to optimize surgical and postoperative care changes that occurred in the current time period. The study excluded patients with data that could not be accessed or had missing information. A total of 953 patients were enrolled in the study. This number is valuable for learning and processing artificial intelligence technology.
While selecting the data, the data that directly and indirectly affected the length of hospital stay were selected. The algorithm, which included a feedforward and backpropagation method, optimized the direct and indirect effects of the data on the analysis. The feedforward and backpropagation method provided the optimization of the weight and bias values of each data point. We collected the patients’ demographics and the clinical data, comprising various factors; these were defined as input data for each patient. Subgroups included potential comorbidities and risk factors such as chronic obstructive pulmonary disease (COPD), hypertension, diabetes mellitus, infectious diseases (e.g. tuberculosis), additional malignancy, hemoptysis, excessive sputum, neoadjuvant treatment, smoking (pack-years), cardiac risk index score, pulmonary risk index score, Charlson comorbidity risk index score, and body mass index.
The following respiratory parameters were observed: forced vital capacity (FVC), percentage of FVC (%FVC), forced expiratory volume in one second (FEV1), percentage of FEV1 (%FEV1), FEV1/FVC ratio, diffusing capacity of the lungs for carbon monoxide (DLCO), percentage of DLCO (%DLCO), DLCO/VA ratio, partial pressure of oxygen (PO2), and partial pressure of carbon dioxide (PCO2). The laboratory analysis showed measurements for hemoglobin, albumin, C-reactive protein, lactate dehydrogenase, leukocyte count, lymphocyte count, monocyte count, and neutrophil count. The positron emission tomography (PET)/computed tomography (CT) procedure involved measuring the highest level of FDG uptake in both the lymph node and tumor, which were represented by the lymph node SUVmax and tumor SUVmax values, respectively.
Data regarding the tumor’s anatomical position, the specific side of the lesion, the surgical technique employed (such as lobectomy, bilobectomy, pneumonectomy, wedge resection, or segmentectomy), as well as the approach used for the surgical incision (either open surgery through thoracotomy or minimally invasive techniques).
The data for tumor pathology included information on tumor cell type, diameter at the longest line, N lymph node involvement status (N0, N1, N2), and TNM stage. The outcome data consisted of postoperative hospital stay days. The outcome variable was the number of postoperative hospital stay days. A cutoff value of 9 days was used to evaluate hospital stay duration. This threshold was selected because the 75th percentile of hospital stay in our clinic was 9 days. Although the mean length of stay was 7.3 days, it was not chosen as the cutoff due to the wide standard deviation of 5.4 days. Therefore, based on our institutional data, a postoperative stay of 9 days or longer was considered clinically significant.
Mean values, standard deviations, and ratios were computed as statistical measures. The SPSS 27.00 (IBM, Armonk, NY, United States) program was used in statistical analyses. The performance of deep learning algorithms was assessed by measuring specificity, sensitivity (recall), negative predictive value, positive predictive value (precision), accuracy, and F1 score. Among these, the F1 score – the harmonic mean of sensitivity and precision – was used as the main indicator of overall model performance. This score provides a more balanced and reliable assessment of model success, especially in datasets with class imbalance. The F1 score provides a more accurate representation of the analysis’s success than accuracy, specificity, sensitivity, positive predictive value, and negative predictive value alone. The F1 average score, which is the average of the F1 1 and F1 0 data, shows the joint success of the model for hypotheses H1 and H0.
The model was trained to classify hospital stays as ≤ 9 days (Output 1) or > 9 days (Output 0). The F1 1 value represents the model’s success in predicting stays of 9 days or less, while the F1 0 value reflects its performance in predicting stays longer than 9 days. The average F1 score (mean of F1 1 and F1 0) was used as a general measure of model performance across both groups.
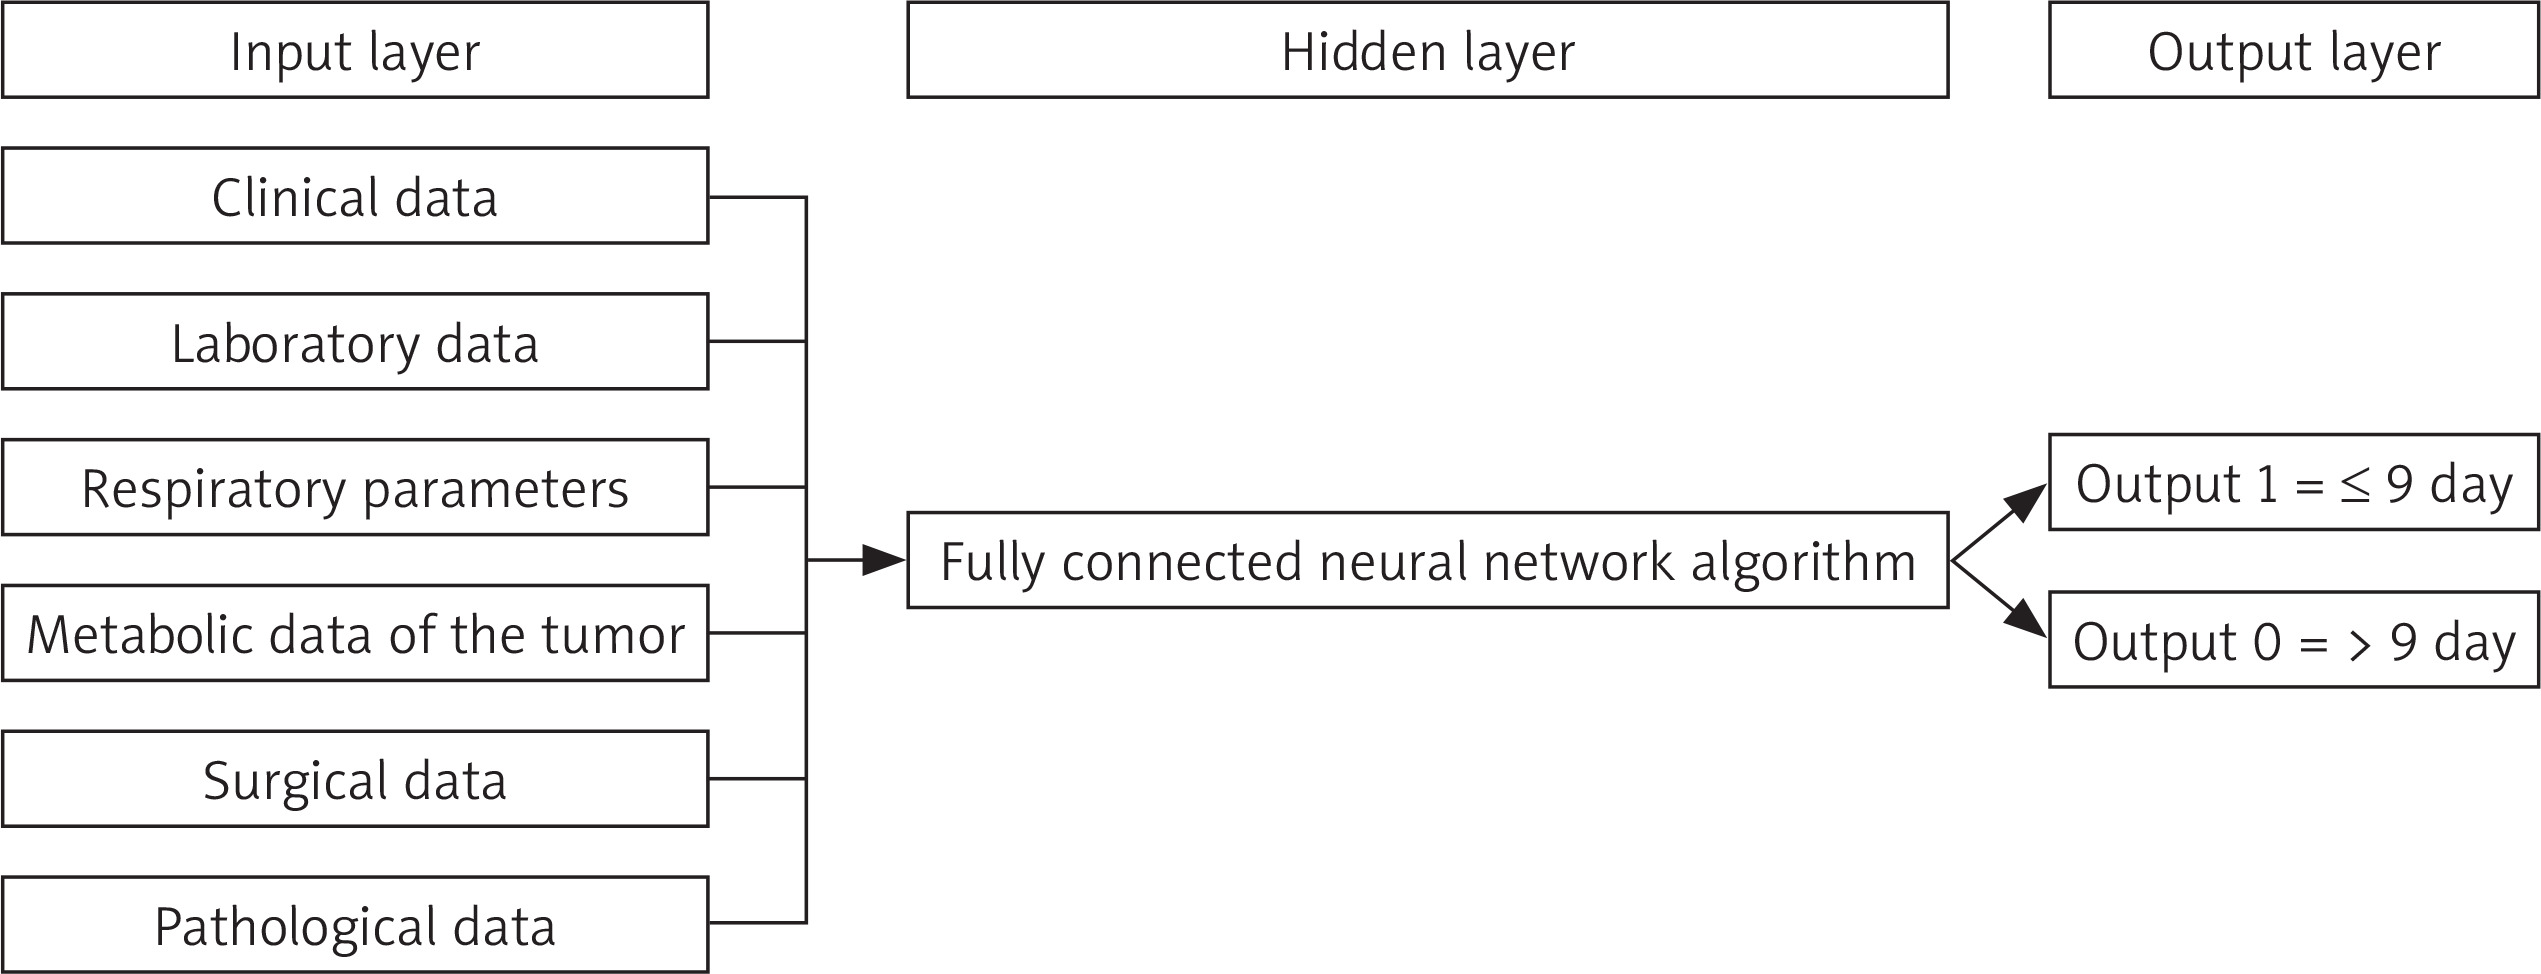
The F1 average value was calculated as the mean of the F1 1 and F1 0 values. It represented the data on hospital stay days with the highest level of optimization. The performance of deep learning algorithms was assessed using the area under the curve on the ROC curve. Artificial intelligence applications were implemented using Python (Python 3.8.2, Van Rossum G, Drake Jr FL, Amsterdam, Holland). The Python application employed the FCNN algorithm, and k-fold cross validation (k = 10 fold) was employed to reduce randomness. 90% of the data were allocated for training purposes, while the remaining 10% were used for testing. The training of our model was performed with 90% of the existing data, and then the model was tested with 10% of the data that the model had never known before, and the success of the model was evaluated. The main purpose of choosing the FCNN algorithm was to establish connections between all layers in cases with complex and multiple data inputs, and to achieve more successful results by using forward and feedback methods (Figure 1).
Figure 1
The algorithm of a neural network with complete interconnections. The input data consist of clinical data, laboratory data, respiratory parameters, and tumor characteristics for every patient. Forward and feedback connections establish links between the intermediate layers. Consequently, the level of achievement in learning improves. The final layer comprises the output data. The quantity of intermediate layers and neurons fluctuates based on the specific attributes of the problem and the data
Results
There were 953 patients who received surgical treatment at our clinic for non-small cell lung carcinoma between 2001 and 2023; their average age was 61.3 ±9.8 years. Table I shows that 80.5% of the patients were male, which corresponds to 767 patients, while 19.5% were female, totaling 186 patients. The average duration of postoperative hospitalization was 7.3 days, with a standard deviation of ±5.4. The 25th percentile is 4 days, the 50th percentile is 6 days, and the 75th percentile is 9 days (Figure 2). The critical value for our study was determined to be 9 days, which corresponds to the 75th percentile.
Table I
Demographic information of patients. Data are provided as mean ± standard deviation, or number and percentage
| Parameter | Results |
|---|---|
| Age | 61.3 ±9.8 |
| Sex | |
| Male | 767 (80.5%) |
| Female | 186 (19.5%) |
Figure 2
Histogram illustrating the duration of hospitalization for patients following surgery. The average length of postoperative hospitalization is 7.3 days, with a standard deviation of 5.4 days. The 25th percentile is 4 days, the median is 6 days, and the 75th percentile is 9 days. The data are based on a sample size of n patients
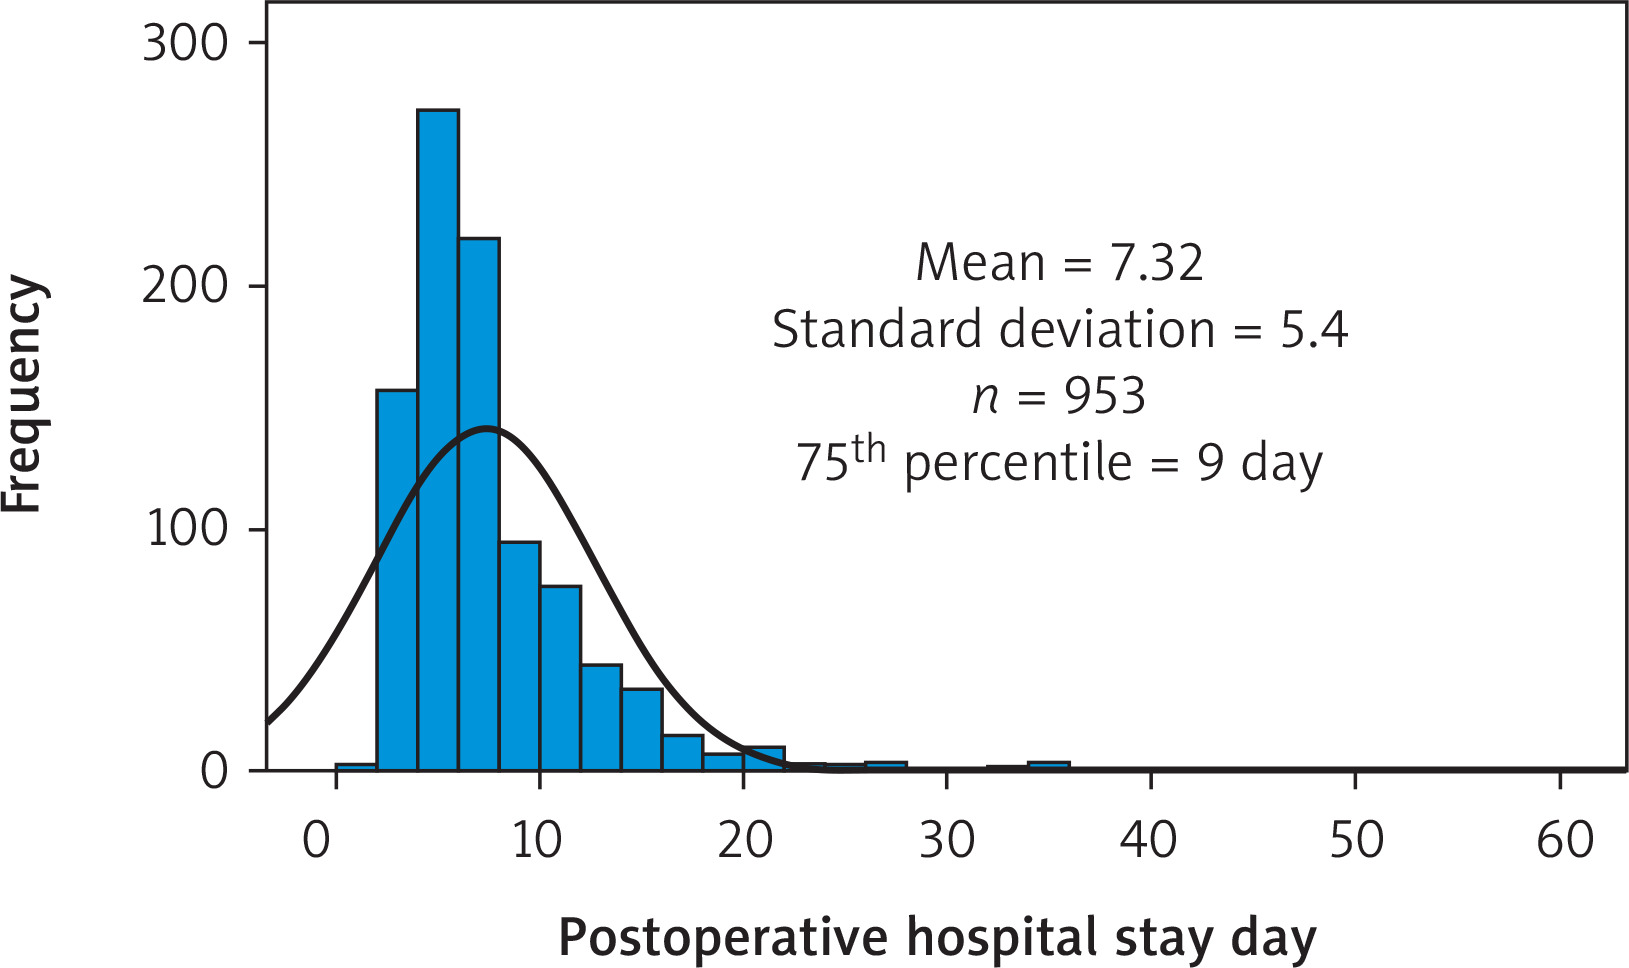
Table II contains the data obtained from the deep learning model developed using the FCNN architecture and k-fold cross-validation. This model aims to predict whether the postoperative hospital stay for patients who underwent surgery for NSCLC is shorter or longer than 9 days. The iteration step with the highest F1 mean value on the test data was selected as the point of maximum success for the algorithm. The highest mean value of the F1 test was determined at the 9900th step.
Table II
Data analysis results of the model, created using the FCNN algorithm and k-fold cross validation, for predicting postoperative hospital stays for 9 days. These results are based on the 9900th repetition point, where the test F1 average value is the highest for the model
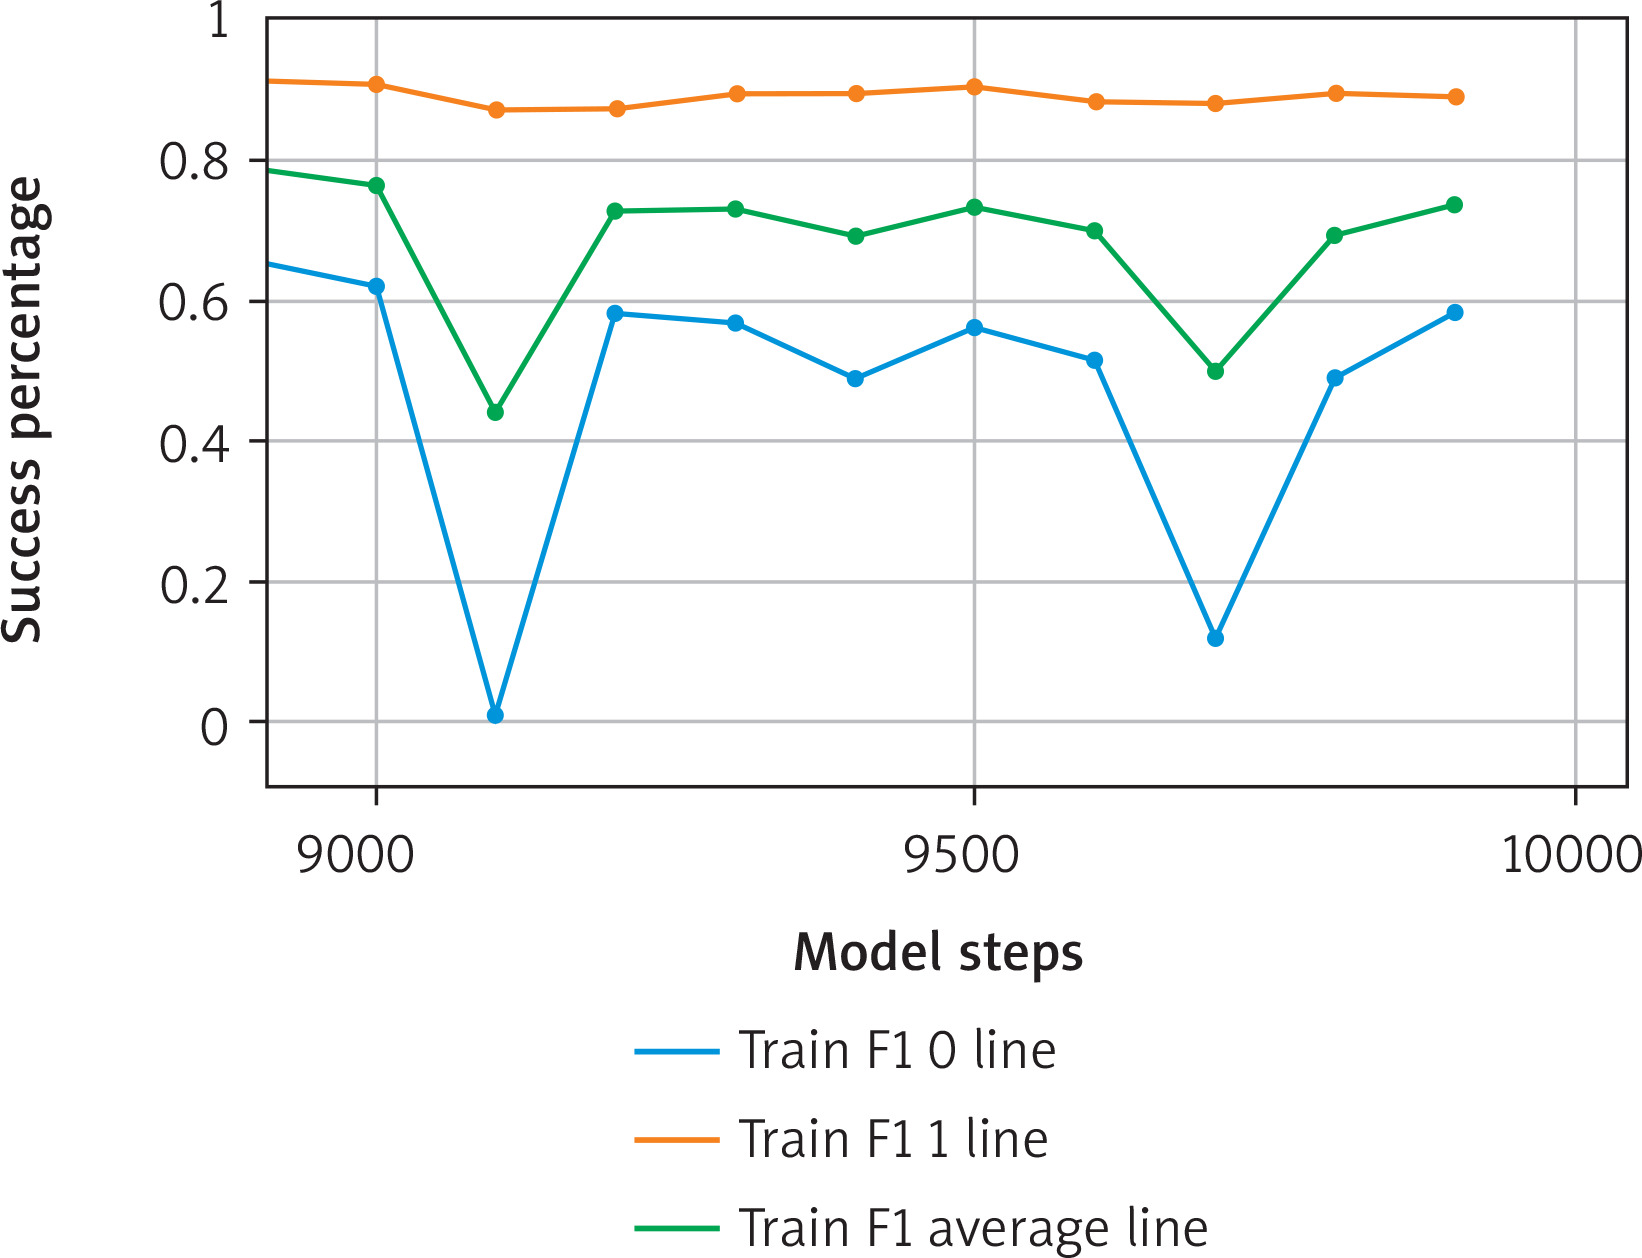
The evaluation of the algorithm on the training data yielded the following metrics: sensitivity (recall) was 90.3%, positive predictive value (PPV) was 87.8%, and accuracy was 82.6% (Figure 3). Detailed F1 scores showed an F1 1 score of 89.0%, an F1 0 of 58.3%, and an average F1 score of 73.6% (Figure 4).
Figure 3
Graphical representation of accuracy, positive predictive value, and sensitivity values for the training data of the model created for postoperative hospital stay for 9 days prediction with the FCNN algorithm and k-fold cross validation. Values for the 9900th step, where the maximum value for the test F1 average score was determined, are given: training accuracy 82.6%, training positive predictive value 87.8%, training sensitivity value 90.3%
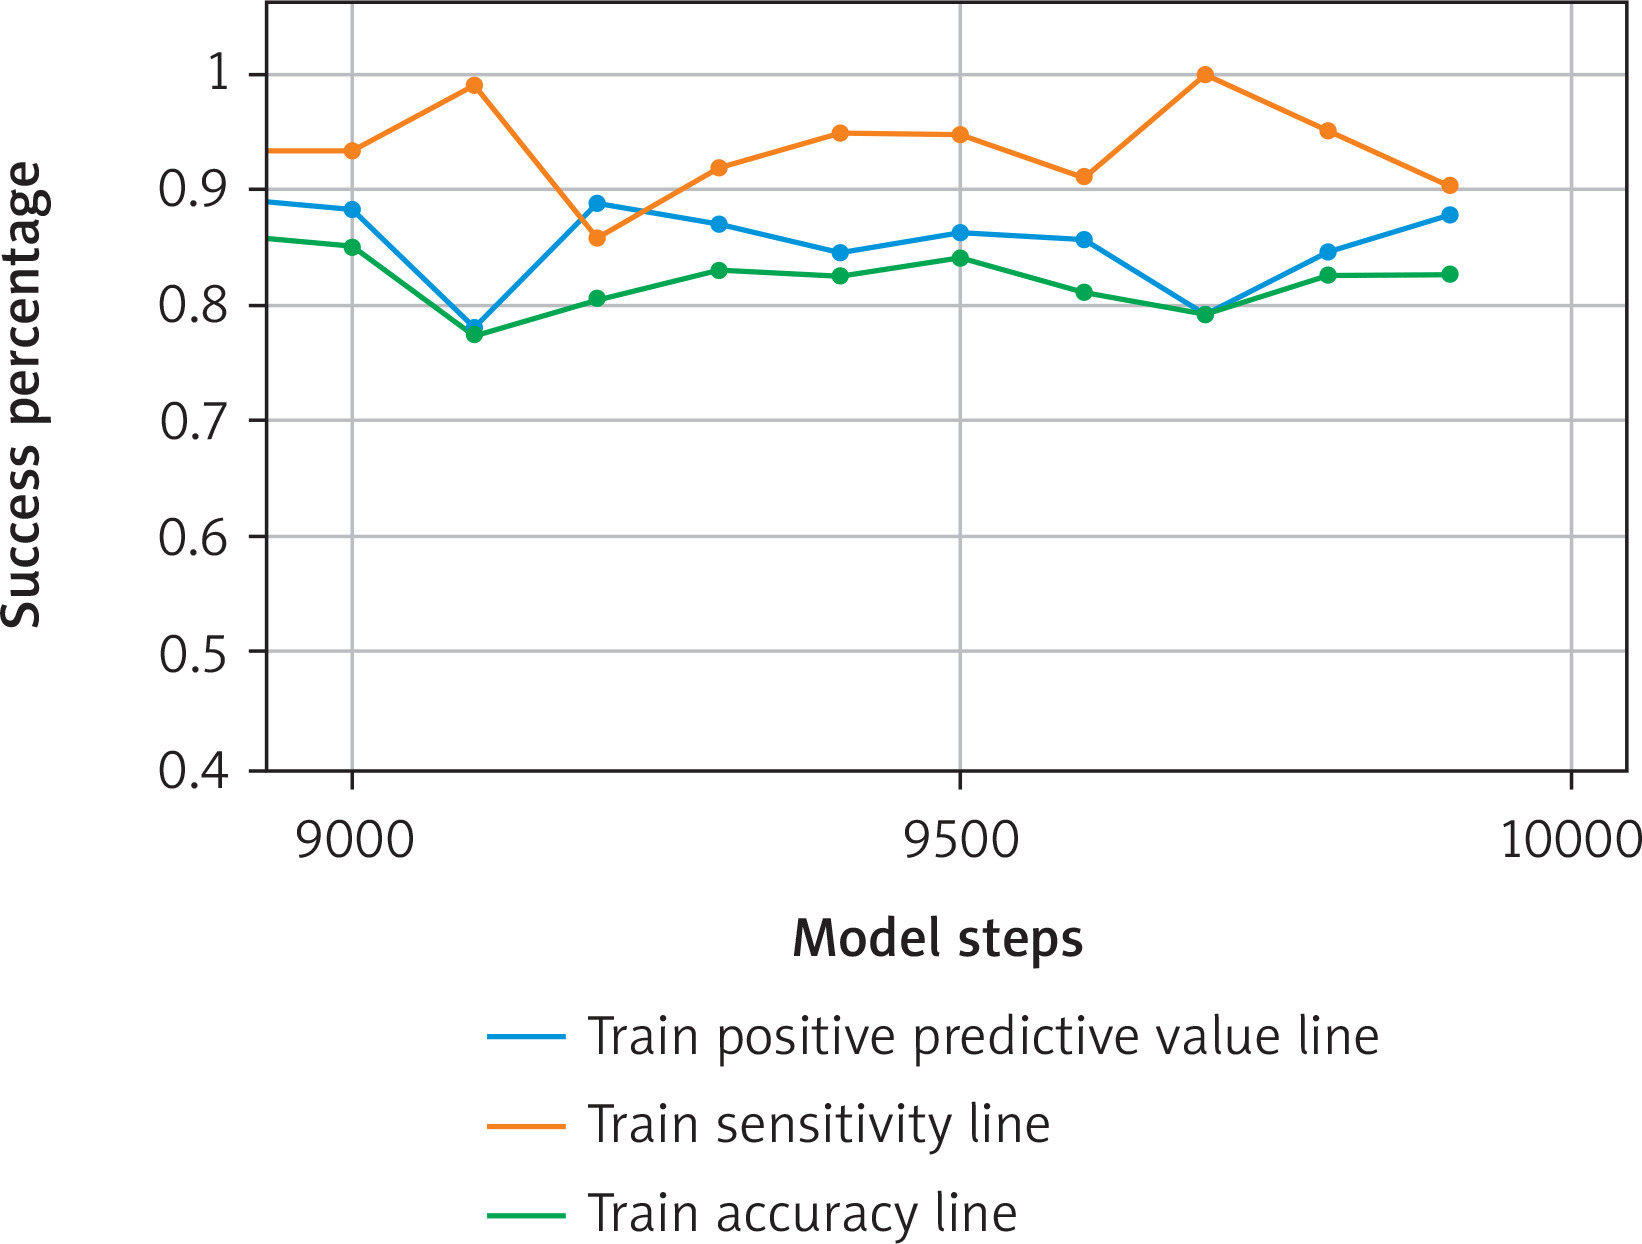
Figure 4
Graphical representation of F1 1, F1 0, and F1 average values for the training data of the model created for postoperative hospital stay for 9 days prediction with the FCNN algorithm and k-fold cross validation. Values for the 9900th step, where the maximum value for the test F1 average score was determined, are given: training F1 1 value 89.0%, training F1 0 value 58.3%, training F1 average value 73.6%
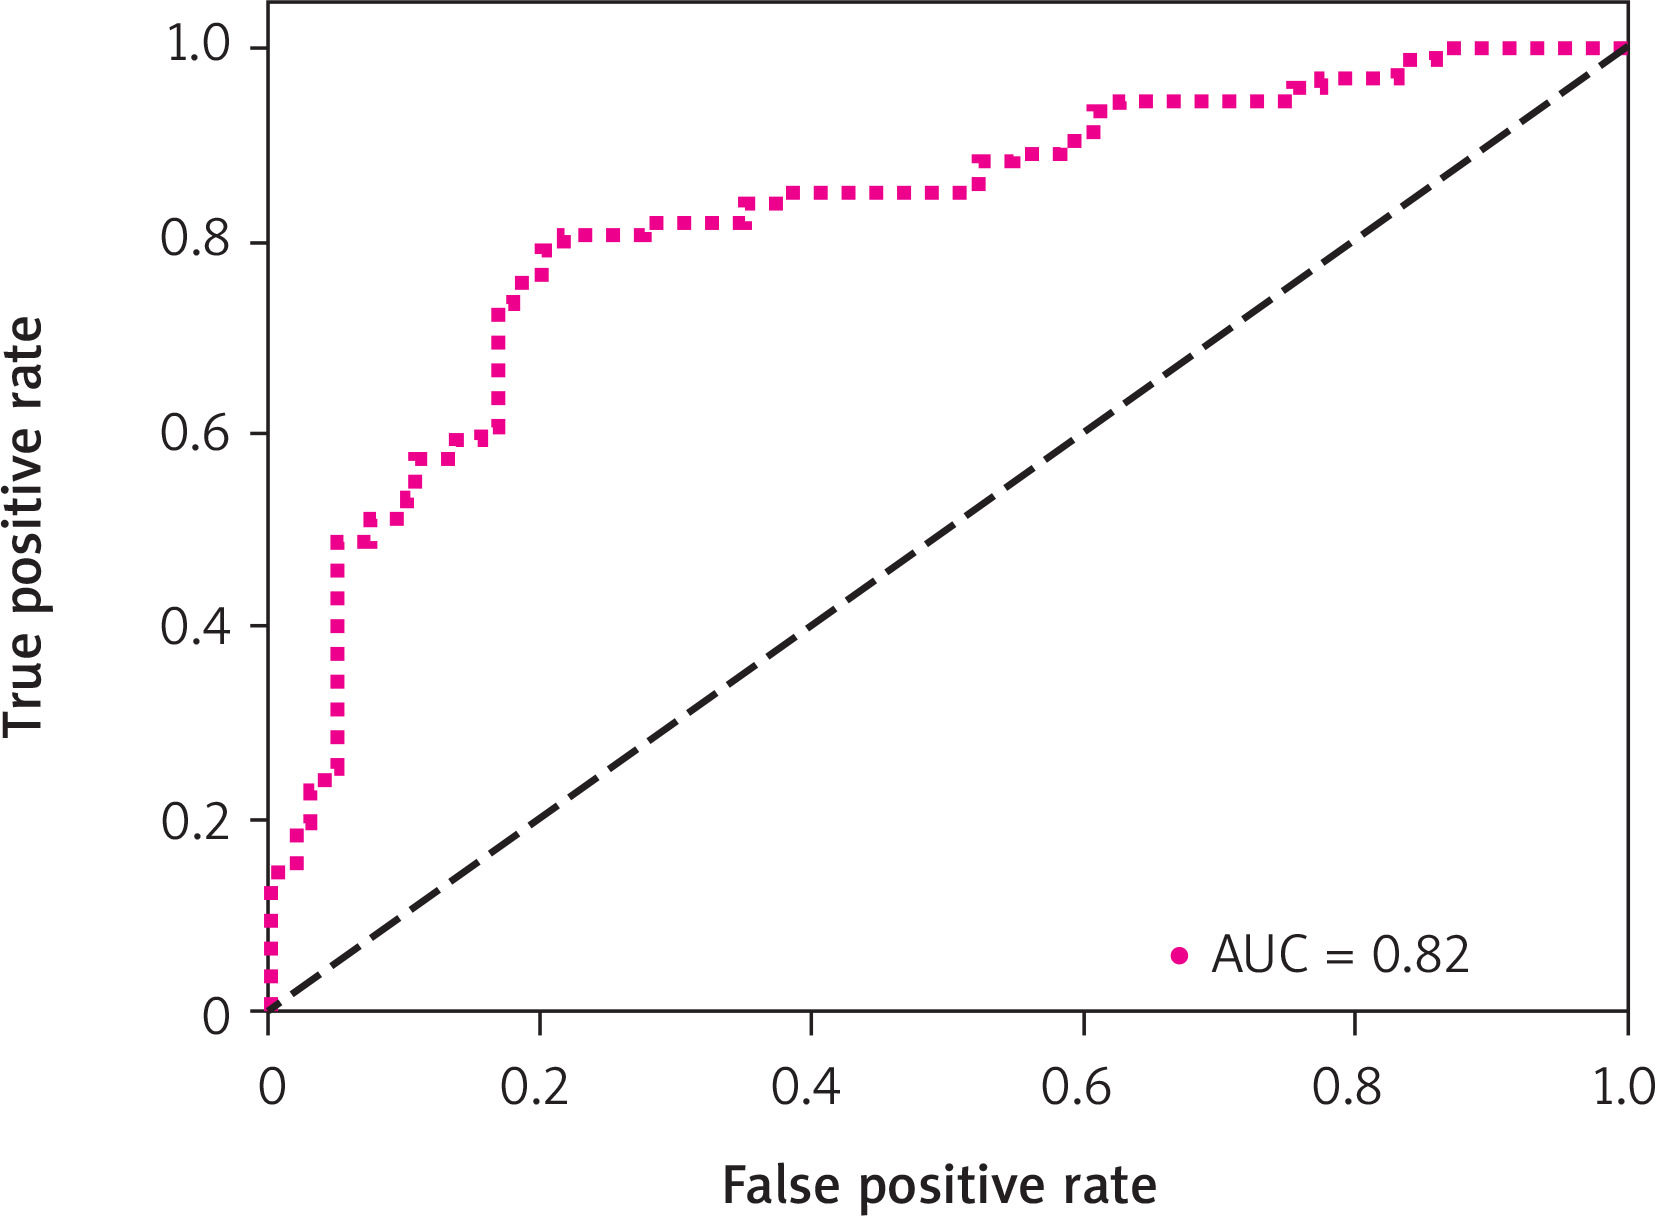
For the test data, the sensitivity was 83.8%, the positive predictive value was 88.6%, and the accuracy was 78.7% (Figure 5). The F1 1 score was 86.1%, the F1 0 score was 54.5%, and the average F1 score was 70.3% (Figure 6). Additionally, the ROC curve generated for the test data had an area under the curve (AUC) of 0.82, indicating a favorable overall performance of the algorithm (Figure 7).
Figure 5
Graphical representation of the accuracy, positive predictive value, and sensitivity values for the test data of the model created for postoperative hospital stay for 9 days prediction with the FCNN algorithm and k-fold cross validation. Values for the 9900th step, where the maximum value for the test F1 average score was determined, are given: test accuracy value 78.7%, test positive predictive value 88.6%, test sensitivity value 83.8%
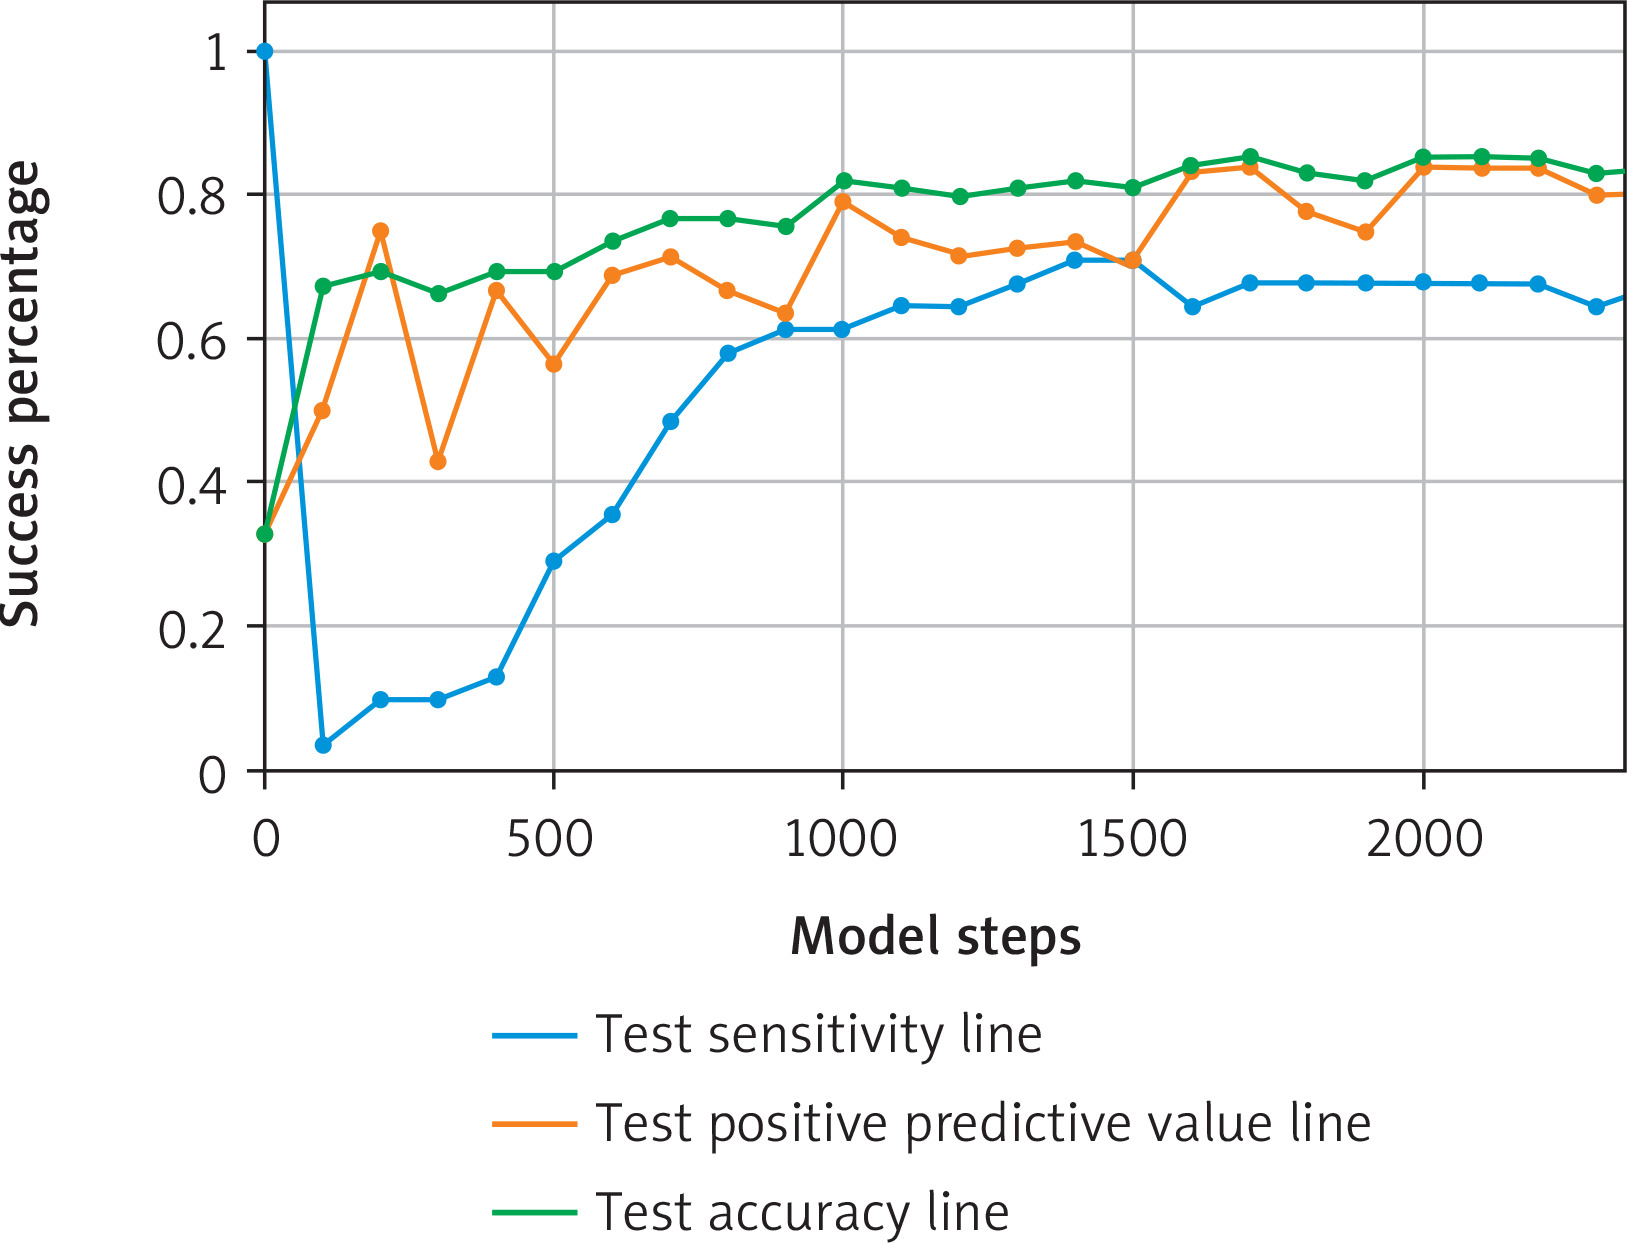
Figure 6
Graphical representation of F1 1, F1 0, and F1 mean values for the test data of the model created for postoperative hospital stay for 9 days prediction with the FCNN algorithm and k-fold cross validation. Values for the 9900th step, where the maximum value was determined for the test F1 average score, are given: test F1 1 value 86.1%, test F1 0 value 54.5%, test F1 average value 70.3%
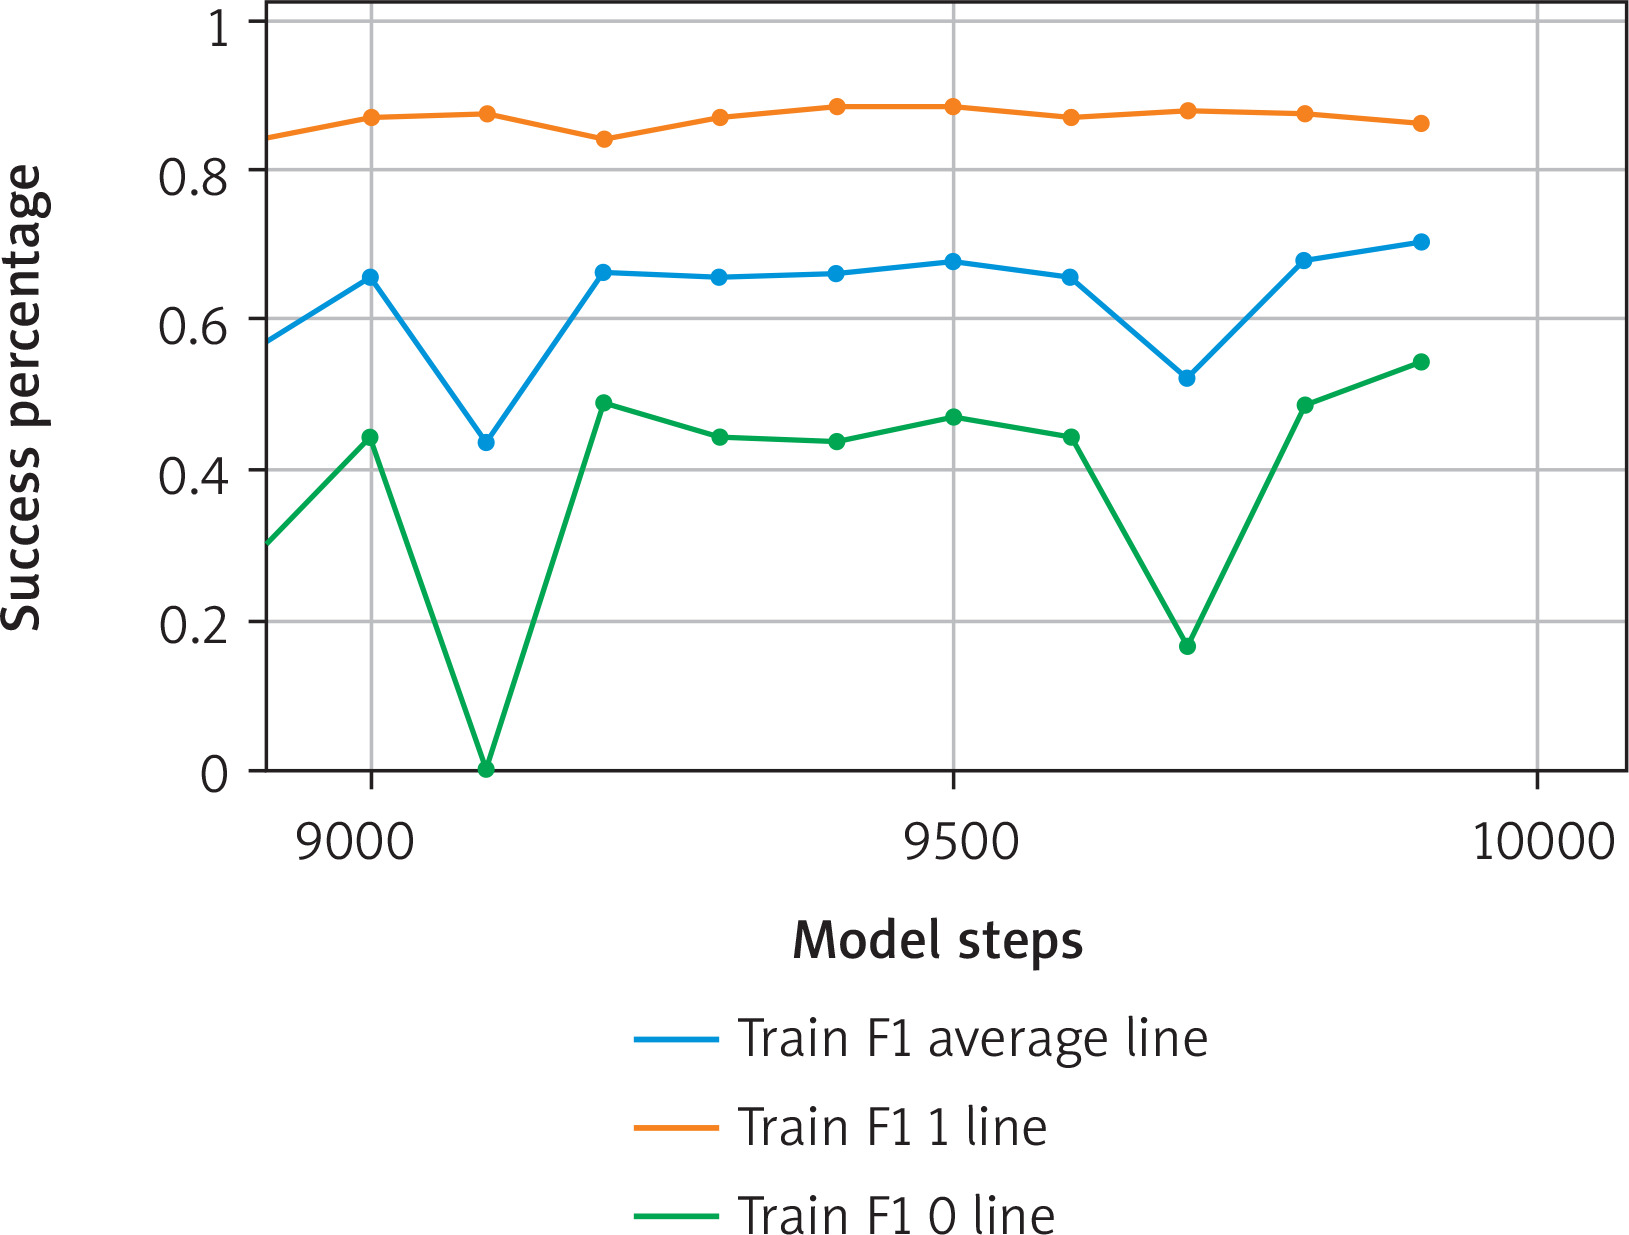
Figure 7
Evaluation of the success of the model created for 9 days prediction with the FCNN algorithm and k-fold cross validation with the ROC curve (AUC = 0.82)
The fact that the model’s training data are more successful than the test data and that the model graphs progress in parallel to each other shows that the model is far from random. Examining the model’s graphs reveals that the training and test data do not increase towards infinity, and once they demonstrate a specific training and test success, they approximate the same situation, leading to its evaluation as a model that avoids overfitting and memorization.
Discussion
Estimation of time for postoperative hospitalization in patients undergoing lung resection for NSCLC is becoming more important in the medical, social, and economic eras. The duration of hospitalization following NSCLC surgery varies across different medical practitioners, clinics, and hospitals [5, 6]. Prolonged hospital stay is related to hospital-acquired infection rates, medical costs, and less effective use of resources [7, 8]. Consequently, any tool supporting accurate predictions would also help to prevent potential risks. Artificial intelligence and machine learning software and applications are being increasingly used in medicine to assist physicians in delivering healthcare services to support decision-making [15].
As we have hypothesized 9 days as the cutoff point for prolonged hospital stay, the deep learning algorithm we developed achieved an accuracy of 78.7% in predicting whether the postoperative hospital stay would be shorter or longer than 9 days in the test data. The F1 mean value was 70.3%, and the area under the ROC curve was 82%, indicating that the model made highly accurate and successful predictions.
For patients whose hospital stay is accurately predicted, it is important to increase attention to the preoperative period and implement necessary movement precautions to avoid potential complications [28]. During the postoperative period, it is crucial to identify the specific factors that contribute to an extended hospital stay for each patient and behave conservatively to bypass these factors [28].
Using artificial intelligence algorithms to estimate hospital stays will allow clinical teams to offer more evidence-based information to patients and their families, while also ensuring that patients are well informed about the circumstances they will encounter during the postoperative period. On the hospital management side, the turnover rate of beds will be predicted more scientifically. The artificial intelligence model primarily contributes to clinical practice by identifying patients estimated to be at high risk for prolonged hospitalization, thereby allowing greater caution during the preoperative, intraoperative and early postoperative periods. This motivates the clinical teams to pay attention to precautions to prevent potential complications [23, 24]. The model improves postoperative care and prevents prolonged hospitalization in the group at high risk for long hospital stays [23, 24]. In the future, deep learning algorithms will probably be more effective as a decision support system by concurrently evaluating the predictions made by physicians regarding hospital stays with the predictions made by the artificial intelligence algorithm with increased achievement and heightened confidence in the data.
When considering the constraints of our study, it is worth noting that the sample size of patient data is limited. The primary challenge in the field of artificial intelligence research in healthcare is the scarcity of patients [22, 23]. A total of 953 patients were enrolled in our study. The current patient population is adequate for achieving high values of success in the algorithm’s learning and testing. However, increasing the number of patients can further enhance the algorithm’s performance. The success and reliability of artificial intelligence predictions increase with the amount of input data, but having any clean data is helpful. It is always possible to create successful models with clean and well-organized data. Based on the average F1 value of the model, we consider the data sufficient to test the H0 and H1 hypotheses; increasing the number of data will increase the success of the model. In the context of single-center artificial intelligence applications, algorithms are developed using the knowledge and decision-making processes specific to that particular clinic. Nevertheless, as demonstrated in our study, the generalizability to other clinics is enhanced when the dataset encompasses a significant number of years and involves multiple physicians practicing at a single center.
Conclusions
Machine and deep learning algorithms are promising candidates for a decision support system. In addition to their experience and medical knowledge, physicians will use these sources to make more successful predictions for postoperative hospitalization. This would provide them with patient-specific information and risk analysis regarding the postoperative period. This risk assessment would guide the whole medical team in paying more attention to the preparation and management of preoperative, perioperative, and postoperative steps. Additionally, this would inform patients and their families about the forthcoming postoperative period. For hospital management systems, this information helps to run the operating room, ward, and intensive care units with the combined sources more effectively, thus helping to utilize resources and medical services sustainably.