
Introduction
Cancer-associated malnutrition (CAM) can result from the local activity of a tumor, the host response to the tumor, and anticancer therapies [1]. Inflammation plays a crucial role in the development and progression of various malignant tumors [2]. Malnutrition is present with the diagnosis of cancer in about 15–40% of cases, and this incidence increases during treatment, characterizing 40–80% of the patients in this phase [3]. The prevalence of CAM varies between cancer types. In a study by Baracos et al., the risk of developing cachexia was assessed for different types of primary tumors. The results showed that the risk was highest for gastrointestinal (GI) tumors (80.4%), followed by head and neck tumors (H and N) (57.3%) and lung tumors (55.9%). The risk was lower for leukemia or lymphoma (32.5%), breast (9.1%) and prostate (4.8%) tumors [4]. Nutritional status closely relates to carcinogenesis, cancer growth, tumor progression, and prognosis [5]. Malnutrition can lead to impaired immune functions, increasing the risk of infections, sarcopenia, deterioration in performance status and quality of life, higher costs of medical care, morbidity and mortality [6].
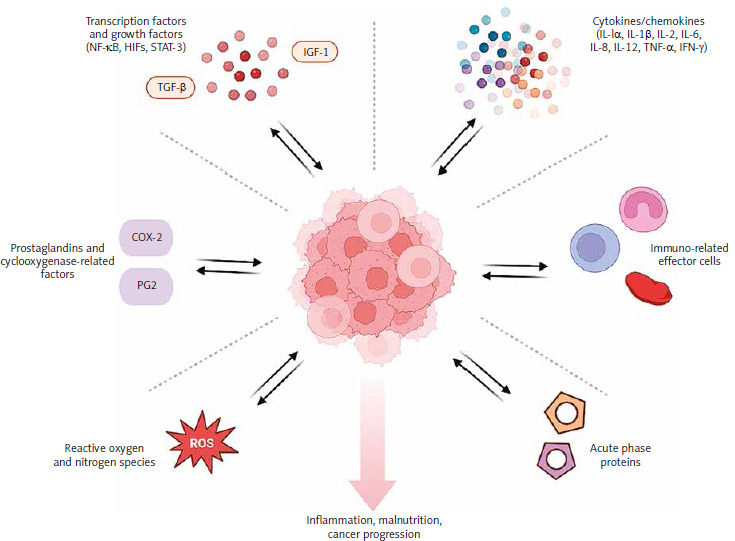
Systemic inflammation is a significant interaction between the body and cancerous tumors, which can contribute to the development of malnutrition. Based on the Global Leadership Initiative on Malnutrition criteria, cancer is considered an inflammatory disease, and the presence of inflammation is one of the criteria for diagnosing malnutrition [7]. Across the literature, many inflammatory biomarkers that establish a link between inflammation and malnutrition or inflammation and cancer progression have been identified. There are several classes of inflammation-related biomarkers that are most recognizable: cytokines/chemokines, immune-related effector cells, acute phase proteins, reactive oxygen and nitrogen species, prostaglandins and cyclooxygenase-2-related factors, and mediators such as transcription factors and growth factors (NF-κB, HIFs, STAT-3) [8] (Fig. 1). Cytokines are molecules that play a crucial role in regulating inflammation. They are responsible for attracting and activating immune cells such as neutrophils, macrophages, and lymphocytes. However, cytokines can have both pro-inflammatory (IL-1α, IL-1β, IL-2, IL-6, IL-8, IL-12, TNF-α, IFN-γ) and anti-inflammatory effects (IL-4, IL-5, IL-10, and TGF-β) [9, 10]. The measurement of cytokines is challenging due to their short half-life and dynamic response to injury. The group of immune-related effector cells comprises the entire population of white blood cells, including neutrophils, basophils, eosinophils, monocytes, macrophages, dendritic cells, lymphocytes (B and T cells), and platelets. These different types of blood cells play a multifaceted role in either increasing or decreasing inflammation [11, 12]. They are easy to measure and, unlike flow cytometry, which can quantify phenotypic subsets of immune cells, are not expensive. However, cytometry is not a standardized method and is not widely accessible. Albumins, C-reactive protein (CRP) and serum amyloid A represent acute-phase proteins. Decreased concentration of albumins and increased CRP correlate directly with active inflammation and a higher risk of cancer progression [13, 14].
Based on these principles, using counts of immune-related effector cells and concentrations of acute phase proteins, several equations and ratios were created, widely called inflammatory-related biomarkers or inflammatory indices. Inflammatory biomarkers such as the neutrophil-to-lymphocyte ratio (NLR) [15], lymphocyte-to-monocyte ratio (LMR) [16], platelet-to-lymphocyte ratio (PLR) [17], Glasgow prognostic score (GPS) [18, 19], lymphocyte-CRP ratio (LCR) [20], CRP-to-albumin ratio (CAR) [21], systemic inflammation score (SIS) [22], inflammatory burden index (IBI) [23], and prognostic nutritional index (PNI) [24] can be useful for predicting cancer prognosis. It is crucial to keep in mind that specific biomarkers reliant on immune cells, such as neutrophils, platelets, and monocytes, along with CRP, may increase while the biomarkers dependent on albumin and lymphocytes may decrease in association with cancer progression, as presented in Figure 2. Being aware of these changes could help identify the progression of cancer early on and potentially aid in devising a treatment plan. It is important to consider the type of cancer when interpreting inflammatory biomarker values. Specific biomarker results may vary depending on the cancer diagnosis, stage, and treatment.
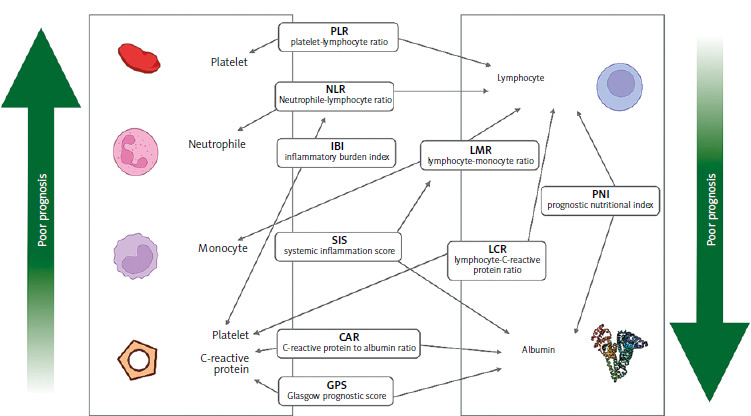
Higher values of biomarkers (PLR, NLR, CAR, IBI, SIS, GPS) indicate higher risk of an unfavorable prognosis. Lower values of LMR, PNI, LCR, lymphocytes, and albumin suggest higher risk of poor prognosis.
Numerous studies have investigated the association between inflammatory biomarkers and cancer prognosis, which could help in the classification of patients for certain oncological treatments. However, there is limited information on the link between inflammatory biomarkers and the severity of malnutrition in cancer patients, despite them being among the criteria for the diagnosis of malnutrition. Our analysis aimed to demonstrate this association by examining immune-related cells, acute phase protein levels and parameters related to weight loss and fulfillment of daily protein and energy requirements. We then attempted to correlate the inflammatory biomarkers (PNI, NLR, and PLR) with nutritional status and dietary intake. Finally, we interpreted our findings in the relation to the risk of cancer dissemination for four patient groups: colorectal, upper GI, head and neck, and gynecological cancer patients.
Material and methods
In a cross-sectional observational study, we retrospectively analyzed the medical records of consecutive adult patients admitted for cancer treatment in a major oncology hospital and referred to a clinical dietitian January – June 2023.
The analysis included patients with available blood lab test results and nutritional assessment during the first dietary consultation. Anonymized data were collected on: age, sex, cancer type, and nutritional status: percentage of weight loss (%BWL) in 6 months, body mass index in kg/m2 (BMI), percentage of dietary intake from the calculated requirement for nutrients (%DI) and laboratory results of albumin (g/l), total protein (g/l), and CRP mg/dl. The goals for energy provision were 30 kcal/day per kg of body weight, based on ESPEN guidelines on nutrition in cancer patients [25]. All patients in the unit are asked to maintain a food journal to document their daily intake. The journal was reviewed and verified by a dietitian during a detailed dietary interview. To ensure accuracy and consistency, dietary intake is calculated over three consecutive days, including at least one weekend day. Systemic inflammation was assessed with inflammatory indices: PNI, NLR, and PLR. All measurements were taken after diagnosis, but before the onset of oncological treatment. Data on cancer dissemination on admission were included in the analysis. The study received a positive opinion from the Bioethics Committee (National Research Institute of Oncology in Warsaw, Poland, KB-80/2024). The study complied with the ethical guidelines of the Declaration of Helsinki. All data were anonymized to maintain patient confidentiality, and no identifiable patient information was used in the analyses.
Systemic inflammation biomarkers
Prognostic nutritional index
The prognostic nutritional index is calculated from serum albumin and total lymphocyte count, using the following formula:
PNI = [10 × albumin (g/dl)] + [0.005 × total lymphocyte count (per mm3)]
Statistical analysis
Descriptive statistics were used to summarize the data, with means and standard deviations (SD) for normally distributed variables and medians with interquartile ranges for those without a normal distribution. The normality of continuous variables was assessed using the Shapiro-Wilk test supported by visual analysis based on histograms.
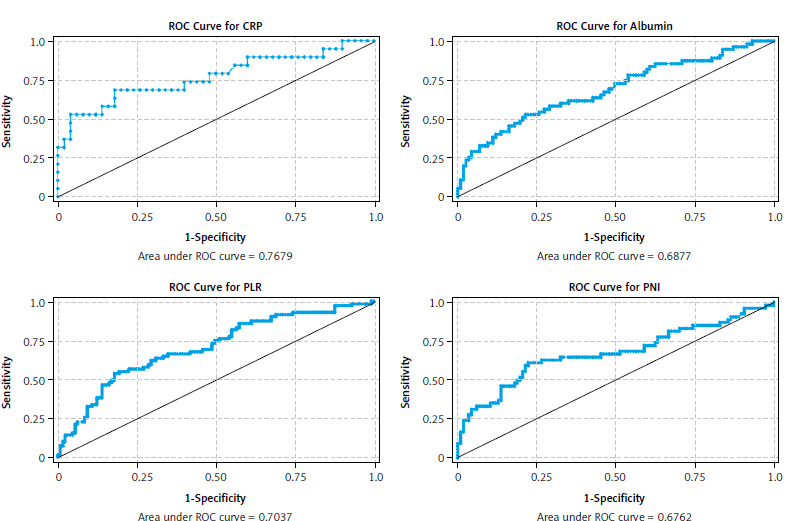
Correlations were determined with Spearman’s correlation. Linear regression models were constructed to examine the association between inflammatory indices (PNI, NLR, PLR), serum albumin, total protein, lymphocyte count, neutrophil count, platelet count, and BMI and %BWL. Multivariate logistic regression models were used to evaluate the associations with cancer dissemination. The stepwise method was used to select model variables starting with univariate analyses. Univariate regression models were stratified by cancer type. Final models accounted for age and gender to identify potential confounding factors. Model assumptions were tested. The Hosmer-Lemeshow test was used to assess the goodness of fit of the models. The model’s ability to discriminate between the different outcome classes was evaluated using the area under the receiver operating characteristic curve. To check for multicollinearity among the predictors, the variance inflation factor was calculated. The variance inflation factor values for all variables were close to 1, indicating no multicollinearity. Model details and the results of assumption testing are presented in the supplementary materials (Fig. 3). For all statistical analyses, a p-value < 0.05 was considered significant. All statistical calculations were performed using Stata version 18 (StataCorp, College Station, TX).
Sample size calculation
An a priori power analysis was performed using G*Power (Faul, F., Erdfelder, E., Buchner, A., & Lang, A.-G. (2009). Statistical power analyses using G*Power 3.1: Tests for correlation and regression analyses. Behavior Research Methods, 41, 1149-1160.) to determine the required sample size for assessing the impact of the PNI on weight loss in cancer patients. Based on data from Sun et al. study [26], we estimated that 10% of patients with a high PNI (p1 = 0.10) and 32.16% of those with a low PNI (p2 = 0.3216) would experience significant weight loss (> 10%). Assuming a significance level (α) of 0.05 and a power (1-β) of 0.80, with equal group allocation, the analysis indicated a total sample size of 96 participants to detect significant differences in weight loss between the groups.
Results
General characteristics
The study included 200 cancer patients who were divided into four groups based on the type of cancer they had: colorectal, upper GI, head and neck, and gynecological cancer. 36% of patients had a confirmed cancer dissemination. The median age was 65 and the genders were nearly equally represented. General characteristics of the study population are shown in Table 1.
Table 1
Study population – general characteristics
Albumin and nutritional status
We found a negative correlation between weight loss and albumin levels (ρ = –0.426, p < 0.001), and lower total protein (ρ = –0.214, p = 0.006). Conversely, BMI showed a positive correlation with albumin (ρ = 0.196, p = 0.010), but not with total protein levels (p = 0.663). Individuals with albumin levels below 35 g/l had a higher %BWL, elevated CRP and a lower percentage of dietary intake. No differences were observed in age and BMI. Patients with an albumin concentration of more than 35 g/dl had a median %BWL of 8% (0–37%). Results are summarized in Table 2 A–C.
Table 2
Analysis of blood protein concentration in relation to body mass index, weight loss, age, and body mass index
Inflammatory biomarkers and nutritional status
In the overall population, weight loss was positively correlated with neutrophil count (ρ = 0.273, p = 0.030), CRP levels (ρ = 0.293, p = 0.019), albumine (ALB) < 35 (ρ = 0.273, p = 0.029), NLR (ρ = 0.366, p = 0.003), and PLR (ρ = 0.293, p = 0.019). Negative correlations were observed with lymphocyte count (ρ = –0.288, p = 0.021), albumin (ρ = –0.490, p < 0.001), and PNI (ρ = –0.464, p < 0.001). Platelet count was not significantly correlated with %BWL (ρ = 0.114, p = 0.370). For specific cancer types, %BWL was positively correlated with ALB < 35 (ρ = 1.000, p = 0.046) in colorectal cancer, with no other variables showing significant correlations. In gynecological cancer, %BWL was positively correlated with CRP (ρ = 1.000, p = 0.024) and platelet count (ρ = 0.318, p = 0.025), while it was negatively correlated with lymphocyte count (ρ = –1.000, p = 0.024). For H and N cancer, positive correlations with %BWL were observed for neutrophil count (ρ = 0.491, p = 0.002), CRP (ρ = 0.328, p = 0.048), and NLR (ρ = 0.519, p = 0.001), whereas albumin (ρ = –0.285, p = 0.041) and PNI (ρ = –0.342, p = 0.013) showed negative correlations. In upper GI cancer, no variables were significantly correlated with %BWL. Total protein was not correlated with weigh loss in cancer types (Table 3).
Table 3
Correlations of inflammatory indices and percentage body weight loss
Inflammatory biomarkers and cancer progression
Univariate models showed that NLR and lymphocyte count were not associated with dissemination and therefore were not included in multivariate model building. The association of factors is specific to cancer types. Albumin levels were significantly associated with cancer dissemination in H and N (p = 0.036) and upper GI cancers (p = 0.049). Neutrophil count was significantly associated with dissemination in upper GI cancers (p = 0.011). The presence of albumin levels below 35 g/l was not specifically significant in any cancer type you provided. The prognostic nutritional index was significantly associated with cancer dissemination in H and N cancers (p = 0.038), while the PLR was also significantly associated with dissemination in H and N cancers (p = 0.040). These findings highlight the varying impact of these biomarkers across different types of cancers, particularly in H and N and upper GI cancers (Table 4).
Table 4
Univariate regression of cancer dissemination and: prognostic nutritional index, neutrophil-to-lymphocyte ratio, platelet-to- lymphocyte ratio, albumin level, total protein, platelet count, lymphocyte count, percentage of dietary intake from the calculated requirement for nutrients
The prognostic nutritional index, NLR, PLR, albumin, %BWL, %DI, and CRP were significantly different in disseminated cancer than in patients with local disease (Table 5). Regression models were built to confirm the association of analyzed variables (PNI, PLR, albumin, lymphocyte and platelet counts, %BWL, and %DI) and cancer dissemination accounting for age and localization of cancer. Cancer dissemination was associated with PNI (OR: 0.93, 95% CI: 0.89–0.98, p = 0.008), PLR (OR: 1.00, 95% CI: 1.00–1.01, p = 0.002), albumin (OR: 0.86, 95% CI: 0.80–0.93, p < 0.001), %BWL (OR: 1.06, 95% CI: 1.02–1.11, p = 0.002), platelet count (OR: 1.01, 95% CI: 1.00–1.01, p = 0.001), CRP levels (OR: 1.02, 95% CI: 1.01–1.03, p = 0.008), %DI (OR: 0.97, 95% CI: 0.96–0.99) and neutrophil count (OR: 1.18, 95% CI: 1.05–1.32, p = 0.005). Furthermore, we found that albumin concentrations below the cut-off level of 35 g/l were significantly associated with cancer dissemination (OR: 4.95, 95% CI: 1.89–12.99, p = 0.001), indicating that with albumin below 35 g/l, the odds of cancer dissemination increase nearly 5-fold (Table 6).
Table 5
Differences between variables in metastatic and localized cancer disease
Table 6
Summary of multivariate logistic regression – cancer dissemination and prognostic nutritional index, platelet-to-lymphocyte ratio, albumin level, platelet count, lymphocyte count, percentage of weight loss, albumin < 35 g/l, controlling for age and gender
Discussion
The risk of malnutrition varies depending on the type of cancer, and even among patients with the same diagnosis, the severity of malnutrition can vary greatly. It appears that the intensity of the inflammatory process is a significant factor influencing the risk of malnutrition.
This study explores the complex relationship between malnutrition, characterized by weight loss and BMI, and inflammation, as reflected in laboratory results and inflammatory biomarkers. The analysis emphasizes the complex interplay between nutritional status and systemic inflammation in the context of cancer.
There was a notable negative correlation between weight loss and albumin levels (ρ = –0.426, p < 0.001), suggesting that greater weight loss is associated with lower albumin, an indicator of poor nutritional status and systemic inflammation. The study found a direct association between severe malnutrition (average body weight loss of 14.5%), systemic inflammation, restricted dietary intake, and an albumin concentration below the threshold of 35 g/l. Interestingly, patients with albumin concentration higher than 35 g/dl experienced a median body weight loss of 8%, ranging 0–37%. This suggests that although albumin is a useful predictor of weight loss, it is not the only one. When interpreting albumin concentration, it is important to remember that it changes rapidly in response to trauma, infection, or chronic inflammatory diseases [27]. On the other hand, albumin concentration is a well-known negative prognostic factor in cancer [28–30] and predicts the occurrence of complications [31].
The relationship between weight loss and total protein levels was also significant, but less pronounced (ρ = –0.214, p = 0.006). Conversely, BMI showed a positive correlation with albumin (ρ = 0.196, p = 0.010), but no significant correlation with total protein levels (ρ = 0.034, p = 0.663), indicating a potential protective role of better nutritional status against inflammation. A higher BMI (> 18.5 kg/m2) and an albumin concentration of > 35 g/l are associated with a lower risk of developing complications and better outcomes in pancreatic cancer [32], gynecological cancers [33], lung cancer [34] and colorectal cancer [35], respectively.
We then investigated the correlation of inflammatory indices (PNI, NLR, PLR) and immune-related cells (lymphocytes, neutrophils, platelets) with nutritional status. We found that weight loss is correlated with neutrophil and lymphocyte count and all the biomarkers mentioned, but not the platelet count. Lymphocyte count was correlated with weight loss only in gynecological cancer. However, BMI only correlated with PNI. In malnourished patients, the number of lymphocytes decreases due to a negative relationship with adipokines, particularly leptin. As adipose tissue resources decrease, leptin concentration decreases, leading to a decrease in the pool of T lymphocytes [36]. In our study, the absolute weight loss was significant in both groups of patients with albumin concentrations < 35 g/l and > 35 g/l. The average weight loss was 14.5% and 8% respectively. However, the average BMI of the entire group analyzed was 25 kg/m2. We have only 4.5% (n = 9) patients with BMI < 18.5 kg/m2 in the study group. This probably explains why there is no correlation between lymphocytes and body weight loss in colorectal, upper GI and H and N cancer and why no association was found between BMI and inflammatory biomarkers.
In our analysis of the overall cancer cohort, we observed that PNI, PLR, NLR, albumin concentration, and neutrophile and lymphocyte count, but not platelet count, were correlated with weight loss. However, more detailed analyses revealed distinct relationships across different cancer localizations. In H and N cancers, there was a consistent negative correlation between both PNI and albumin levels with weight loss, alongside positive associations with NLR and neutrophil levels. In gynecological cancers, lymphocyte levels were negatively associated with weight loss, while CRP and PLR showed positive correlations. The association with NLR was less pronounced in gynecological cancers. In colorectal cancers, neutrophil levels were the only variable showing a notable association with weight loss, although it was not statistically significant. In upper GI cancers, albumin was the only significant predictor, with lower levels strongly correlating with greater weight loss. These findings illustrate the variable influence of inflammatory markers on weight loss among cancer patients. The varying significance of NLR and PLR across these cancer types further elucidates the differential impact of neutrophil- and platelet-driven inflammation on malnutrition and BMI. The strong correlation between inflammatory biomarkers and body weight loss in our study is consistent with data from the literature for PNI [37, 38], NLR [23, 39] and PLR [40, 41], respectively. On the other hand, the intensity of inflammation is not the same in all cancer types, which not only may be responsible for differences in the severity of malnutrition but is also reflected in the levels of inflammatory biomarkers.
Chronic inflammation is estimated to be responsible for around 7–25% of all cancer cases [42–44]. The literature has identified an intense inflammatory process as one of the basic factors promoting carcinogenesis in gastric cancer associated with Helicobacter pylori [45], colon cancer and inflammatory bowel disease [46], lung cancer and pulmonary obstructive disease [47], hepatocarcinoma associated with hepatitis B and C viruses [48], cervical cancer or H and N cancer linked to human papilloma virus [49, 50], and bladder cancer related to Schistosoma haematobium infection [51]. In some cancer types, the inflammatory background is not so evident. Breast or prostate cancer, for example, is more likely to be associated with hormone metabolism [52], while some cancers are caused by genetic factors and different lifestyle patterns [53]. In summary, the impact of inflammation is strong, but it is not the only factor. It moderates in different ways inflammatory biomarkers and nutritional status.
In the next part of our analysis, we found a positive association with limited cancer dissemination for higher albumin concentration and lower platelet count, indicating that their levels are associated with a lower likelihood of disseminated disease. Body mass index did not significantly predict the dissemination of cancer (OR = 0.94, p = 0.070), although there some evidence suggesting that higher BMI may be associated with limited disease. The percentage body weight loss showed a significant negative association with cancer dissemination (OR = 1.06, p = 0.002), suggesting that greater weight loss is associated with an increased likelihood of disseminated disease.
The conclusions from the results on the effect of inflammation on malnutrition are entirely consistent with the effect on the risk of cancer progression. Factors that influence the severity of malnutrition increase the risk of progression. Many studies confirm that albumin concentration and reduced dietary intake are independent negative prognostic factors [54–56], while higher BMI, understood as proper nutritional status (18.5–24.9 kg/m2), and not overweight or obesity, may have a protective role [57]. Elevated platelet counts are observed in 10–57% of patients with cancer, with the number varying depending on the cancer type [58]. Platelets are versatile cells that change shape, produce proteins, and release metabolites for cell cross-talk and paracrine regulation. They can enhance cancer-related blood coagulation, protect tumor cells from immune responses, and promote cancer growth and dissemination [59]. The extent of elevated platelet count and higher PLR correlates inversely with survival in most malignancies, suggesting that thrombocytosis is a poor prognostic marker for gastric cancer [60], colorectal cancer [61], pancreatic cancer [62], renal cancer [63], and gynecological cancers (endometrial, ovarian, cervical) [64–66]. In our study, for each unit increase in PLR, the odds of cancer dissemination increased by approximately 0.47% (odds ratio: 1.004719, p = 0.001).
The prognostic nutritional index is one of the oldest inflammatory biomarkers used to predict cancer progression [67]. The majority of studies confirm its negative prognostic value [26, 67–70]. The prognostic nutritional index is associated with postoperative complications, depth of invasion and lymph node metastases [26], poorer disease-free survival and progression-free survival [68, 70], and tumor volume [69]. In our study, a significant association was found between PNI and the likelihood that the cancer had spread. For each unit increase in PNI, the odds of disseminated cancer decreased by approximately 7.6% (odds ratio: 0.93, p = 0.006).
Neutrophil-to-lymphocyte ratio is a readily available and inexpensive marker of systemic inflammation. A low lymphocyte count is linked to a weak immune response and weak interaction between different cells mediated by lymphocytes [71]. However, neutrophils are the most abundant type of white blood cells and have multiple functions. Malignant lesions can stimulate neutrophil production in the bone marrow and attract them to the tumor [72]. Subsequently, the neutrophil population, driven by TGFβ- and G-CSF-dependent mechanisms, promotes cancer cell proliferation and metastasis [73, 74]. Elevated neutrophil counts in the circulation may be associated with inflammation that promotes tumor growth. High NLR appeared to be a negative prognostic marker in cancer [75–78]. However, in our study, no association of NLR with cancer dissemination was found.
The inflammatory biomarkers that are being studied may be caused by various factors that have been consistently linked to a higher risk of cancer. These factors include, but are not limited to, tobacco abuse [79], overweight or obesity [80], sedentary lifestyle [81], and experiencing persistent or temporary infection [48, 50].
Study limitations
This study has several limitations. Its retrospective and cross-sectional design limits the ability to establish causal relationships between variables. Additionally, we lacked data on fluid provision or retention, which could influence biomarkers such as albumin and lymphocyte levels. The dietary intake data were derived from interviews and food journals, which, while standardized, may be less precise for some patients, particularly those with recall bias or incomplete records. Furthermore, the study did not account for potential confounding factors such as comorbidities that might impact nutritional status and inflammatory markers. Future prospective studies are needed to validate these findings and address these limitations.
Prospective research designs may help to determine whether the associations between inflammatory biomarkers and malignancy are direct triggers of carcinogenesis or simply a pre-diagnosis manifestation of tumor-related inflammation or comorbidity-related inflammation. To analyze these connections, samples should be taken many years before diagnosis. A prospective analysis could shed more light on whether inflammation is the cause or the consequence of cancer and the associated malnutrition.
Conclusions
The concentration of acute phase proteins and inflammatory biomarkers reflects the severity of inflammation, which can affect the intensity of malnutrition, outcomes of oncological treatment, and its complications. In other words, the severity of inflammation may explain why some patients with the same cancer diagnosis experience more severe weight loss and shorter survival than others.


