
Introduction
Metabolic dysfunction-associated steatotic liver disease (MASLD), formerly named metabolic dysfunction-associated fatty liver disease (MAFLD), affects approximately 30% of adults globally [1-4]. The risk factors for MASLD are well understood, and it is known that MASLD exhibits a strong association with excessive body weight, type 2 diabetes mellitus (T2DM), hypertension and atherogenic dyslipidaemia [5, 6]. Although overweight and obesity are well-established risk factors for MASLD, it should be highlighted that MASLD may also occur in patients with normal body weight as the so-called lean MASLD. Analysis of 53 studies on 65,029 subjects with non-alcoholic fatty liver disease (NAFLD) and 249,544 healthy subjects showed a prevalence of lean NAFLD of 11.2% in the general population. Among individuals with NAFLD, the prevalence of lean NAFLD doubles, reaching 25.3% [7]. According to the expert review, lean MASLD should be diagnosed in individuals with MASLD and body mass index (BMI) < 25 kg/m2 (non-Asian race) or BMI < 23 kg/m2 (Asian race). Lean individuals with MASLD should be evaluated routinely for comorbid conditions, such as type T2DM, dyslipidaemia, and hypertension [8]. The pathophysiology of liver steatosis in lean subjects has not been clear, and besides known metabolic dysfunction, factors such as higher serum levels of secondary bile acids and fibroblast growth factor-19, as well as impairments in gut microbiota, have been associated with the development of lean MASLD [9].
Gallstone disease (GsD) is an increasing and common worldwide pathology underlying an important economic and health burden [10]. There is currently evidence suggesting that GsD might be associated with MASLD [11]. However, the inherent aetiology behind these two identities remains unclear [12, 13]. Even among nonobese and lean individuals, patients with NAFLD have been demonstrated to carry a 1.29-fold increased risk of GsD [14]. Furthermore, GsD incidence is not only influenced by sex and BMI [11, 15], but also by age, waist circumference and smoking habits, highlighting that the onset of GsD or MASLD originates from similar risk factors [11]. Hence, the authors sought to assess the predictors of lean MASLD occurrence in patients with GsD. Secondly, this study also aimed to provide comparative values between lean patients and patients with excessive body weight, regarding metabolic dysfunction in MASLD, and patients without MASLD.
Material and methods
Study design and study population
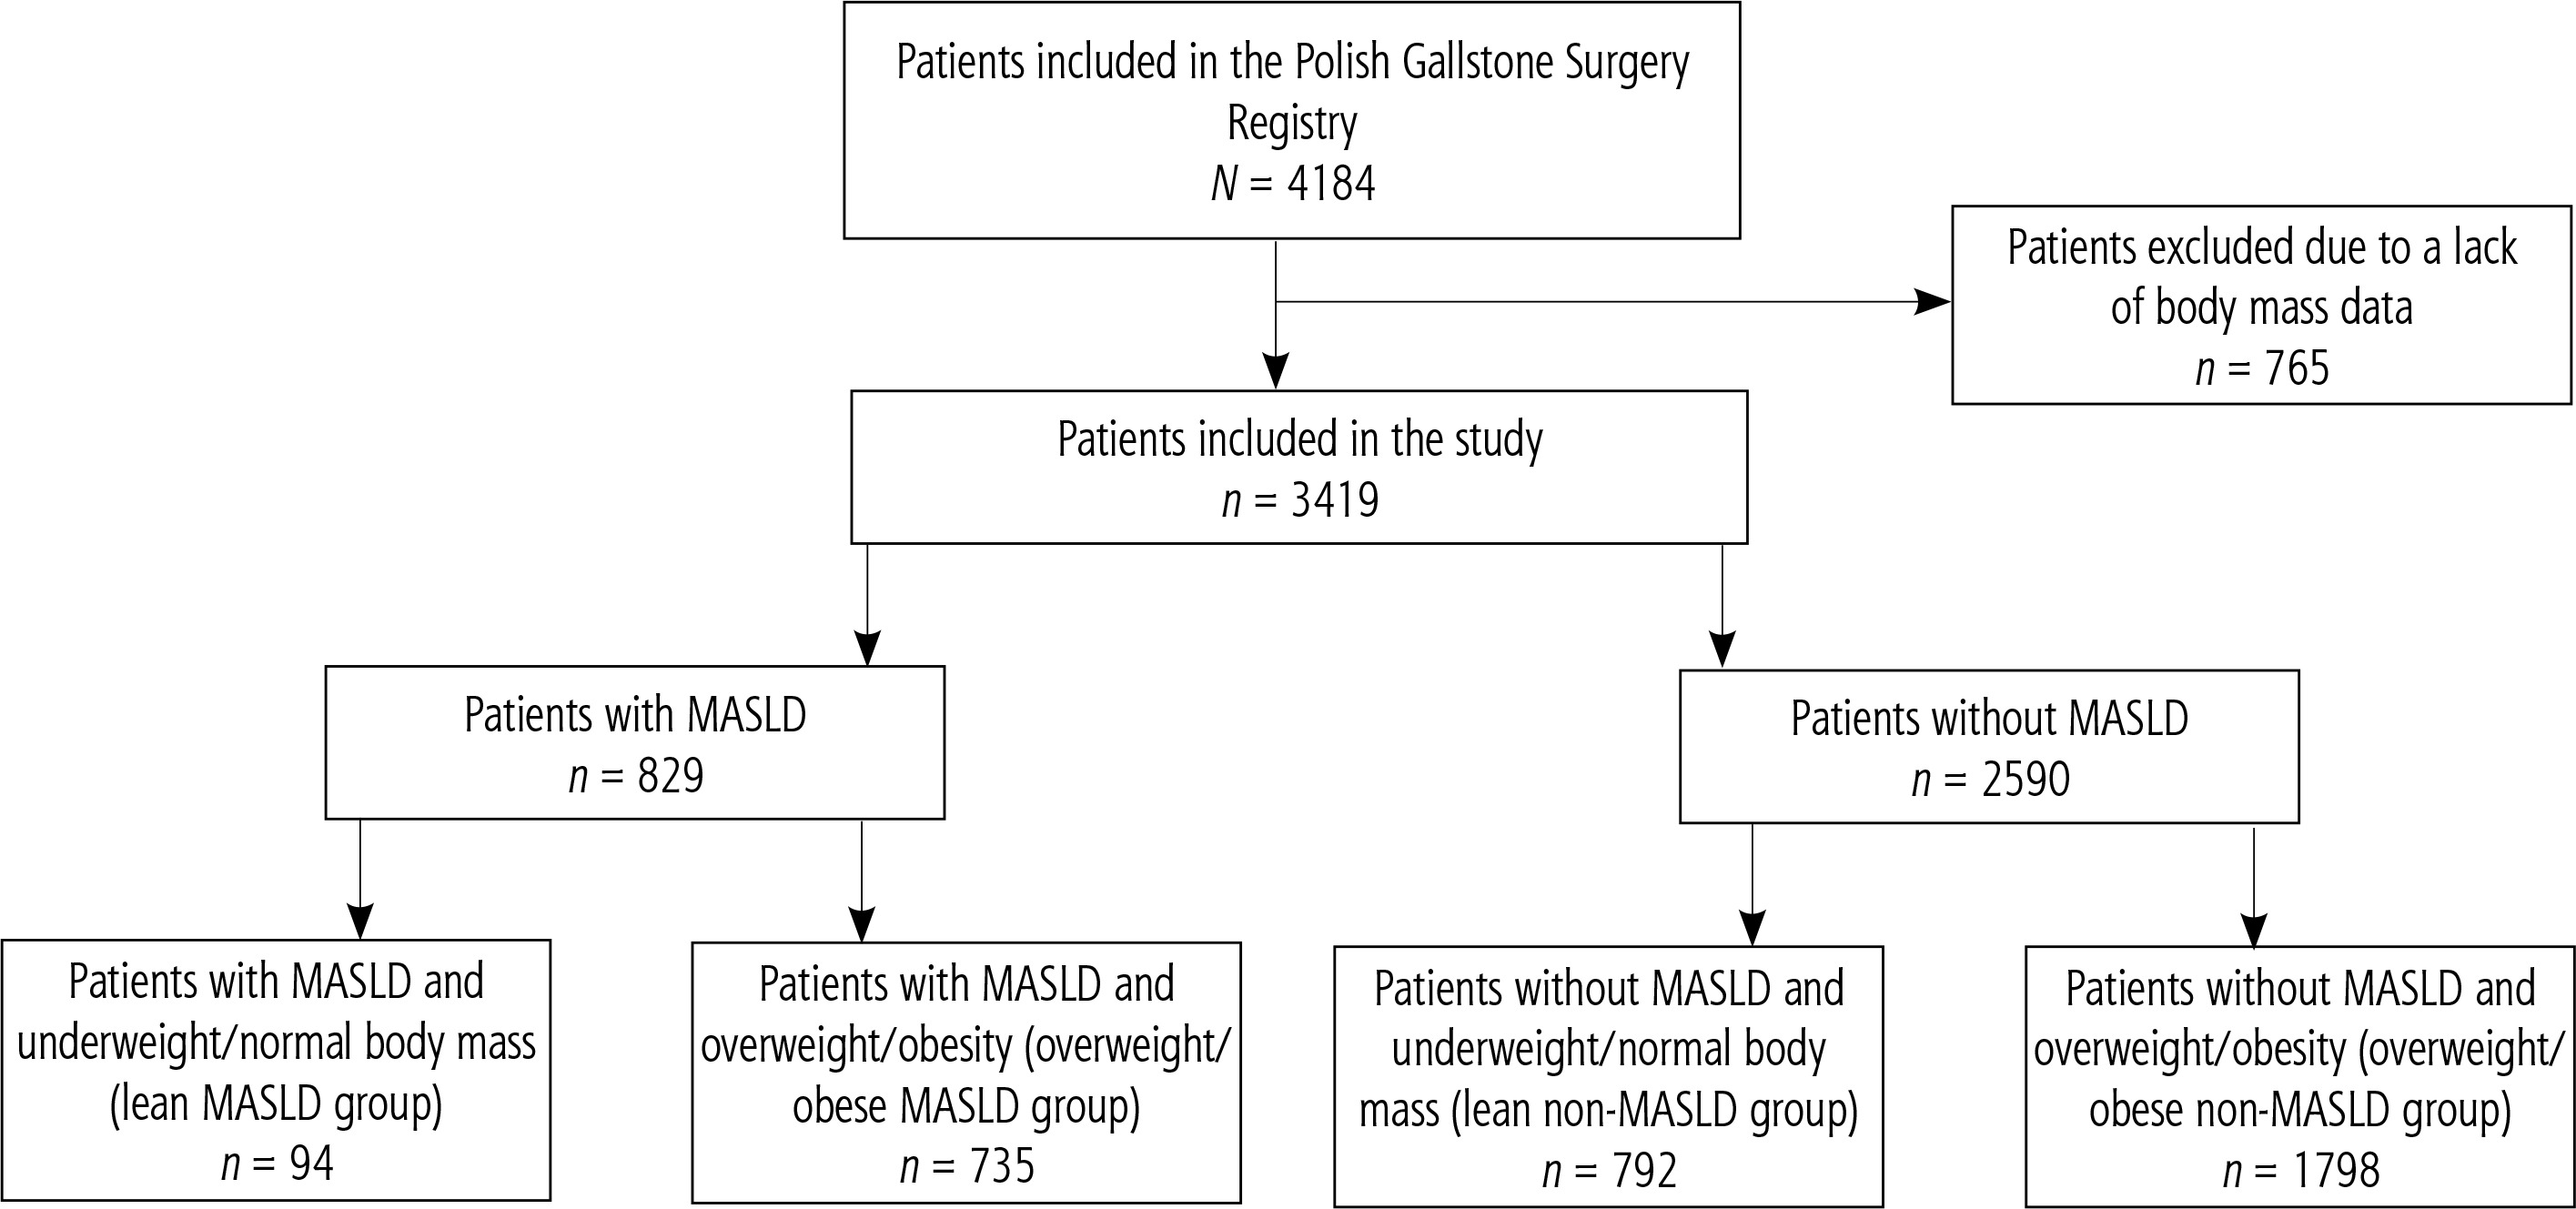
The study covered the population of patients included in the Polish Gallstone Surgery Registry. It was a forward-looking, observational registry conducted across multiple centres, where patients undergoing cholecystectomies were enrolled sequentially. This study included six surgical hospitals, comprising four academic institutions and two regional hospitals, providing a comprehensive reflection of surgical practices in Poland. The data comprised all sequential patients above 18 years old, diagnosed with gallstone disease, who underwent cholecystectomies and were hospitalized in one of the participating centres between 2019 and 2022, regardless of whether the admission was for urgent or elective reasons. No specific exclusion criteria were established to prevent biased patient selection, aiming to create a cohort closely resembling real-world scenarios. The analysis excluded patients with incomplete data to diagnose MASLD, particularly if absent BMI or patients with reasons for liver steatosis other than metabolic factors were present (Fig. 1).
The study was approved by the Ethics Committee of Collegium Medicum of Jan Kochanowski University (104/2022). This study conformed to the ethical guidelines of the Declaration of Helsinki and its later amendments. The requirement for patient informed consent was waived as this was a post-hoc study conducted exclusively using de-identified data, respecting the European Union General Data Protection Regulation (GDPR).
Covariates
Metabolic dysfunction-associated steatotic liver disease was diagnosed based on current criteria recommended in June 2023 by experts from the following hepatology societies: the European Association for the Study of the Liver (EASL), La Asociación Latinoamericana para el Estudio del Hígado (ALEH), and the American Association for the Study of Liver Diseases (AASLD) [16]. In the present study, the last two factors – plasma triglycerides and plasma HDL cholesterol or lipid-lowering treatment – were collectively referred to as atherogenic dyslipidaemia.
Subjects were considered underweight if they had a BMI < 18.5 kg/m2. Normal body mass was defined as a BMI of 18.5-24.9 kg/m2. Patients with underweight and normal body mass were referred to as lean. Patients were considered overweight if they had a BMI of 25.0-29.9 kg/m2, and obese if they had a BMI of ≥ 30 kg/m2. Relying on the body weight and the presence of MASLD, four groups of patients were distinguished (Fig. 1).
Physical and blood measurements including BMI, aspartate aminotransferase (AST), alanine aminotransferase (ALT), γ-glutamyl transferase (GGTP), and bilirubin were obtained from the laboratory tests administered by highly trained medical personnel in the mobile testing centres using the standard protocol.
Comorbidity data including metabolic diseases, such as T2DM, prediabetes conditions, atherogenic dyslipidaemia, and hypercholesterolaemia, cardiovascular diseases, such as hypertension, coronary artery disease, previous myocardial infarction, cerebrovascular disease, atrial fibrillation, heart failure, and venous thromboembolism, cancer, and acute or chronic pancreatitis were all self-reported by participants or diagnosed during hospitalization.
Statistical analyses
Continuous data were described as mean and standard deviations. Frequencies and percentages were used to summarize categorical data. The groups were compared with the chi-square or Fisher exact test for categorical variables, and the t-test or Mann-Whitney U test for continuous variables. Univariable and multivariable analyses were conducted with logistic regression models. The backward and forward stepwise regression method was applied, and variables with p < 0.10 were included. For these univariable and multivariable analyses, odds ratios (OR) with 95% confidence intervals (95% CI) were calculated. A two-tailed p-value < 0.05 was considered statistically significant. All statistical analyses were performed using the R soft-ware package version 4.0.3.
Results
Patient characteristics
Among the 3,419 patients included in the study, MASLD was diagnosed in 829 patients (24.2%). Lean MASLD was diagnosed in 94 patients (11.3% patients with MASLD). Lean MASLD patients had a similar proportion of T2DM and prediabetes conditions as well as overweight/obese MASLD patients (23.4% vs. 25.7%, p = 0.6283). Seventy-two patients (76.6%) with lean MASLD and 90 patients (12.2%) with overweight/obese MASLD (Table 1) had one of the clinical cardiometabolic criteria of MASLD diagnosis. In lean MASLD patients meeting only one diagnostic criterion of MASLD, the distribution of criteria was as follows: hypertension in 20 patients (27.8%), T2DM in 1 patient (1.4%), prediabetes in 2 patients (2.8%), and atherogenic dyslipidaemia in 49 patients (68.0%).
Table 1
Type and number of factors included in MASLD diagnosis
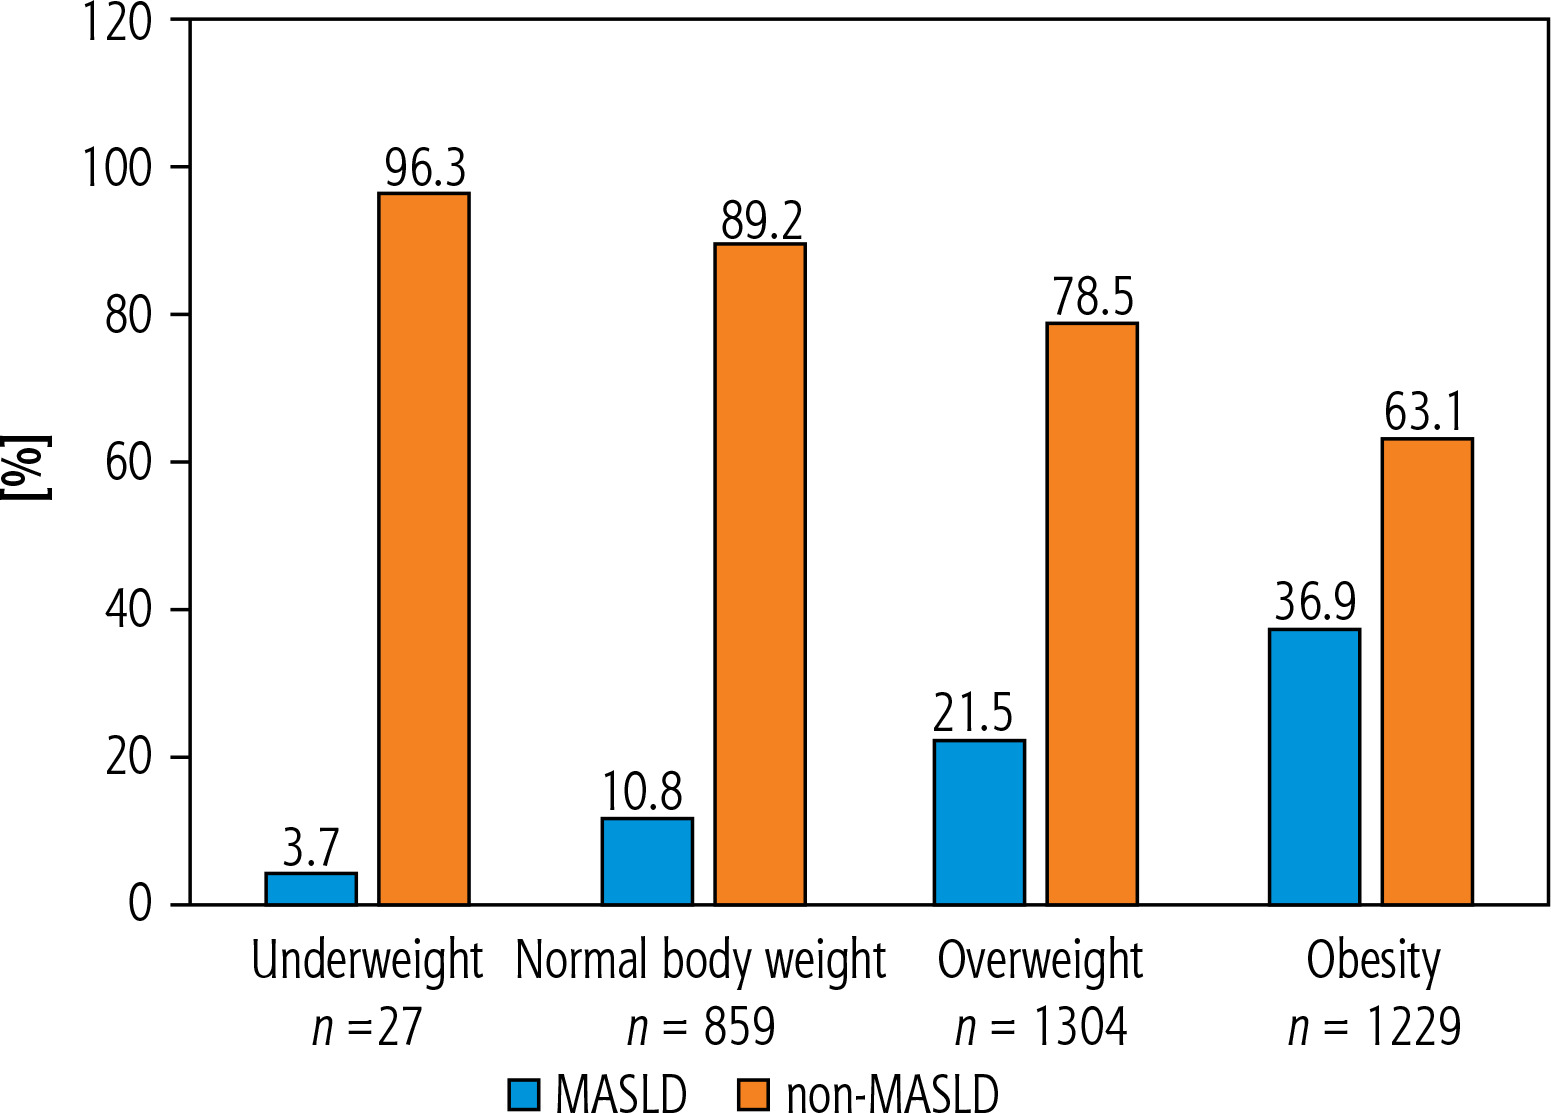
In the whole study group, 27 patients (0.8%) were underweight, 859 patients (25.1%) had normal body mass, 1304 patients (38.1%) were overweight, and 1229 patients (36%) had obesity. The lean MASLD group included 94 patients (2.7%), whereas 735 patients (21.5%) were in the overweight/obese MASLD group, 792 patients (23.2%) were in the lean non-MASLD group, and 1798 patients (52.6%) were in the overweigh/obese non-MASLD group.
A sensitivity analysis was conducted by excluding patients with incomplete data necessary for the diagnosis of MASLD. The results showed no significant differences in the demographics between the excluded and included patients, supporting the robustness of the original analysis.
Comparison of MASLD patients with non-MASLD patients
Metabolic dysfunction-associated steatotic liver disease patients were older than non-MASLD patients (59.2 vs. 53.4 years, p < 0.0001). The non-MASLD group had more female patients than the MASLD group (73.1% vs. 64.2%, p < 0.0001). MASLD was noted in 3.7% of underweight patients, in 10.8% of patients with normal body mass, in 21.5% of overweight patients and in 36.9% of patients with obesity (Fig. 2), reflecting an increasing percentage of MASLD in parallel with progressive higher body mass.
Detailed characteristics of MASLD patients and non-MASLD patients are presented in Table 2.
Table 2
Comparison of patients with MASLD and without MASLD
| Clinical characteristic | All patients N = 3419 | MASLD group n = 829 | Non-MASLD group n = 2590 | p |
|---|---|---|---|---|
| Age (years), mean (SD) | 54.8 (15.3) | 59.2 (13.1) | 53.4 (15.6) | * |
| Age (years), n (%) | ||||
| < 50 | 1319 (38.6) | 201 (24.2) | 1118 (43.2) | < 0.0001 |
| 50-70 | 1531 (44.8) | 459 (55.4) | 1072 (41.4) | < 0.0001 |
| > 70 | 569 (16.6) | 169 (20.4) | 400 (15.4) | 0.0009 |
| Female sex, n (%) | 2424 (70.9) | 532 (64.2) | 1892 (73.1) | < 0.0001 |
| BMI (kg/m2), mean (SD) | 28.6 (5.3) | 31.1 (5.4) | 27.8 (5.0) | * |
| Comorbidities, n (%) | ||||
| Hypertension | 1433 (41.9) | 461 (55.6) | 972 (37.5) | * |
| Diabetes mellitus | 415 (12.1) | 175 (21.1) | 240 (9.3) | * |
| IGT/IFG | 104 (3.0) | 36 (4.3) | 68 (2.6) | * |
| Diabetes mellitus or IGT/IFG | 519 (15.2) | 211 (25.4) | 308 (11.9) | * |
| Atherogenic dyslipidaemia | 432 (12.6) | 380 (45.8) | 52 (2.0) | < 0.0001 |
| Coronary artery disease | 204 (6) | 59 (7.1) | 145 (5.6) | 0.1081 |
| Previous myocardial infarction | 87 (2.5) | 29 (3.5) | 58 (2.2) | 0.0452 |
| Hypercholesterolaemia | 435 (12.7) | 188 (22.7) | 247 (9.5) | * |
| Atrial fibrillation | 123 (3.6) | 41 (4.9) | 82 (3.2) | 0.0166 |
| Thromboembolism events | 65 (1.9) | 22 (2.6) | 43 (1.7) | 0.0683 |
| Venous thromboembolism N-miss | 75 (2.2) 1 | 24 (2.9) 0 | 51 (2.0) 1 | 0.1135 |
| Heart failure | 94 (2.7) | 26 (3.1%) | 68 (2.6%) | 0.4337 |
| Acute pancreatitis previous | 164 (4.8) | 45 (5.4%) | 119 (4.6%) | 0.3283 |
| Chronic pancreatitis | 19 (0.6) | 5 (0.6%) | 14 (0.5%) | 0.7916 |
| Active malignancy | 40 (1.2) | 5 (0.6%) | 35 (1.4%) | 0.0812 |
| Malignancy in remission | 183 (5.4) | 58 (7.0%) | 125 (4.8%) | 0.0157 |
| AST (U/I), mean (SD) N-miss | 35.0 (129.4) 1711 | 32.4 (44.3) 317 | 36.1 (152.0) 1394 | 0.4458 |
| ALT (U/I), mean (SD) N-miss | 39.6 (97.6) 1677 | 38.2 (43.9) 308 | 40.2 (113.0) 1369 | 0.5941 |
| GGTP (U/I), mean (SD) N-miss | 65.8 (167.4) 2322 | 73.0 (139.4) 470 | 62.3 (179.5) 1852 | 0.2776 |
| ALP (IU/l), mean (SD) N-miss | 88.0 (66.6) 2262 | 87.3 (64.8) 434 | 88.3 (67.5) 1828 | 0.7940 |
| Bilirubin (mg/dl), mean (SD) N-miss | 0.7 (0.6) 1228 | 0.7 (0.6) 204 | 0.7 (0.6) 1024 | 0.7573 |
ALT – alanine aminotransferase, ALP – alkaline phosphatase, AST – aspartate aminotransferase, BMI – body mass index, GGTP – γ-glutamyl transpeptidase, IFG – impaired fasting glucose, IGT – impaired glucose tolerance, MASLD – metabolic dysfunction-associated steatotic liver disease, SD – standard deviation,
Comparison of MASLD patients with non-MASLD patients in lean and overweight/obese group
Patients with MASLD were older than patients without MASLD in the lean group (59.7 vs. 51.2, p < 0.0001) as well as in the overweight/obese group (59.2 vs. 54.3, p < 0.0001). In the lean group, BMI differed between MASLD patients and non-MASLD patients (23.0 vs. 22.5, p = 0.0085). In the overweight/obese group, a difference between MASLD and non-MASLD patients was observed (32.2 vs. 30.1, p < 0.0001). Prediabetes conditions (IGF and IFG) were noted more often in the lean MASLD group than in the lean non-MASLD group (5.3% vs. 1.5%, p = 0.0266). In contrast, prediabetes conditions were noted in a similar proportion in the overweight/obese MASLD group vs. the overweight/obese non-MASLD group (4.2% vs. 3.1%, p = 0.1665). Table 3 shows detailed characteristics of the lean MASLD group, lean non-MASLD group, overweight/obese MASLD group and overweight/obese non-MASLD group.
Table 3
Comparison of patients with and without MASLD according to body mass
| Clinical characteristic | Lean MASLD group n = 94 | Lean non-MASLD group n = 792 | p | Overweight/obese MASLD group n = 735 | Overweight/obese non-MASLD group n = 1798 | p |
|---|---|---|---|---|---|---|
| Age (years), mean (SD) | 59.7 (13.8) | 51.2 (16.4) | < 0.0001 | 59.2 (13.0) | 54.3 (15.2) | < 0.0001 |
| Age (years), n (%) | ||||||
| < 50 | 23 (24.5) | 402 (50.8) | < 0.0001 | 178 (24.2) | 716 (39.8) | < 0.0001 |
| 50-70 | 48 (51.1) | 273 (34.5) | 0.0016 | 411 (55.9) | 799 (44.4) | < 0.0001 |
| > 70 | 23 (24.4) | 117 (14.7) | 0.0148 | 146 (19.9) | 283 (15.8) | 0.0120 |
| Female sex, n (%) | 63 (67) | 643 (81.2) | 0.0012 | 469 (63.8) | 1249 (69.5) | 0.0057 |
| BMI (kg/m2), mean (SD) | 23.0 (1.7) | 22.5 (1.9) | 0.0085 | 32.2 (4.8) | 30.1 (4.0) | * |
| Comorbidities, n (%) | ||||||
| Hypertension | 42 (44.7) | 195 (24.6) | < 0.0001 | 419 (57) | 777 (43.2) | * |
| Diabetes mellitus | 17 (18.1) | 27 (3.4) | < 0.0001 | 158 (21.5) | 213 (11.8) | * |
| IGT/IFG | 5 (5.3) | 12 (1.5) | 0.0266 | 31 (4.2) | 56 (3.1) | * |
| Diabetes mellitus or IGT/IFG | 22 (23.4) | 39 (4.9) | < 0.0001 | 189 (25.7) | 269 (15) | * |
| Atherogenic dyslipidaemia | 54 (57.4) | 20 (2.5) | < 0.0001 | 326 (41.2) | 32 (1.8) | < 0.0001 |
| Coronary artery disease | 8 (8.5) | 43 (5.4) | 0.2252 | 51 (6.9) | 102 (5.7) | 0.2249 |
| Previous myocardial infarction | 7 (7.4) | 19 (2.4) | 0.0147 | 22 (3) | 39 (2.2) | 0.2195 |
| Hypercholesterolaemia | 24 (25.5) | 74 (9.3) | < 0.0001 | 164 (22.3) | 173 (9.6) | * |
| Atrial fibrillation | 7 (7.4) | 15 (1.9) | 0.0054 | 34 (4.6) | 67 (3.7) | 0.2937 |
| Thromboembolism events | 1 (1.1) | 14 (1.8) | 1 | 21 (2.9) | 29 (1.6) | 0.0410 |
| Venous thromboembolism N-miss | 0 (0) 0 | 12 (1.5) 1 | 0.6275 | 24 (3.3) | 39 (2.2) | 0.1079 |
| Heart failure | 6 (6.4) | 24 (3) | 0.1207 | 20 (2.7) | 44 (2.4) | 0.6901 |
| Acute pancreatitis previous | 15 (15.9) | 39 (4.9) | < 0.0001 | 30 (4.1) | 80 (4.4) | 0.6802 |
| Chronic pancreatitis | 1 (1.1) | 6 (0.8) | 0.5452 | 4 (0.5) | 8 (0.4) | 0.7536 |
| Active malignancy | 3 (3.2) | 10 (1.3) | 0.1513 | 2 (0.3) | 25 (1.4) | 0.0129 |
| Malignancy in remission | 10 (10.6) | 31 (3.9) | 0.0077 | 48 (6.5) | 94 (5.2) | 0.1959 |
| Laboratory test, mean (SD) | ||||||
| AST (U/I) N-miss | 40.0 (53.8) 31 | 30.0 (46.5) 419 | 0.1715 | 31.3 (42.7) 286 | 38.8 (180.4) 975 | 0.2589 |
| ALT (U/I) N-miss | 40.8 (54.6) 31 | 35.5 (73.6) 407 | 0.4956 | 37.8 (42.3) 277 | 42.4 (127.1) 962 | 0.3455 |
| GGTP (U/I) N-miss | 79.1 (169.2) 43 | 59.0 (115.4) 544 | 0.4215 | 72.0 (134.1) 427 | 63.9 (204.5) 1308 | 0.5005 |
| ALP (IU/l) N-miss | 115.3 (160.1) 43 | 89.5 (79.0) 539 | 0.2668 | 83.1 (30.9) 391 | 87.7 (61.0) 1289 | 0.1451 |
| Bilirubin (mg/dl) N-miss | 0.8 (1.2) 18 | 0.7 (0.4) 301 | 0.2732 | 0.7 (0.5) 186 | 0.7 (0.7) 723 | 0.6281 |
ALT – alanine aminotransferase, ALP – alkaline phosphatase, AST – aspartate aminotransferase, BMI – body mass index, GGTP – γ-glutamyl transpeptidase, IFG – impaired fasting glucose, IGT – impaired glucose tolerance, MASLD – metabolic dysfunction-associated steatotic liver disease, SD – standard deviation,
Analyses of predictors of MASLD in lean and overweight/obese patients
In the univariable and multivariable logistic regression analysis, the following predictors of MASLD in lean patients and MASLD in overweight/obese patients were assessed: age, sex, T2DM or prediabetes conditions, hypertension and atherogenic dyslipidaemia.
Table 4 presents the predictors of MASLD in lean patients and MASLD in overweight/obese patients. Independent predictors of MASLD in lean patients were atherogenic dyslipidaemia (OR = 94.16, CI: 45.54-197.71, p < 0.0001), T2DM or prediabetes conditions (OR = 9.26, CI: 4.42-19.38, p < 0.0001) and hypertension (OR = 2.97, CI: 1.38-6.41, p = 0.0054). Independent predictors of MASLD in overweight/obese patients were atherogenic dyslipidaemia (OR = 50.28, CI: 34.05-74.25, p < 0.0001), hypertension (OR = 1.98, CI: 1.56-2.52, p < 0.0001) and age (OR = 1.01, CI: 1.01-1.02, p = 0.0010). Female sex was a factor that reduced the likelihood of MASLD occurrence (OR = 0.77, CI: 0.62-0.96, p = 0.0195).
Table 4
Factors associated with the presence of MASLD in lean patients and MASLD in overweight/obese patients – univariable and multivariable logistic regression models
Discussion
The major novel findings of the present study are as follows. Firstly, our country-specific registry data showed that a quarter of patients treated with cholecystectomies had MASLD and this percentage is similar to that in the general population. Secondly, lean MASLD occurs in one in ten people with MASLD. Thirdly, factors predisposing to MASLD in lean patients as well as in overweight/obese patients were identified.
The incidence of MASLD varies and depends on geographical factors and the presence of diseases involved in the pathogenesis of MASLD – mainly obesity and T2DM. In a meta-analysis of 86 studies from 22 countries, the global prevalence of NAFLD was 25.2% [17]. Of course, the percentage of MASLD diagnoses is higher in patients in special populations, i.e. those with obesity, T2DM or hypertension. In the present study, MASLD was found in 24.2% of the subjects, similarly to studies conducted in the general population, although the study population included patients undergoing cholecystectomy.
Gallstone disease and MASLD have a wide array of shared risk factors within their development as well as linked pathologic mechanisms such as insulin resistance, oxidative stress, an altered gut microbiome and immune mechanisms [18]. A three-fold higher risk of gallstone formation was detected in a prospective cohort study including 5398 patients with MASLD [11]. A study that included patients undergoing elective laparoscopic cholecystectomy with liver biopsy showed that MAFLD, confirmed histopathologically, occurred in 58.8% of patients [19]. Other independent risk-factors for GsD were waist circumference (OR = 1.048, 95% CI: 1.018-1.079) and age (OR = 1.093, 95% CI: 1.060-1.126) in males and smoking status (OR = 1.035, 95% CI: 1.003-1.067) and age in females (OR = 5.465, 95% CI: 1.881-15.88) [11].
Lean MASLD has been an emerging topic of current interest because of the considerable portion of MASLD patients without obesity and its distinguishing courses of disease and manifestations. In the present study, lean MASLD occurred in 11.3% of patients with MASLD. Chen et al. [20] reported that MAFLD in underweight, normal body weight, overweight and obese patients was present in 0.1%, 4%, 27.4% and 59.8% of them, respectively. MAFLD in patients with BMI < 25 kg/m2 (but not underweight) was found in 7% of patients in the USA and in 19% of patients in Asia [21, 22]. The differences could be explained by geographical regions, genetic alterations, and cut-off points of BMI. It seems that data on the epidemiology of lean MASLD may be underestimated, because of, for example, changing definitions of the disease in recent years. Ordoñez-Vázquez et al. [23] compared the impact of both criteria (NAFLD vs. MAFLD) on the occurrence of the disease in overweight and lean patients. This study provided interesting insights into the different diagnostic criteria of MAFLD in lean and non-lean patients. The concordance of the diagnoses of MAFLD and NAFLD was high in the group of overweight patients. In this group (61%), the prevalence of NAFLD was 63.6% and of MAFLD 65.3% (p = 0.22). In contrast, the prevalence of MAFLD was lower (7.9% vs. 18.3%, p < 0.001) in lean patients. It can be concluded that, with MAFLD criteria, the prevalence is lower in lean patients. However, patients with high risk of progression of liver disease for steatosis were identified on the basis of MAFLD criteria. An individual’s risk for cardiometabolic disease may differ in patients with lean MASLD compared with non-lean MASLD patients. In several observational studies, patients with lean MASLD had a lower proportion of cardiometabolic disease, including hypertension, T2DM, and metabolic syndrome, and less atherosclerotic disease compared to those with non-lean MASLD [24, 25]. Other studies have shown that, compared with lean subjects without MASLD, lean patients with MASLD have a similar or higher prevalence of cardiometabolic disease and cardiovascular events than patients with overweight or obesity and MASLD [26]. Many previous studies have reported favourable metabolic and histologic profiles, with higher liver enzymes, inflammatory levels, steatosis, and fibrosis stage, in lean MASLD compared with non-lean MASLD [27, 28]. A meta-analysis of 10 cohort studies involving 109,151 NAFLD patients highlighted that patients with lean NAFLD have comparable risks for all-cause mortality (RR = 1.09, 95% CI: 0.66-1.90), cardiovascular mortality (RR = 1.12, 95% CI: 0.66-1.90), and adverse liver events including decompensated cirrhosis and hepatocellular carcinoma (RR = 0.81, 95% CI: 0.50-1.30). However, the risk of liver-related mortality was higher in patients with lean than non-lean NAFLD (RR = 1.88, 95% CI: 1.02-3.45) [29]. In contrast, Wijarnpreecha et al. [30] observed that lean individuals with NAFLD in the United States had significantly higher mortality and prevalence of cardiovascular disease and non-significantly higher incidence of cancers compared with overweight or obese patients with NAFLD despite a lower incidence of T2DM and cirrhosis. Another meta-analysis showed that lean patients with NAFLD had an elevated risk of all cause-death compared to non-lean patients (RR = 1.39, 95% CI: 1.08-1.82, heterogeneity: I2 = 43%) [31].
Interestingly, the present study showed that patients with lean MASLD compared to non-lean MASLD had a higher rate of atherogenic dyslipidaemia, a lower rate of hypertension and a similar rate of T2DM or prediabetes conditions. Metabolic disorders are typical comorbidities of obesity. However, these disorders have also been reported to occur to varying degrees in normal-weight patients among different populations. Most patients with lean MASLD had only one criterion for the diagnosis of MASLD. Wijarnpreecha et al. [30] also noted that T2DM occurred with a similar frequency in patients with lean NAFLD and non-lean NAFLD. The present study showed that the predictors of MASLD differed between normal weight and overweight/obese patients. The following factors predisposed to lean MASLD: atherogenic dyslipidaemia, T2DM or prediabetes conditions and arterial hypertension. Interestingly, T2DM or prediabetes conditions were not a predictor of non-lean MASLD. It is a common metabolic feature in individuals with MASLD. Over the past few years, there has been significant interest in exploring the connection between dyslipidaemia and MASLD. However, there needs to be more reporting on the specific attributes of serum lipid profiles in lean NAFLD patients. Kim et al. reported that hypertriglyceridaemia was an independent predictor for the development and prognosis of NAFLD and suggested that serum triglyceride level could be an early marker for the progression of NAFLD, especially in lean patients [32].
In conclusion, data on the clinical spectrum and outcomes among lean MASLD compared to overweight/obese MASLD are scanty and controversial. Further research on lean MASLD is necessary to understand the disease and implement appropriate therapeutic treatment.
Limitations
There are several limitations in this study. The main limitation is the specific population included in the presented study – a population treated with cholecystectomy for gallstone disease. Hence, these sample results should not be extrapolated externally, although the incidence of MASLD in this study is similar to the general population. It should be noted that the present study was dominated by women, which may have an impact on the results obtained. As is the case for all retrospective studies, potential unidentified confounders exist. We could not adjust for individual-level socioeconomic status or for the time of duration and progression of diabetes mellitus in the study group. Waist circumference data were not available. Another limitation of our study is that data on some of the variables were not available for all of the patients (i.e. laboratory data), even though the sensitivity analysis did not reveal any differences.
Conclusions
Although excessive body weight is a significant risk factor for MASLD, lean MASLD is also very common. The clinical picture of lean MASLD differs from the clinical picture of MASLD associated with overweight/obesity. Since atherogenic dyslipidaemia is a strong predictor of lean MASLD, MASLD should be actively sought in patients with atherogenic dyslipidaemia. It seems that in the lean MASLD population, some patients have significant metabolic abnormalities that are associated with a higher cardiovascular risk and liver disease progression (steatohepatitis and fibrosis), even in the absence of overweight/obesity.


