
Summary
Although obesity is a known predictor of coronary artery disease, the relationship between obesity and coronary artery lesion complexity is complex. This is called the obesity paradox. In our study, in order to better analyze obesity, we analyzed body components with the TANITA device and revealed its relationship with coronary complexity and total body and regional fat ratios. Internal fat, trunk fat percentage and metabolic age parameters showed close correlation with coronary artery lesion complexity.
Introduction
Coronary artery disease (CAD) is known as an important cause of mortality and morbidity worldwide. Identifying reversible risk factors and treating them early is an important step in the fight against CAD. Among these risk factors, the main ones are: hypertension, diabetes mellitus, smoking, sedentary life, psychosocial stress and obesity [1]. Obesity is thought to cause an increase in CAD through many factors such as dyslipidemia, metabolic syndrome, susceptibility to insulin resistance, and increased thrombogenic activity resulting from impaired endothelial functions [2]. In addition, pro-inflammatory cytokines produced directly by the fat tissue itself are an important factor that can cause the formation of atherosclerotic plaques [3].
The most commonly used parameter in classifying obesity is body mass index (BMI). Since the importance of waist circumference in terms of showing visceral fat is known, the waist-hip ratio and waist-height ratio have been shown to be important indicators of obesity and metabolic and cardiovascular diseases that will develop due to obesity [4, 5]. In order to better understand obesity, the use of the TANITA device, which can analyze body components using the bioelectrical impedance method, has become an increasingly common method in social life and scientific studies [6]. With the measurements made with the TANITA device, parameters such as total body fat weight, fat-free mass, regional fat weight, body regional water and muscle weight, internal fat and metabolic age are calculated [7, 8].
While simple lesions are sometimes detected with coronary angiography in CAD patients, sometimes widespread lesions in multiple vessels are detected. The most commonly used method to calculate coronary artery lesion complexity has taken its place in the literature [9] as SYNTAX score (SXscore).
Aim
In this study, we investigate the relationship between body fat, water and muscle measurements measured by TANITA and SXscore, which is an indicator of coronary artery disease complexity, in acute coronary syndrome patients.
Material and methods
Study design and population
Our study is a single-center, prospective study. Patients who were admitted to the coronary intensive care unit of our clinic for 6 months with the diagnosis of acute subendocardial myocardial infarction were evaluated for our study. Exclusion criteria in our study: previous known history of CAD, heart failure, cardiogenic shock, acute pulmonary edema, active infection, history of hematological or chronic inflammatory disease, and malignancies. Additionally, patients who required urgent (< 2 h) coronary angiography were also excluded from the study. After the patients determined according to the exclusion criteria were excluded from the study, 200 patients were included in the study and the demographic data and drug use history of these patients were recorded.
Dyslipidemia was defined as a total cholesterol level above 200 mg/dl and/or use of lipid-lowering medication. Hypertension (HT) was defined as patients whose blood pressure (systolic blood pressure/diastolic blood pressure) was over 140/60 or in whom any antihypertensive medication was started regularly due to previous high blood pressure. Diabetes mellitus (DM) was defined as a fasting glucose level above 126 mg/dl, a glucose level above 200 mg/dl at any time, and/or the use of antidiabetic medication. Smokers include patients who are active smokers or have smoked for at least 10 years and have recently quit. Non-smokers are patients who do not smoke.
Before coronary angiography, the patients’ body analyses were performed and recorded with the TANITA device in the coronary intensive care unit. Then, coronary angiography was performed on the patients, in accordance with current guidelines and without any delay caused by our study. The study protocol was approved by the local ethics committee in accordance with the Declaration of Helsinki and good clinical practice.
Laboratory and echocardiographic evaluation
Blood was taken from the patients’ peripheral vein before coronary angiography; complete blood count, fasting blood glucose, kidney function tests, liver function tests, lipid panel, C-reactive protein (CRP), total protein and albumin were checked. Complete blood count was measured automatically using the Mindray BC-5800 (Mindray Medical Electronics Co. Shenzhen, China) automatic hematology analyzer. All data of the patients were obtained and recorded using the hospital database.
Echocardiographic examination was performed with the Philips EpiQ-7 system (X5 probe, Philips® MedicalSystems, Andover, MA). Images of the patients were taken with a 3.5 MHz transuder. Left ventricular ejection fraction (LV-EF) was calculated using Simpson’s method. In the parasternal long axis view, left atrium (LA), left ventricular end-diastolic diameter (LV-EDD), left ventricular end-systolic diameter (LV-ESD), interventricular septum (IVS), and posterior wall (PW) were measured. In the apical 4-chamber view, early diastolic wave (E), late diastolic wave (A) velocities, which are transmitral flow recordings via pulse-doppler, and early diastolic myocardial velocity (E’) obtained from the mitral lateral annulus with tissue Doppler imaging (TDI), were calculated.
Coronary angiography and Syntax Score
All patients included in the study were taken to the coronary angiography laboratory at a time and with indications in accordance with current guidelines [10]. Selective coronary angiographies were performed on the patients using the femoral approach and Judkins technique with the help of 6 French (F) and 7F catheters. Angiograms were evaluated visually and quantitatively by two expert interventional cardiologists by reaching consensus. Vessels with stenosis of 50% or more and a vessel diameter larger than 1.5 mm were considered suitable for scoring. Coronary dominance and the region of coronary anatomical lesions were determined by the operators and SXscore was calculated via https://syntaxscore.org/calculator. In the study, those with an SXscore of 22 and above were considered to have a high SXscore. Those with SXscore < 22 were considered as low-medium SXscore [11].
Body component measurements
The patients were monitored by the TANITA BC-601 (Tanita Corporation of America, Inc, Arlington Heights, IL) device, which was brought to the bedside during coronary intensive care follow-ups, and measurements were taken in the presence of a coronary intensive care doctor, nurse and physiotherapist. In addition to measurements of height (cm), weight (kg), waist circumference (cm), hip circumference (cm), TANITA also measures total fat weight, total fat percentage, trunk fat weight, trunk fat percentage, total muscle mass, trunk muscle mass, and water weight. Detailed parameter measurements such as water percentage, fat-free weight, bone mass, internal fat and metabolic age were recorded.
Statistical analysis
SPSS 20.0 for Windows (SPSS Inc., Chicago, IL, USA) was used for statistical analyses. Patients were divided into two groups according to SXscore: high SXscore and low-medium SXscore. Kolmogorov-Smirnov and homogeneity of variances tests were performed to examine parametric and non-parametric distributions of the data. Independent samples t test for two group comparisons of variables with parametric distribution; Mann-Whitney U test was used for two-group comparison of variables that did not show parametric distribution. Categorical variables were compared using the χ2 test. Parametric continuous variables were expressed as mean + standard deviation. Non-parametric variables were expressed with median, minimum and maximum values. Categorical variables were presented as numbers and percentages. Pearson and Spearman correlation analysis was used to evaluate the relationship between body composition parameters and SXscore. Multivariable logistic regression analysis was performed to detect parameters predictive of increased SXscore. Predictors were determined by the multivariable logistic regression test. Receiver operating characteristic (ROC) analysis was used to determine the cut-off levels, specificity and sensitivity of TANITA parameters that could predict detecting a high SXscore. A p < 0.05 was considered statistically significant.
Results
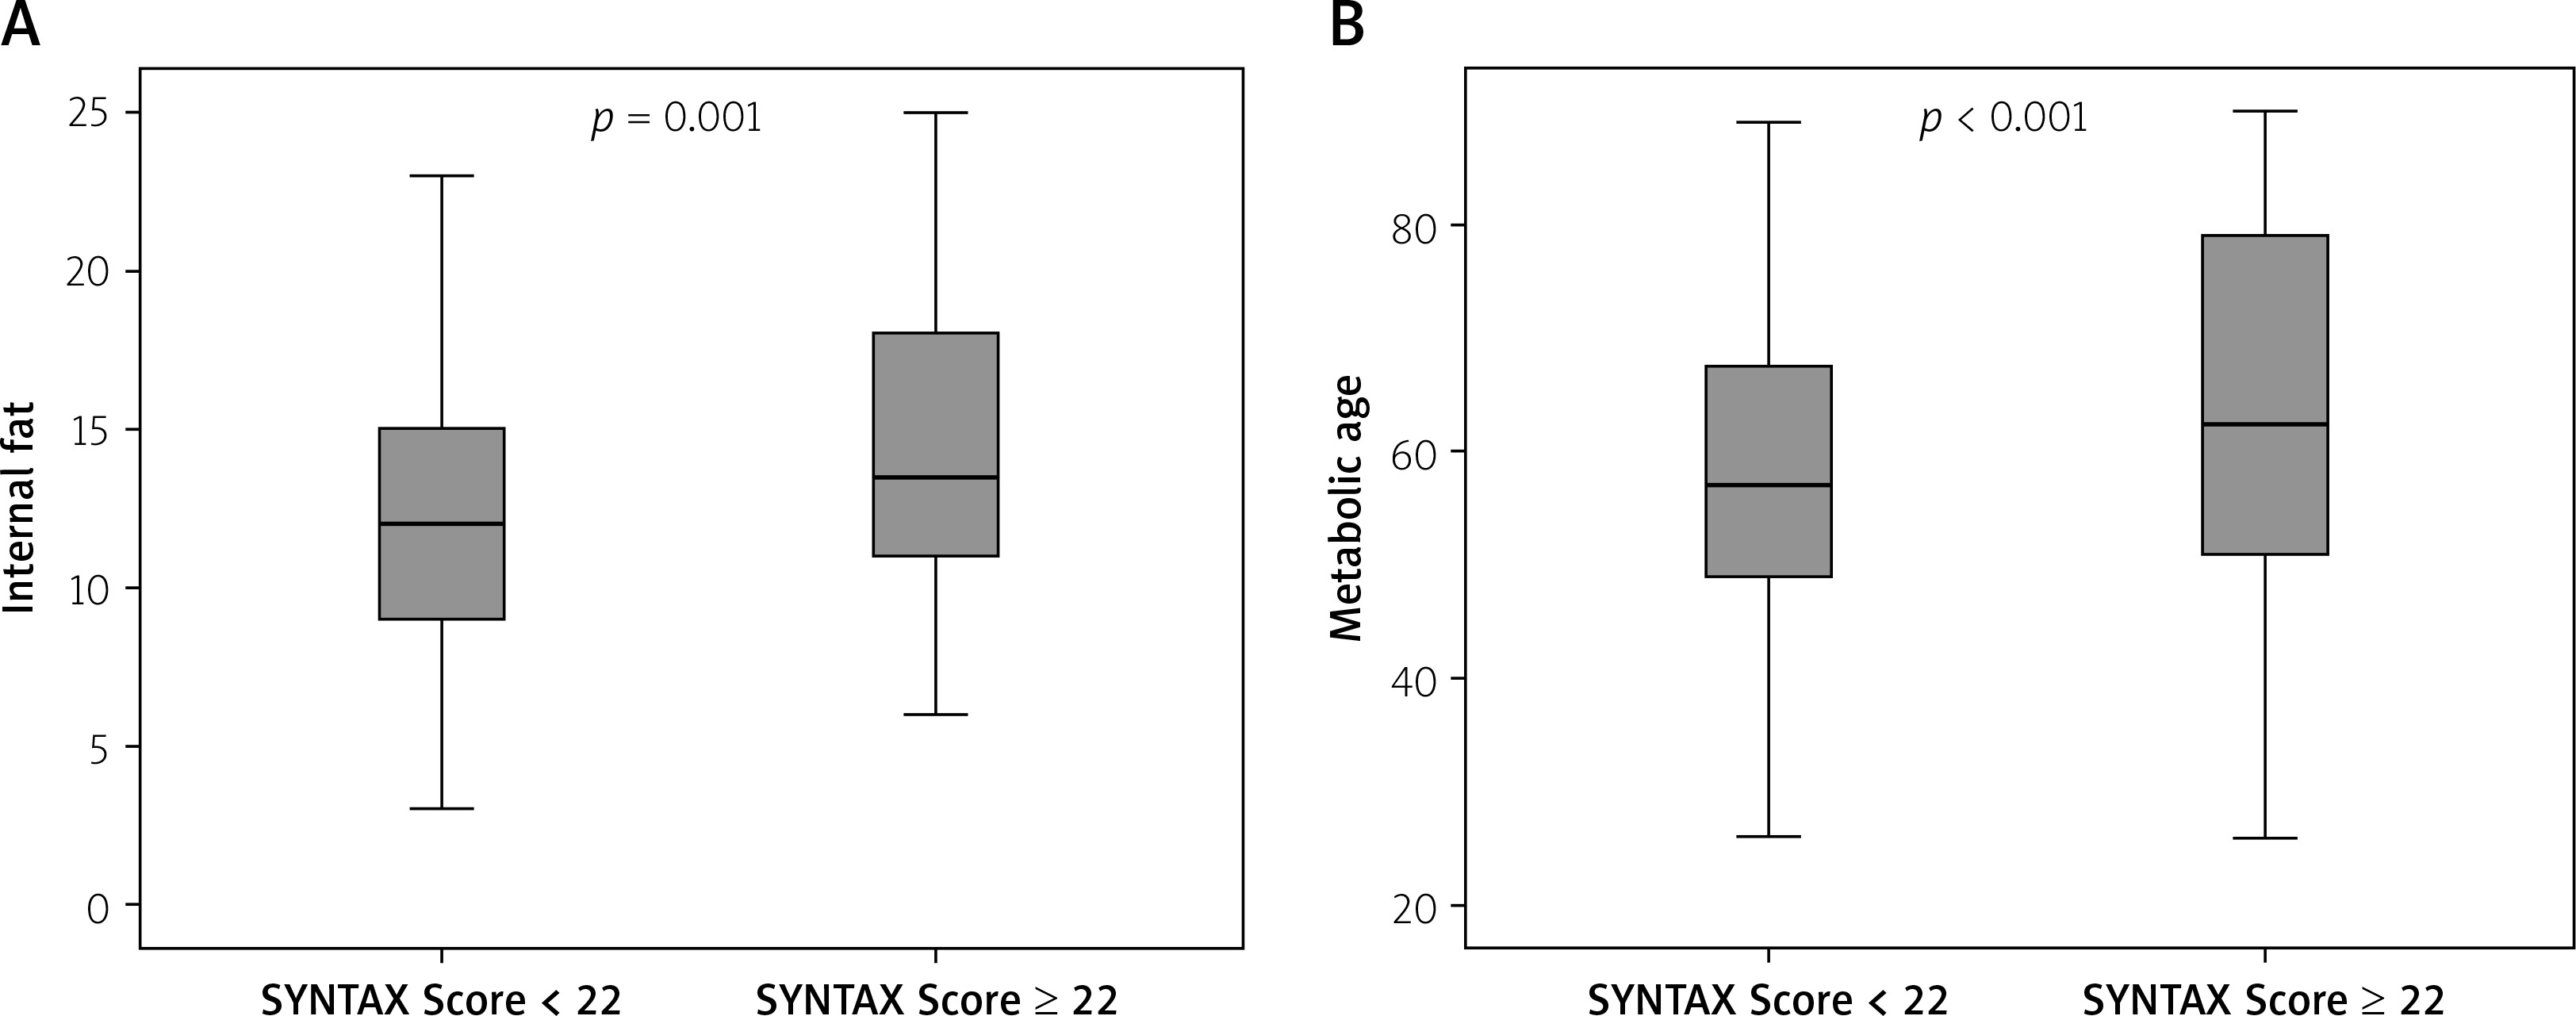
A total of 200 patients were included in our study. Fifty patients with high SXscore (12 women and 38 men; mean age 64.64 ±12.16 years) and 150 patients with low-medium SXscore (40 women and 110 men; mean age 59.88 ±10.99 years) were found. Demographic characteristics and drug use histories of the individuals included in the study are given in Table I. Age (p = 0.001) was found to be higher in the high SXscore group. Comparison of the laboratory and echocardiographic parameters of the patients is given in Table II. Between the two groups, hematocrit (p = 0.037), creatine (p = 0.019), GFR (p = 0.002), albumin (p = 0.012), triglyceride (p = 0.013), E wave (p = 0.025), A wave (p = 0.013), a statistical difference was detected. Body composition parameters calculated with TANITA are compared in Table III. For waist height ratio (p = 0.001), total fat weight (p = 0.001), total fat percentage (p = 0.006), total water percentage (p = 0.001), trunk fat percentage (p = 0.001), internal fat (p = 0.001) and metabolic age (p < 0.001), a statistical difference was found between the groups in the parameters (Figures 1 A, B). No significant difference was detected between other parameters. Correlation analysis data are given in Table IV. A correlation was detected between SXscore and the waist height ratio (p = 0.042), trunk fat percentage (p = 0.047), internal fat (p < 0.001) and metabolic age (p = 0.009).
Table I
Clinical characteristics of the study population
| Parameter | Syntax Score < 22 N = 150 | Syntax Score ≥ 22 N = 50 | P-value |
|---|---|---|---|
| Age [years] | 60 (38–90) | 66 (34–79) | 0.001a |
| Gender (F/M) (n) | 40/110 | 12/38 | 0.710c |
| Hypertension (n) | 72 | 24 | 0.990c |
| Family history (n) | 10 | 1 | 0.261c |
| Smoking (n) | 64 | 26 | 0.251c |
| Diabetes mellitus (n) | 28 | 12 | 0.414c |
| Hyperlipidemia (n) | 4 | 2 | 0.632c |
| ACEi (n) | 46 | 16 | 0.860c |
| ARB (n) | 18 | 4 | 0.434c |
| HTZ (n) | 30 | 10 | 0.704c |
| β-blocker (n) | 6 | 0 | 0.151c |
| CCB (n) | 26 | 8 | 0.828c |
| ASA (n) | 14 | 6 | 0.586c |
| α-blocker (n) | 2 | 3 | 0.135c |
| Statin (n) | 6 | 4 | 0.139c |
| Oral Antidiabetic (n) | 28 | 12 | 0.414c |
Table II
Comparison of laboratory and echocardiography parameters
| Parameter | Syntax Score < 22 | Syntax Score ≥ 22 | P-value |
|---|---|---|---|
| Hemoglobin [g/dl] | 14.16 ±1.94 | 13.8 ±1.84 | 0.249a |
| Hematocrit [%] | 42.6 (25.6–58) | 40.9 (33.5–51) | 0.037b |
| White blood cells [× 109/l] | 8.4 (3.4–21.7) | 7.1 (5.37–15.7) | 0.231b |
| Platelet [× 109/l] | 237.46 ±62.07 | 235 ±55.41 | 0.803a |
| Neutrophil count [× 109/l] | 5.26 (1.89–19.95) | 4.79 (2.5–13.5) | 0.722b |
| Lymphocyte count [×109/l] | 2.29 ±0.88 | 2.09 ±0.59 | 0.114a |
| Glucose [mg/dl] | 118 (77–430) | 116 (92–257) | 0.576b |
| Urea [mg/dl] | 35.89 ±8.87 | 40.610.54 | 0.355a |
| Creatine [mg/dl] | 0.83 (0.57–1.40) | 0.9 (0.64–1.42) | 0.019b |
| GFR | 88.26 ±17.56 | 78.92 ±18.12 | 0.002a |
| Total protein [g/l] | 70.92 ±5.99 | 69.08 ±5.48 | 0.085a |
| Albumin [g/dl] | 41.11 ±3.44 | 39.3 ±5.37 | 0.012a |
| LDL [mg/dl] | 129.24 ±42.16 | 135.19 ±39.45 | 0.366a |
| HDL [mg/dl] | 42 (28–80) | 43 (25.7–83) | 0.229b |
| Triglyceride [mg/dl] | 128.30 ±94.27 | 173.75 ±111.03 | 0.013a |
| Total cholesterol [mg/dl] | 200.13 ±49.14 | 201.0 ±49.25 | 0.918a |
| CRP [mg/l] | 2.45 (0.1–26) | 2.04 (0.1–32) | 0.289b |
| ALT [IU/l] | 26 (10–75) | 25 (14–100) | 0.799b |
| AST [IU/l] | 34 (12–168) | 32 (13–105) | 0.881b |
| Uric acid [mg/dl] | 5.8 ±1.71 | 6.25 ±1.28 | 0.240a |
| Sodium [mmol/l] | 138 (132–143) | 137 (129–141) | 0.208b |
| Potassium [mmol/l] | 4.1 (3.2–5.1) | 4 (3.1–4.7) | 0.188b |
| Magnesium [mmol/l] | 1.90 (1.46–2.95) | 1.8 (1.44–2.31) | 0.409b |
| Calcium [mmol/l] | 8.79 ±0.45 | 8.8 ±0.5 | 0.885a |
| LV-EF [%] | 60 (30–65) | 60 (45–60) | 0.305b |
| LA [mm] | 36.87 ±4.26 | 37.60 ±3.7 | 0.342a |
| LV-EDD [mm] | 47 (41–56) | 48 (43–54) | 0.100b |
| LV-ESD [mm] | 29 (22–45) | 30 (26–38) | 0.184b |
| IVS [mm] | 12 (8–15) | 12 (10–16) | 0.589b |
| PW [mm] | 11 (9–13) | 12 (8–13) | 0.480b |
| E [cm/s] | 67.5 (40–95) | 60 (30–128) | 0.025b |
| A [cm/s] | 74.18 ±18.32 | 82.95 ±23.32 | 0.013a |
| E/A | 0.75 (0.50–2) | 0.76 (0.47–1.5) | 0.930b |
| E’[cm/s] | 10 ±2.73 | 9.66 ±1.03 | 0.777a |
b Mann-Whitney U test. A – late diastolic wave, ALT – alanine transaminase, AST – aspartate aminotransferase, CRP – C-reactive protein, E – early diastolic wave, E’ – early diastolic myocardial velocity, GFR – glomerular filtration rate, HDL – high-density lipoprotein, IVS – interventricular septum, LA – left atrium, LDL – low-density lipoprotein, LV-EDD – left ventricular end-diastolic diameter, LV-EF – left ventricular ejection fraction, LV-ESC – left ventricular end-systolic diameter, PW – posterior wall.
Table III
Comparison of body composition (TANITA) parameters
| Parameter | Syntax Score < 22 | Syntax Score ≥ 22 | P-value |
|---|---|---|---|
| Height [cm] | 169 (149–187) | 169 (153–177) | 0.490a |
| Weight [kg] | 80.27 ±14.38 | 87.64 ±17.24 | 0.158b |
| BMI [kg/m2] | 28.6 ±5.03 | 29.5 ±5.84 | 0.251b |
| Waist circumference | 102.5 ±11.63 | 109.62 ±13.47 | 0.026 |
| Waist hip ratio | 0.98 ±0.06 | 0.99 ±0.04 | 0.258b |
| Waist height ratio | 0.61 ±0.77 | 0.66 ±0.86 | 0.002b |
| Total fat weight [kg] | 22.91 ±9.42 | 28.91 ±13.25 | 0.001b |
| Total fat percentage [%] | 27.84 ±8.59 | 32 ±10.57 | 0.006b |
| Total water weight [kg] | 41.56 ±6.82 | 42.53 ±7.86 | 0.355b |
| Total water percentage [%] | 52.09 ±5.99 | 49.2 ±7.27 | 0.006b |
| Total muscle weight [kg] | 54.52 ±9.01 | 55.79 ±10.17 | 0.831b |
| Trunk fat percentage [%] | 27.68 ±8.21 | 32.64 ±9.94 | 0.001b |
| Trunk muscle weight [kg] | 30.27 ±4.46 | 30.52 ±4.99 | 0.741b |
| Internal fat | 12 (3–23) | 14 (6–25) | 0.001a |
| Metabolic age [years] | 57.91 ±13.21 | 66.6 ±18.64 | < 0.001b |
| Fat-free weight [kg] | 57.36 ±9.44 | 58.72 ±10.68 | 0.395b |
| Bone mass [kg] | 2.88 ±0.44 | 2.93 ±0.5 | 0.536b |
Table IV
Correlation analysis between body composition parameters SYNTAX scores
Figure 1
A – Internal fat distribution according to high and low-medium SYNTAX score. B – Metabolic age distribution according to high and low-medium SYNTAX score
In Table V, univariable regression analysis was performed on all parameters to determine the predictors of increased SXscore. The significant parameters were taken into multivariable regression analysis. In the multivariable regression analysis (Table V right column), age (p = 0.032), internal fat (p = 0.026) and metabolic age (p = 0.048) were evaluated as independent predictors of increased SXscore.
Table V
Univariable and multivariable regression analysis showing the relationship between SXscore and parameters
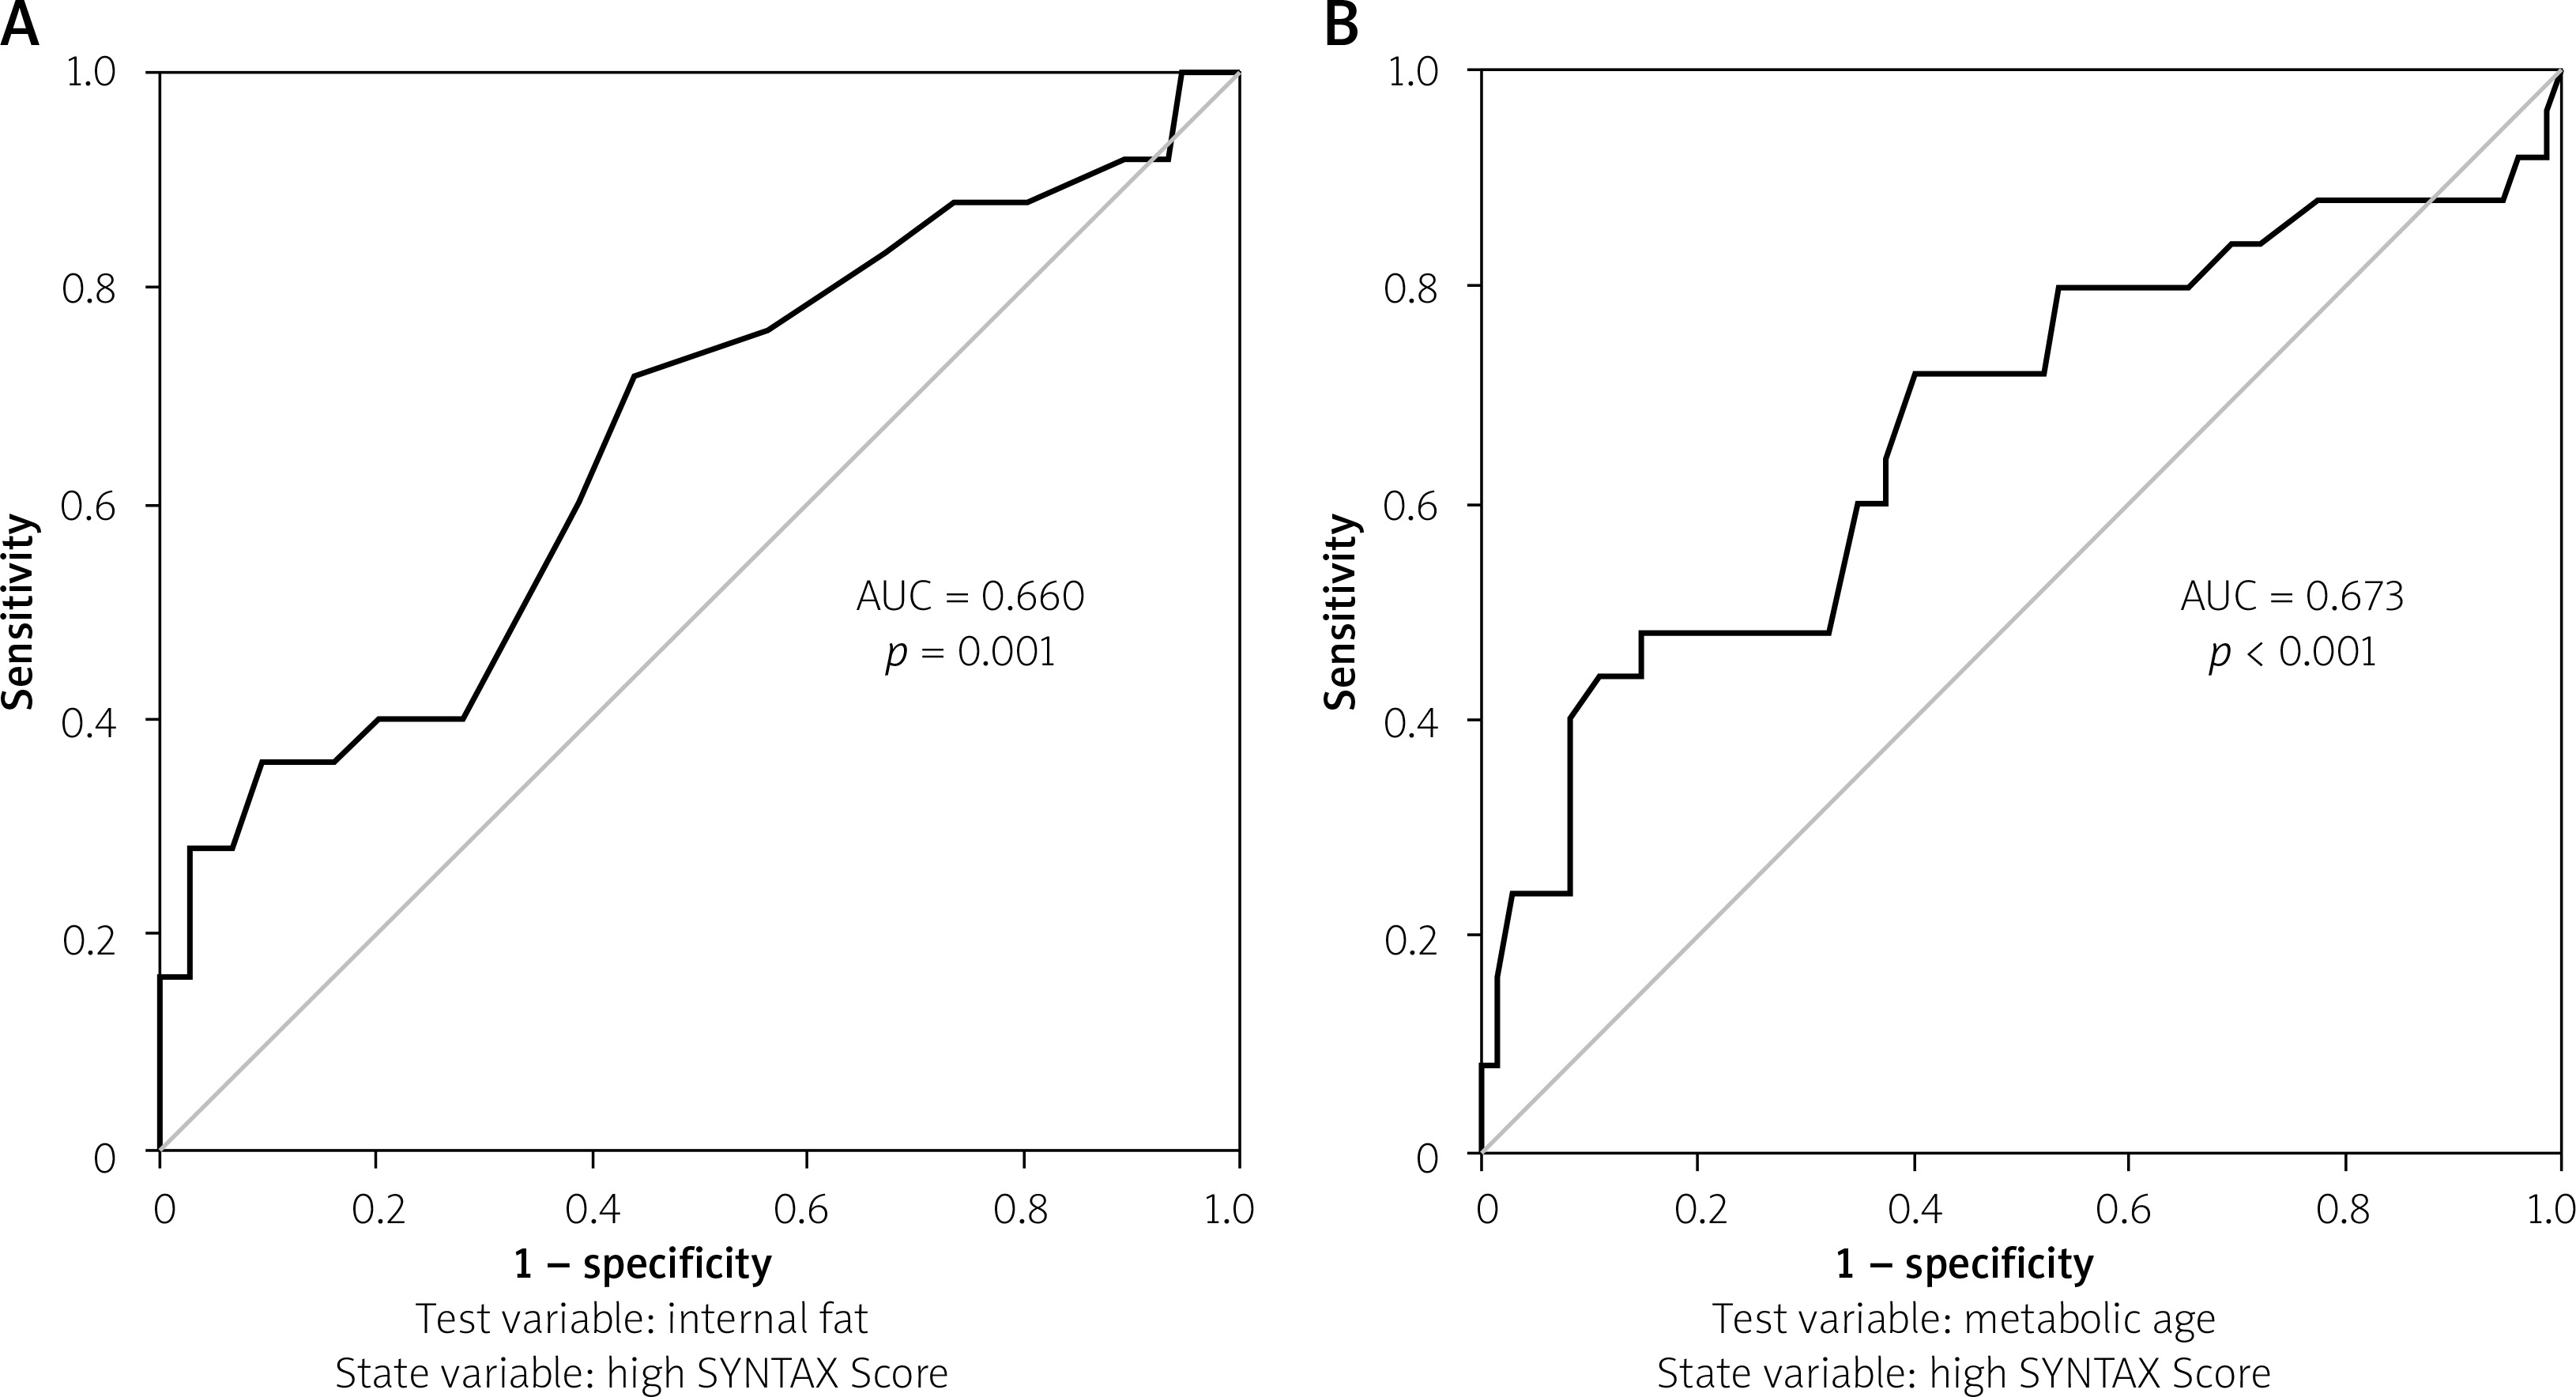
ROC curve analysis for prediction of high SXscore detection: the cut-off value for internal fat was found to be 13.5 with 60% sensitivity and 61.3% specificity (area under curve: 0.660, 95% CI: 0.568–0.752, p = 0.001; Figure 2 A); The cut-off value for metabolic age was found to be 60.5 years with 64% sensitivity and 62.7% specificity (area under curve: 0.673, 95% CI: 0.577–0.768, p < 0.001; Figure 2 B).
Discussion
In this study, we showed the relationship between body component parameters calculated with TANITA and SXscore, an indicator of coronary complexity. TANITA devices are technological products that we frequently encounter in our daily lives in hospitals, gyms and wellness centers and whose use is increasing.
In our study, using TANITA, patients with high SXscore were observed to have increased fat weight, total fat percentage, trunk fat percentage, internal fat, metabolic age and decreased total water percentage. Obesity: it is accepted as a predictive parameter for cardiovascular diseases through the increased fat amount and many other accompanying metabolic diseases [12]. However, in recent years, the relationship between the complexity of coronary artery disease and obesity has begun to be discussed, and the obesity paradox has been the subject of frequent studies in the literature [13]. Considering that the obesity criteria calculated by BMI are insufficient, waist circumference was used in particular; different parameters such as the waist-hip ratio, waist-height ratio, and relative fat mass index have been tried to be used [14]. In order to explain this obesity paradox, we used the TANITA device, which analyzes body component parameters in detail. In our study, we identified parameters such as “internal fat and metabolic age” that can better distinguish coronary complexity, which cannot be distinguished by BMI. When we look at the correlation of internal fat with high SXscore, the correlation coefficient was 0.254, p < 0.001. There was a clear superiority of internal fat compared to BMI or other routinely used obesity indices. Apart from internal fat, trunk fat percentage and metabolic age also attract statistical attention. Although the total fat percentage was found to be higher in the group with high SXscore, the correlation between them was not significant. However, the correlation of trunk fat percentage, calculated by excluding the extremities from the total body area, with SXscore was found to be significant. This shows that, as shown by studies, the relationship between visceral obesity and cardiovascular diseases is more important than normal obesity criteria [15, 16].
Internal fat and metabolic age are seen as programmatic parameters given to us by the TANITA device. Studies have been conducted to show that TANITA is reliable and usable [17]. In their study published in October 2023, Parker et al. made a comparison between dual-energy X-ray absorptiometry and TANITA in calculating body composition measurements and stated that TANITA can be used [18]. In addition, when looking at current publications, the TANITA device is frequently used in studies on metabolic disorders or in studies on body analysis data of healthy populations [19–21].
Apart from TANITA parameters, the relationship between waist-to-height ratio and high SXscore is also seen in Table IV. It was shown in our study that it is more correlated with coronary complexity compared to classical parameters such as BMI and the waist-hip ratio. Yalcin et al. found in their publication in 2020 that the correlation between the waist-to-height ratio and patients with severe CAD is similar to our study and supports each other [22].
In our study, low hematocrit, increased kidney function tests, increased triglyceride values, decreased albumin and impaired diastolic dysfunction parameters are different parameters in the low-medium and high SXscore groups. The relationship between kidney functions and SXscore was revealed in the study conducted by Yan et al. [23]. When the relationship between albumin and CAD was examined, Kurtul et al. in their study observed that low serum albumin levels were associated with increased SX score and mortality [24]. When diastolic dysfunction parameters are examined, it is observed in our study that the E wave decreases and the A wave increases. Our study appears to be compatible with publications in the literature regarding diastolic dysfunction and SXscore [25, 26].
Particularly acute subendocardial myocardial infarction patients were included in our study, and the patient group requiring urgent coronary angiography was not included in the study. Subendocardial myocardial infarction patients constituted a suitable population for our study because they are candidates for more extensive vascular disease and more metabolic diseases. In order to obtain a more objective result, the SXscore cut-off value was chosen as 22, which is generally taken in studies.
Study limitations
Our study is a single-center study with a limited patient population. Moreover, due to the study design, it is insufficient to elucidate pathophysiological processes. Although there are many studies using the TANITA device, it is known that its parameters are calculated with programmatic software support, and there is still a need for studies comparing its correlation with different methods.
Conclusions
In this study, we revealed the relationship between parameters such as internal fat, trunk fat percentage and metabolic age, which can be calculated with the TANITA device, which we encounter in many places in daily life, and SXscore, which is the coronary complexity score. We recommend that individuals whose TANITA measurements are found to be above the limit values in examinations carried out in gyms and healthy living centers should be given more importance to primary preventive medical measures and should be directed to outpatient clinic controls for early treatment options.


