
Introduction
The seroprevalence of hepatitis C virus (HCV) in Egypt was reported to be 10% [1, 2]. Schistosomiasis, a common condition in Egypt, is characterized by the formation of a granulomatous inflammatory reaction, which leads to periportal fibrosis formation [3]. Management of patients with HCV is contingent on the intensity of fibrosis, which is established by using acoustic radiation force impulse imaging (ARFI), a non-invasive technique. It utilizes focused acoustic beams to intra-convert acoustic compressional waves to shear waves [1].
The grade of the stiffness of the liver and spleen in chronic HCV patients (with and without schistosomiasis) was assessed and correlated with the histopathological changes.
Material and methods
This is a pilot study that was conducted on 50 Egyptian chronic HCV patients classified into two groups. Group A consisted of 25 patients with chronic HCV while group B comprised 25 patients with chronic HCV co-infected with schistosomiasis.
All patients’ sera were positive for circulating HCV antibodies and HCV RNA and all had histopathological findings consistent with chronic hepatitis (CHC). Patients in group B tested positive for human serum anti-schistosomal antibody and exhibited peri-portal thickening (PPT) in the ultrasonographic examination. As a control group, 25 healthy, age- and sex-matched subjects with no evidence of liver disease were recruited to establish normal ARFI elastography of the liver and spleen.
The study was conducted per the provisions of the Declaration of Helsinki and Good Clinical Practice guidelines. Institutional Review Board approval was obtained prior to study initiation. Informed consent was obtained from all study participants. Exclusion criteria included coinfection with hepatitis B virus, history of alcohol consumption, known causes of chronic liver disease, chronic disorders such as cardiac diseases, diabetes mellitus, hyperlipidaemia, malignancies, and connective tissue, infectious or inflammatory disorders.
Screening procedures consisted of full medical history, physical examination, laboratory investigations including complete blood count (CBC), serum aspartate aminotransferase (AST), alanine aminotransferase (ALT), serum albumin, serum bilirubin, and serum γ-glutamyl transpeptidase (GGT) and prothrombin time (PT), HCV antibody, hepatitis B surface antigen and hepatitis B core antibody using ELISA, and serum anti-schistosomal antibodies using the enzyme-linked immunosorbent assay (ELISA). PCR assay was used to determine the HCV RNA level utilizing the TaqMan technology from Applied Biosystems and the automated extractor QIA cube (ABI PRISM 7500 sequence detection system).
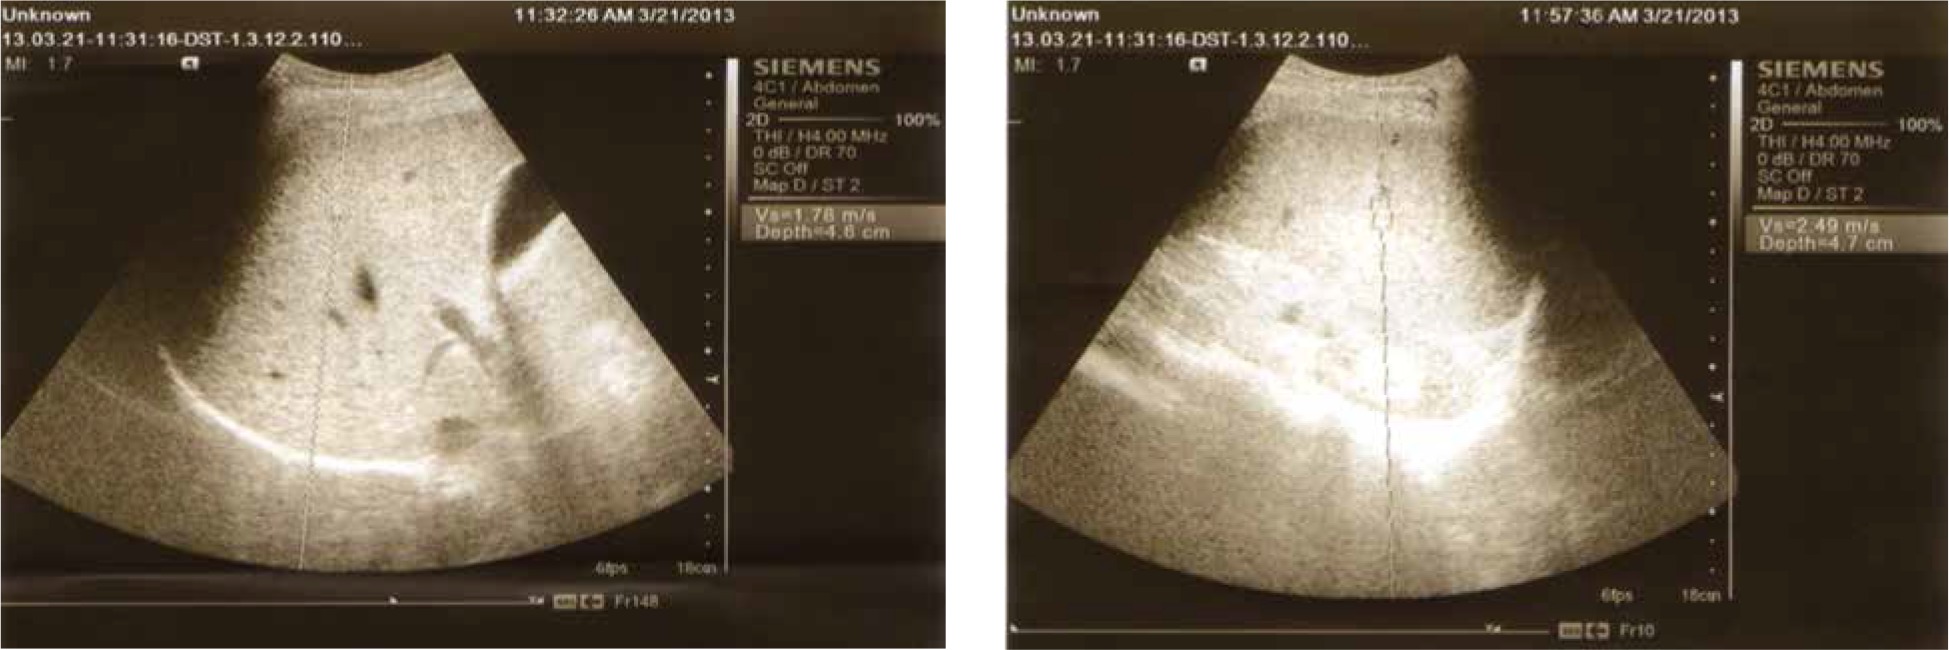
Abdominal ultrasound was performed in all participants to assess the liver and spleen size and determine PPT. All subjects underwent ARFI elastography using a Siemens Acuson S3000 Virtual Touch ultrasound system (Siemens AG, Erlangen, Germany) employing a 4CI transducer. The shear waves generated by the acoustic pulse propagates into the tissue and is directed to the side of a region of interest (ROI); their speed is measured in meters per second. The examination was carried out by the intercostal approach in the right liver lobe, 1-2 cm under the liver capsule; while the patient was fasting, in the supine position and with the right arm fully abducted. The patient was asked to hold the breath for a moment. The mean of 8-10 valid measurements was determined (Fig. 1). All participants were assessed by the same operator who conducted the sonographic and ARFI screening to avoid inter-observer variability.
Histopathological evaluation
Using a semi-automatic true-cut needle (16 G), both groups (not the control group) were subjected to core liver biopsies on the same day following ARFI elastography. Specimens were fixed in a 10% solution of formalin and embedded in paraffin. Tissue sections were subsequently stained with haematoxylin-eosin and trichrome stains for histopathological diagnosis, assessment of the degree of necro-inflammatory activity (grading) and extent of fibrosis (staging) according to the METAVIR scoring system. Fibrosis was staged on a 0-4 scale: F0 – no fibrosis, F1 – portal fibrosis without septa, F2 – portal fibrosis with a few septa extending into lobules, F3 – numerous septa extending to adjacent portal tracts or terminal hepatic venules, and F4 – cirrhosis.
Statistical analysis
The collected data were analysed using SPSS version 11 software. Results were expressed as percentages, means and standard deviations (SD). Statistical tests used in the present study were the following: 1) Student’s t test as a test of significance for comparison between two arithmetic means; 2) the Mann-Whitney U-test for comparison between two means of non-normally distributed variables; 3) the Pearson correlation coefficient to evaluate the strength of correlation (r value) between continuous quantitative variables; 4) the Spearman rho correlation coefficient to detect the strength of correlation (r value) between discontinuous quantitative variables. The 5% level was chosen as the cut-off level of significance.
Results
The characteristics of the studied patients are presented in Table 1. Histopathological features were observed in all liver specimens including the presence of lymphoid aggregation in portal tracts, variable degrees of steatosis and bile duct proliferation as shown in Figures 2 and 3. According to the METAVIR scoring system in regards to the fibrosis stage, 12 (48%) patients in group A showed F1, 12 (48%) patients showed F2 and only one (4%) patient showed F3. Patients in group B were found to have a significant increase in the fibrosis stage, where six (24%) showed F1, 12 (48%) showed F2 and seven (28%) patients showed F3.
Table 1
Characteristic features of the studied groups
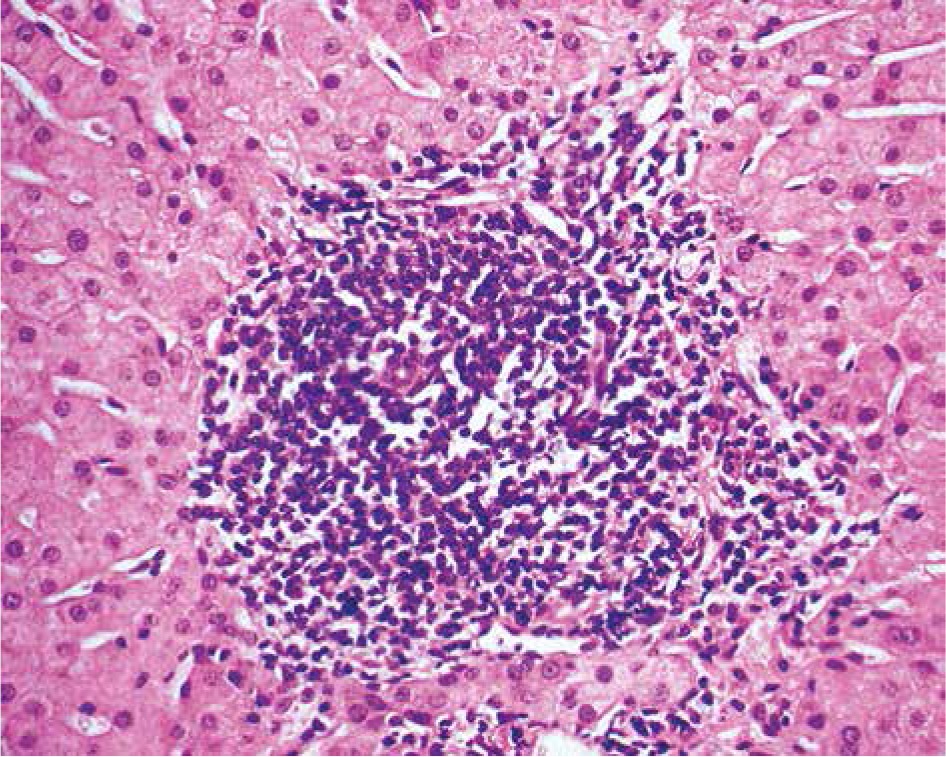
Fig. 3
Peri-portal fibrosis extending towards neighbouring portal triad and into the lobules (surrounded with arrows)
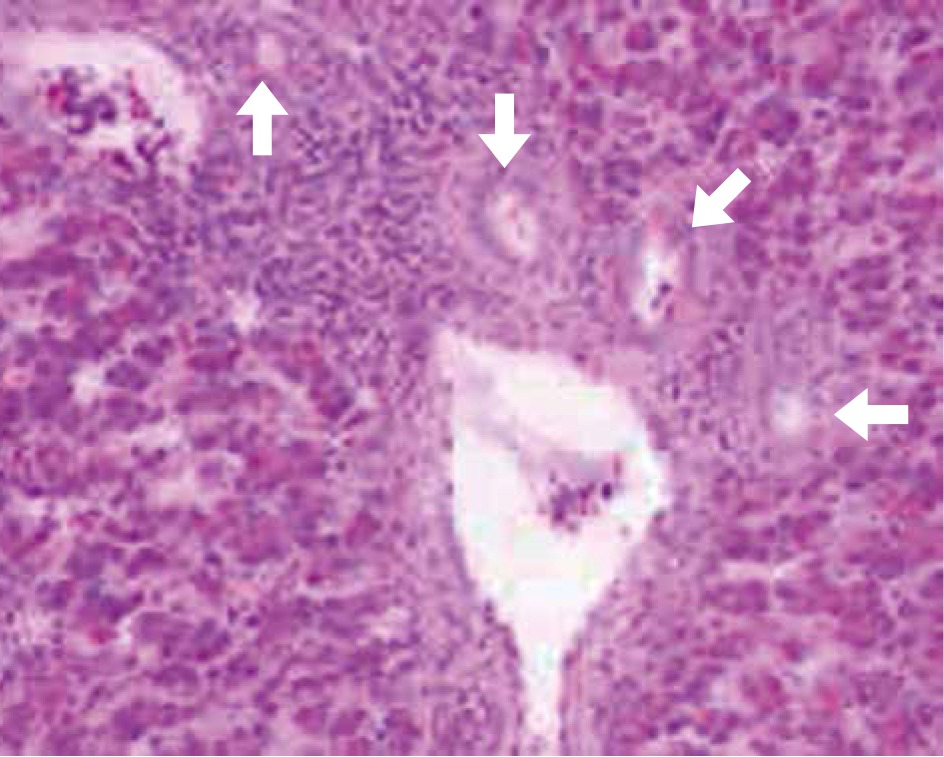
Table 2 represents the results of liver and spleen stiffness assessed by ARFI (ARFI L, ARFI S) in the studied subjects. ARFI L measured in group B patients has insignificantly higher values than that measured in patients with group A, while ARFI S measured in group B patients has significantly higher values than that measured in patients in group A (2.85 ±0.70, 2.46 ±0.41 respectively and p-value = 0.021).
Table 2
Liver and spleen stiffness assessed by ARFI in the studied subjects
Correlation of liver and spleen stiffness assessed by ARFI with the stage of fibrosis
Liver stiffness (ARFI L) in CHC (group A) patients who had stage 1 fibrosis (F1) ranged from 0.8 to 1.5 m/s (mean ±SD = 1.10 ±0.21) and in patients with significant fibrosis (F2 and F3) ARFI L ranged from 1.40 to 2.20 m/s (mean ±SD = 1.82 ±0.24). Taking a cut-off value of > 1.5 m/s for differentiation between significant and insignificant fibrosis, it has a sensitivity of 92.31%, a specificity of 100%, an accuracy of 96% (positive predictive value [PPV] of 100, negative predictive value [NPV] of 92.3) and an area under the curve (AUC) of 0.99 (p = 0.001) (Fig. 4), while in group B, ARFI L ranged from 0.70 to 1.30 m/s (mean ±SD = 1.09 ±0.25) in patients with F1. Meanwhile in patients with significant fibrosis, ARFI L ranged between 1.30 and 2.80 m/s (mean ±SD = 1.99 ±0.53). The sensitivity was 84.21%, the specificity was 100%, the accuracy was 84% (PPV of 100, NPV of 66.6) and AUC of 0.96 (p = 0.001), when taking the cut-off point of > 1.3 m/s (Fig. 5).
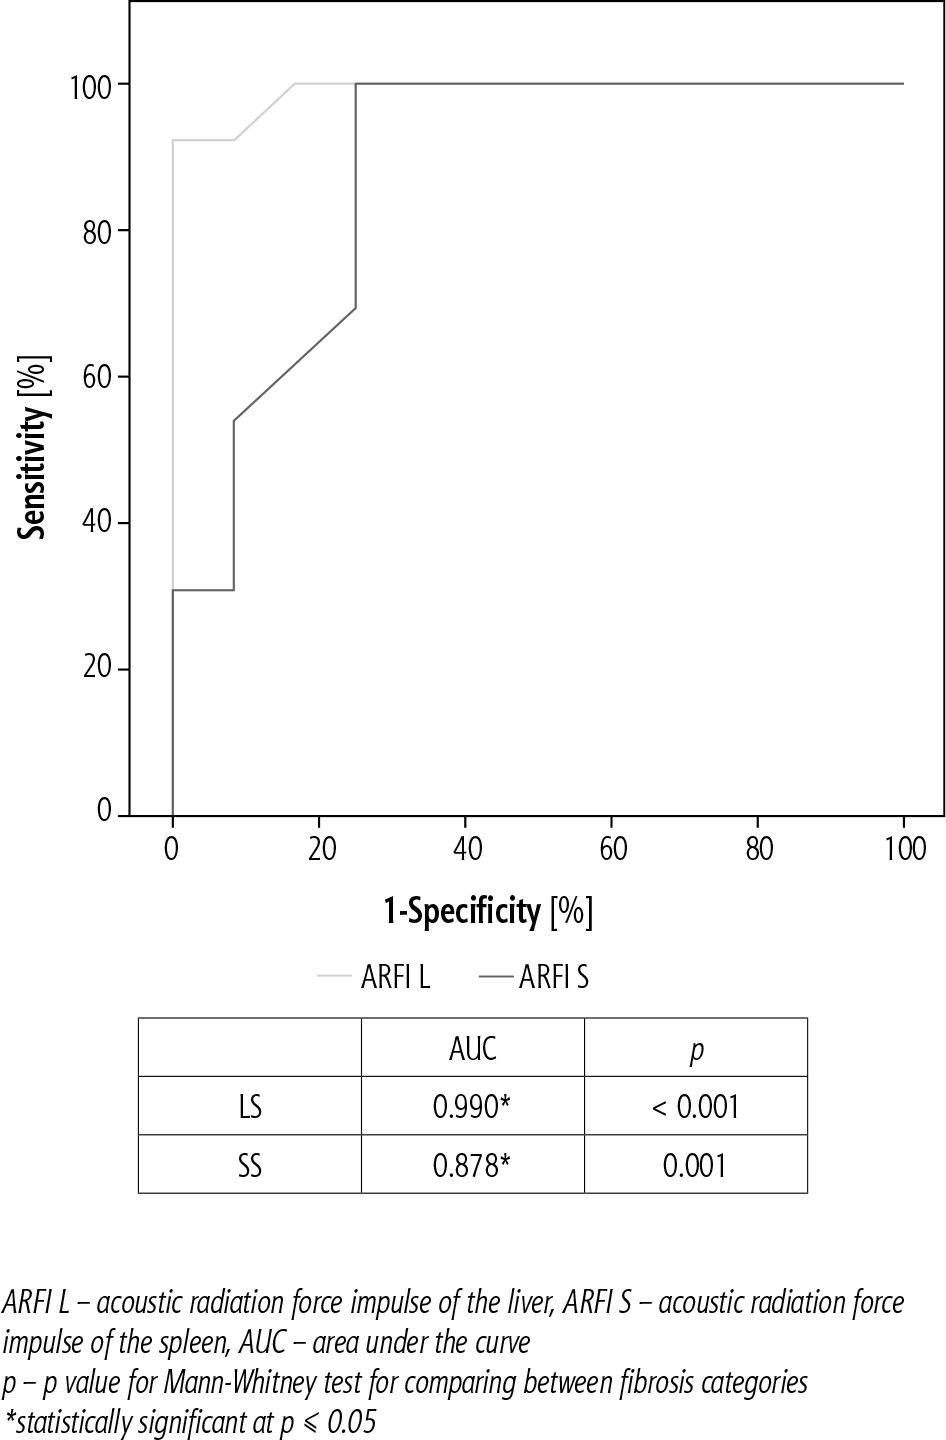
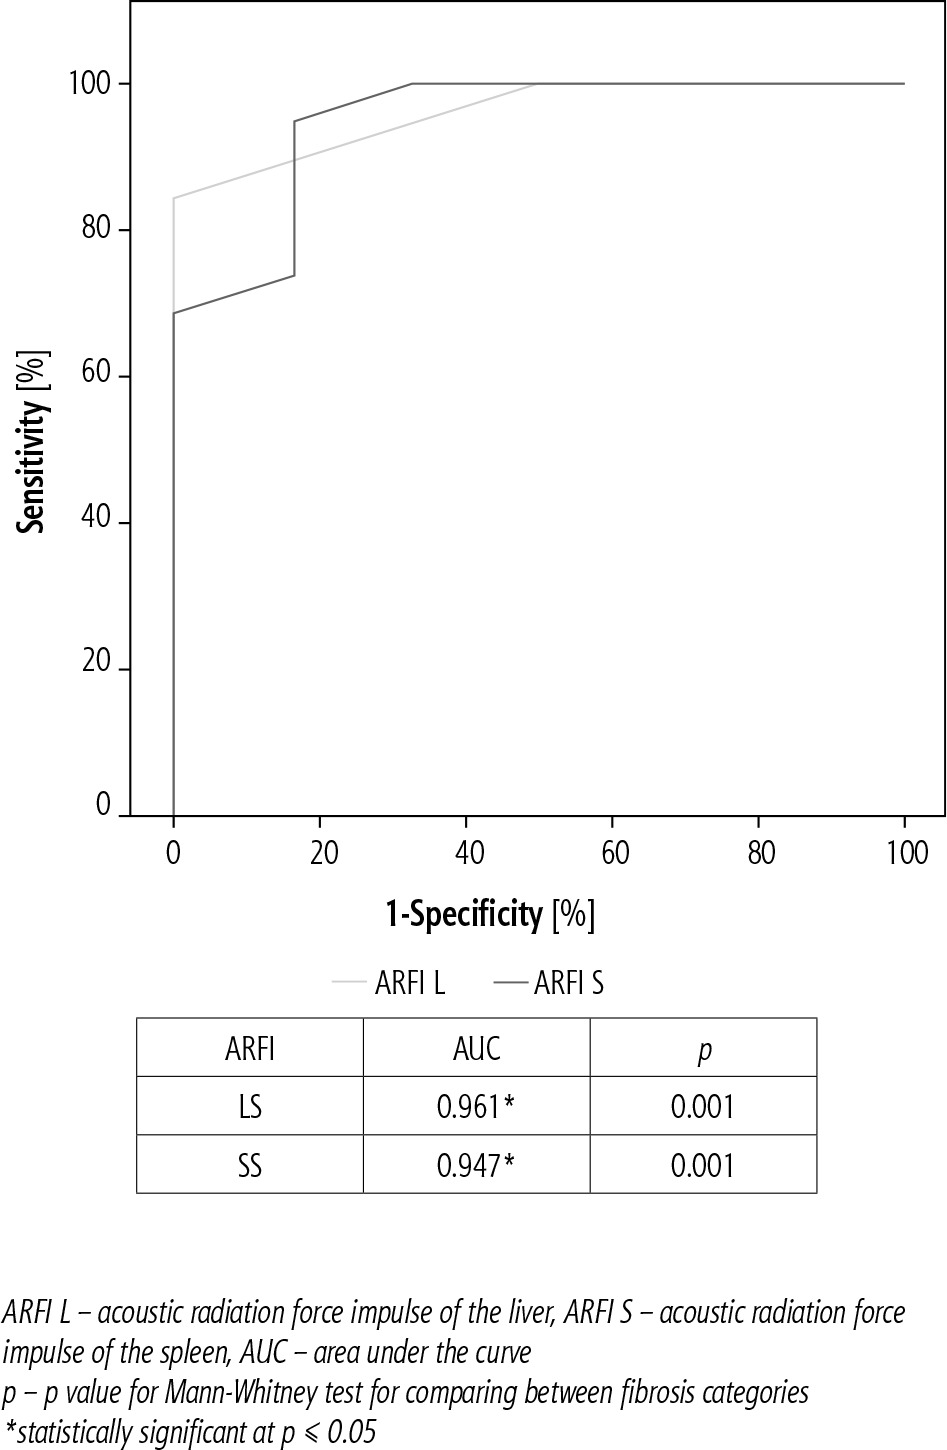
Group A patients had ARFI S of 1.70-2.82 m/s (mean ±SD = 2.17 ±0.36) in F1 and 2.40-3.30 m/s (mean ±SD = 2.72 ±0.26) in patients with F2-F3), with a sensitivity of 100%, a specificity of 75% and an accuracy of 80% (PPV of 81.2, NPV of 100) for a cut-off value of > 2.3 m/s for differentiation between insignificant and significant fibrosis with AUC of 0.87 (p = 0.001) (Fig. 4). Meanwhile in group B, ARFI S ran-ged between 1.42 and 2.80 m/s (mean ±SD = 2.07 ±0.46) and in patients with F2-F3 it ranged between 2.30 and 4.20 m/s (mean ±SD = 3.10 ±0.57), with a sensitivity of 94.74%, a specificity of 83.33%, an accuracy of 92% (PPV of 94.7, NPV of 83.3) and AUC of 0.94 (p = 0.001) for the same cut-off value (Fig. 5).
A remarkable correlation of ARFI L with gender in both groups A and B existed, being stronger in males than females. Both ARFI L and S exhibited a correlation with age and shrunken liver as well.
Discussion
Clinical management of HCV patients encompasses non-invasive tests allowing staging of the liver disease and bypassing the liver biopsy. In the developing world, schistosomiasis is one of the most prevalent, though neglected, tropical infectious diseases. It is a major intravascular infection that has devastating public health consequences, thus vastly affecting the socioeconomic state [4-8]. We intended to assess the impact of a pre-existing schistosomiasis infection on ARFI L and S (as a reliable non-invasive approach for the staging of fibrosis in chronic HCV patients) in patients co-infected with HCV.
Liver stiffness
In a pooled meta-analysis consisting of 518 patients with chronic liver disease (83% with viral hepatitis) mean AUROCs of ARFI L was 0.87 for the diagnosis of significant fibrosis, and 0.93 for the diagnosis of liver cirrhosis [9]. In a meta-analysis of 36 studies (21 full paper publications and 15 abstracts) comprising 3951 patients mean AUROCs was 0.84 for the diagnosis of significant fibrosis, and 0.91 for the diagnosis of liver cirrhosis [10]. Cut-off values suggested in the two meta-analyses were 1.34-1.35 m/s for the diagnosis of significant fibrosis and 1.80-1.87 m/s for the diagnosis of cirrhosis.
The study showed insignificantly higher values of liver stiffness assessed by ARFI in HCV patients co-infected with schistosomiasis than HCV mono-infected patients, assuming impaired performance of ARFI in the presence of co-infection, especially in F2 and F3 fibrosis stages.
This was further supported by Ramzy et al., who studied 352 cases, 122 of which were chronic HCV without antischistosomal antibody, 122 chronic HCV with positive antischistosomal antibodies and without PPT, and 108 chronic HCV with positive antischistosomal antibodies and an ultrasonographic picture of PPT. Although not statistically significant among the three groups, harmony existed between the histopathological (METAVIR) and the FibroScan results of the HCV patients (with no schistosomiasis infection). Despite the harmonization being higher among those with no PPT (70.7%) and the discrepancy being higher among those with positive schistosomal serology (66.5%), this relation was not statistically significant [11].
These study results are aligned with a previous one [12] in which 231 chronic HCV patients were enrolled. They were subdivided into a group with positive schistosomal serology and a second one with HCV patients having negative schistosomal serology. Liver stiffness measurements using FibroScan and reference needle-liver biopsy were attempted, concluding that the agreement between the FibroScan and the liver biopsy was more pronounced in HCV patients with negative schistosomal serology than in those with positive schistosomal serology. Another study confirmed that the disagreement between the results of liver biopsy and FibroScan was more obvious in those with positive schistosomal serology and HCV infection [13].
Furthermore, a cross-sectional study comprising 358 patients with schistosomiasis was conducted by Carvalho et al. [14] using point shear-wave elastography (pSWE). Patients were classified into two groups: 86 patients with mild PPT and 272 patients with significant PPT. The median pSWE of the significant fibrosis group was higher (1.40 m/s) than that of the mild fibrosis group (1.14 m/s, p < 0.001). AUC was 0.719 with ≤ 1.11 m/s as the best cut-off value for excluding significant PPT. Sensitivity and negative predictive values were 80.5% and 40.5%, respectively, whereas, for confirming significant PPT, the best cut-off value was > 1.39 m/s, with a specificity of 86.1% and a positive predictive value of 92.0%.
There are intrinsic differences between men and women in the density of the extracellular matrix of the liver [15, 16]. Our study reported that the mean ARFI L was significantly higher in males than in females. However, the influence of gender on LS is controversial. A large sample (923 healthy subjects) Italian study that used transient elastography (TE) revealed that the liver stiffness in males was significantly higher than in females [17]. A different study that used ARFI among 137 subjects found no statistically significant difference in mean ARFI values between males and females [18]. These discrepancies may be a result of different sample sizes, racial differences or differing imaging principles among TE and ARFI technologies.
Spleen stiffness
During the progression of liver cirrhosis and portal hypertension, passive congestion and tissue hyperplasia characterized by a combination of angiogenesis and fibrogenesis frequently occur in the spleen. All these changes result in increased spleen stiffness.
The current study demonstrated significantly higher values of spleen stiffness assessed by ARFI in patients co-infected with HCV and schistosomiasis than mono-infection with HCV, which was assumed to impair the performance of ARFI in presence of co-infection. This may be attributed to the higher number of patients with significant fibrosis (F2, F3) in group B (19 patients in group B vs. 13 in group A). Also, the mean value of the fibrosis stage was significantly higher in group B than A (2.04 ±0.73, 1.56 ±0.58 respectively and p = 0.019). Still, we cannot ignore the role of splenic congestion and tissue hyperplasia due to schistosomal infection as an explanation for these higher values of spleen stiffness in group B.
A study conducted by Veiga et al. [19] using transient elastography compared hepatosplenic schistosomiasis and HCV-cirrhotic patients; spleen stiffness values were comparable between schistosomiasis and cirrhotics. These discrepancies may be a result of different sample sizes, racial differences, and differing imaging principles among TE and ARFI technologies. Also, Veiga’s study found no significant difference in splenic stiffness, as they included cirrhotic patients while we enrolled chronic hepatitis patients (lower fibrosis stage).
We have to emphasize that this study has several unique features; our study was conducted using ARFI, while most of the previous studies described in the literature were conducted using transient elastography. To our knowledge, this research is the first study of ARFI that has focused on Egyptian subjects and used ARFI technology to assess the spleen stiffness in an Egyptian patients with HCV mono-infection and coinfection with schistosomiasis. In future studies of chronic liver disease, our results may be used as a reference value for assessing the liver and spleen stiffness using ARFI in such groups of patients. The small sample size is the limitation of our study in addition to not correlating the tissue stiffness with the radiological staging of PPT.


