


Aortic stenosis (AS) causes obstruction of left ventricle outflow. Severe AS is a condition with major haemodynamic implications in patients, scheduled for major surgery or hospitalized in the intensive care unit (ICU). Basically, AS causes left ventricular outflow obstruction. Especially in critically ill patients, in whom increased cardiac output and oxygen delivery are required (e.g. sepsis, postoperative anaemia), the consequences of unrecognized severe AS may be devasting.
A prevalence of 7.6 million cases among adults above 75 years of age in North America and Europe has been reported [1]. With an aging population, increasing prevalence is expected in the future. Symptomatic severe AS is associated with a poor outcome if the valve is not replaced [2, 3].
This review intends to describe the up-to-date comprehensive assessment of AS for the non-cardio-logist. We focus on severity assessment of AS by echocardiography. A good understanding of some essential underlying assumptions in echocardiography is mandatory to interpret the results of an echocardiographic study. Awareness of these principles of echocardiographic AS severity assessment helps the ICU doctor to avoid the pitfalls in interpreting the echocardiography reports and offers tools to deal with conflicting information (e.g. discordance between the calculated aortic valve area [AVA] and the measured gradients across the aortic valve).
This review will not provide a complete in-depth overview of the topic of AS. Relatively recent novel evolutions in cardiac imaging, such as strain imaging, cardiac computed tomography (CT), aortic valve calcium scoring and cardiac magnetic resonance (CMR) imaging, are promising new diagnostic tools. Nowadays, they have not established a definite place in the cardiology guidelines, and they are only discussed to outline the potential benefits and limitations in the management of patients with (suspected severe) AS. As mentioned in the title, this overview addresses stenosis of the native aortic valve. Stenosis of a prosthetic aortic valve is a distinct clinical entity, which deserves to be discussed in a separate paper.
It should be emphasized that the treatment strategy of severe AS diagnosed in the routine outpatient cardiology clinics differs fundamentally from the strategy for patients with severe AS hospitalized in the ICU with a coexisting severe non-cardiac disease. Specific treatment options such as aortic valve replacement (AVR) and transcatheter aortic valve replacement (TAVR) are not real options in the ICU patients. Therefore, we will not discuss AVR and TAVR in depth and focus more on the relevant aspects of aortic valve balloon angioplasty that may be useful in the ICU setting. The scenario of an infective endocarditis with a vegetation, causing flow obstruction, is a distinct entity. Its treatment will not be discussed in this review.
The main part of this review will discuss the echocardiographic assessment of AS with its pitfalls and limitations of suboptimal imaging in the ICU. The importance of consistency between aortic valve area and mean gradient is emphasized in many sections of this paper. We try to offer tools to deal with disagreement between aortic valve (AV) gradients and AVA. Therefore, the concept of Flow Pressure Gra-dient Classification is discussed.
Despite the fact that an invasive work-up for AS is no longer part of the routine assessment, we will discuss the Gorlin equation, as it allows a more profound understanding of the pathophysiology of AS. Subsequently, the relevant aspects of AS severity assessment of CMR and cardiac CT are overviewed, as well as the role of dobutamine stress echocardiography to diagnose severe low-output, low-gradient AS. Finally, the treatment options are discussed.
ANATOMICAL ECHOCARDIOGRAPHIC LANDMARKS OF THE NORMAL AORTIC VALVE
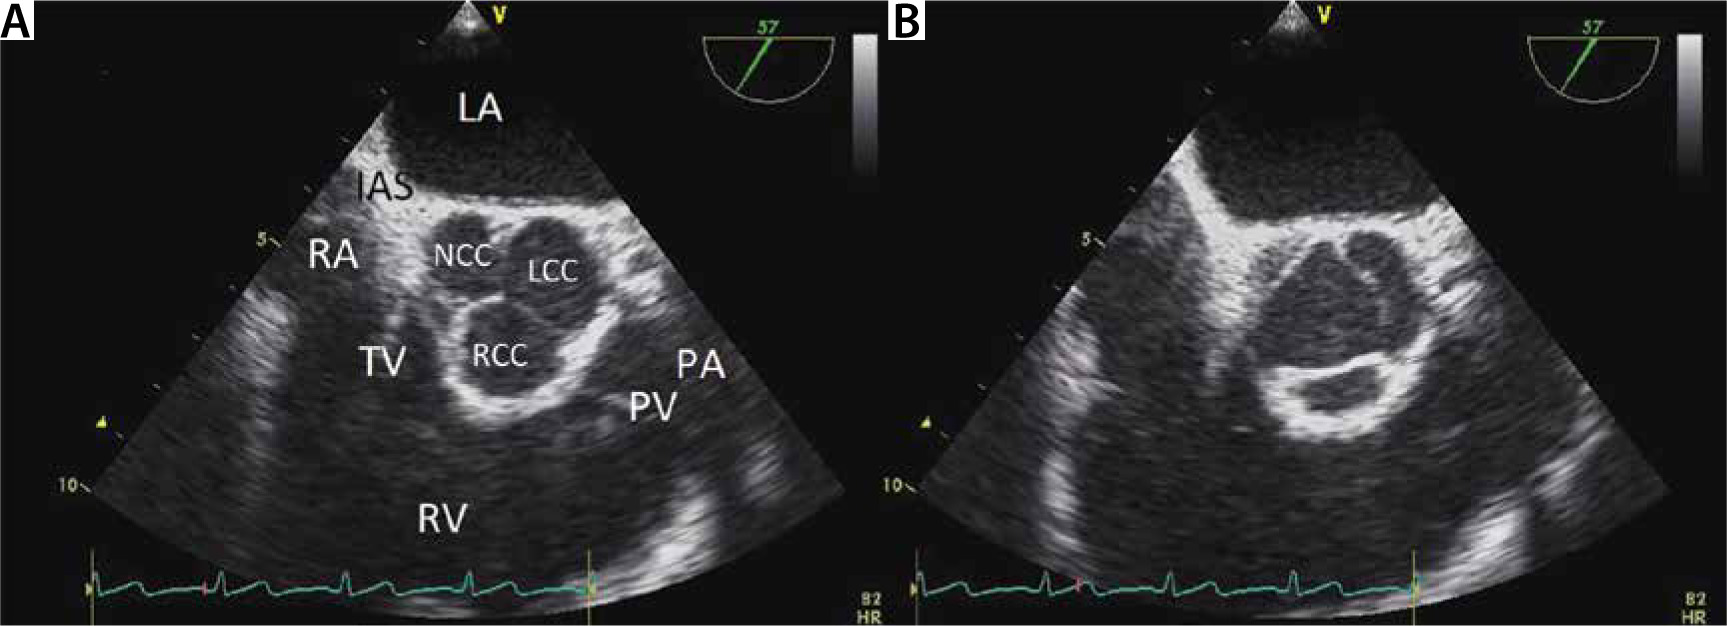
The aortic valve’s main function is to act as a gateway for the blood to exit the left ventricle during systole. The aortic valve consists of the valve annulus and 3 leaflets. The aortic annulus is a functioning ring-like structure, anchoring the base hinge-points of leaflets. The left main coronary artery and right coronary artery originate from the coronary sinus above the left coronary cusp (LCC) and the right coronary cusp (RCC), respectively. The interatrial septum (IAS) is adjacent to the non-coronary cusp (NCC) (Figure 1).
FIGURE 1
Normal aortic valve anatomy on echocardiography. Diastolic (a) and a systolic (B) frame of a normal aortic valve (AV) from a transthoracic echocardiography short axis view (57°). The AV consists of the valve annulus and 3 leaflets. The left main coronary artery and right coronary artery originate from the aorta above the left coronary cusp (LCC) and the right coronary cusp (RCC), respectively. The interatrial septum (IAS) is adjacent to the non-coronary cusp (NCC). LA – left atrium, RA – right atrium, RV – right ventricle, TV – tricuspid valve, PV – pulmonary valve, PA – pulmonary artery
Aetiology
Authors have suggested different classification systems according to the aetiology of AS. Often, the causes of AS were divided into 2 major categories: congenital and acquired aortic stenosis. Table 1 summarizes the main causes of aortic stenosis.
TABLE 1
Aetiology of aortic stenosis
Degenerative (senile) aortic stenosis
This is the most frequent cause of AS in the Western world. It is postulated that longstanding mechanical stress will cause valvular inflammation, with subsequent adhesion and calcification of the valvular leaflets. The AV separates the highest-pressure compartments of the circulation: the left ventricle and the aorta. Therefore, the AV is thought to be more vulnerable to degeneration than the other heart valves. However, some degree of mitral annulus calcification is usually also detected in patients with degenerative aortic stenosis. Epidemiological studies have reported that a severely calcified AV was found in 2% of the aged population (≥ 65-years-old), of which 39% were without AS.
Although concomitant aortic regurgitation is not rare in degenerative AS, aortic regurgitation is not considered to be a typical feature of degenerative AS.
Rheumatic heart disease
Rheumatic heart disease follows rheumatic fever (RF) as a non-suppurative manifestation of group A beta haemolytic streptococcal (GAS) pharyngitis. RF is widely accepted as an immunological disorder following GAS infection [4].
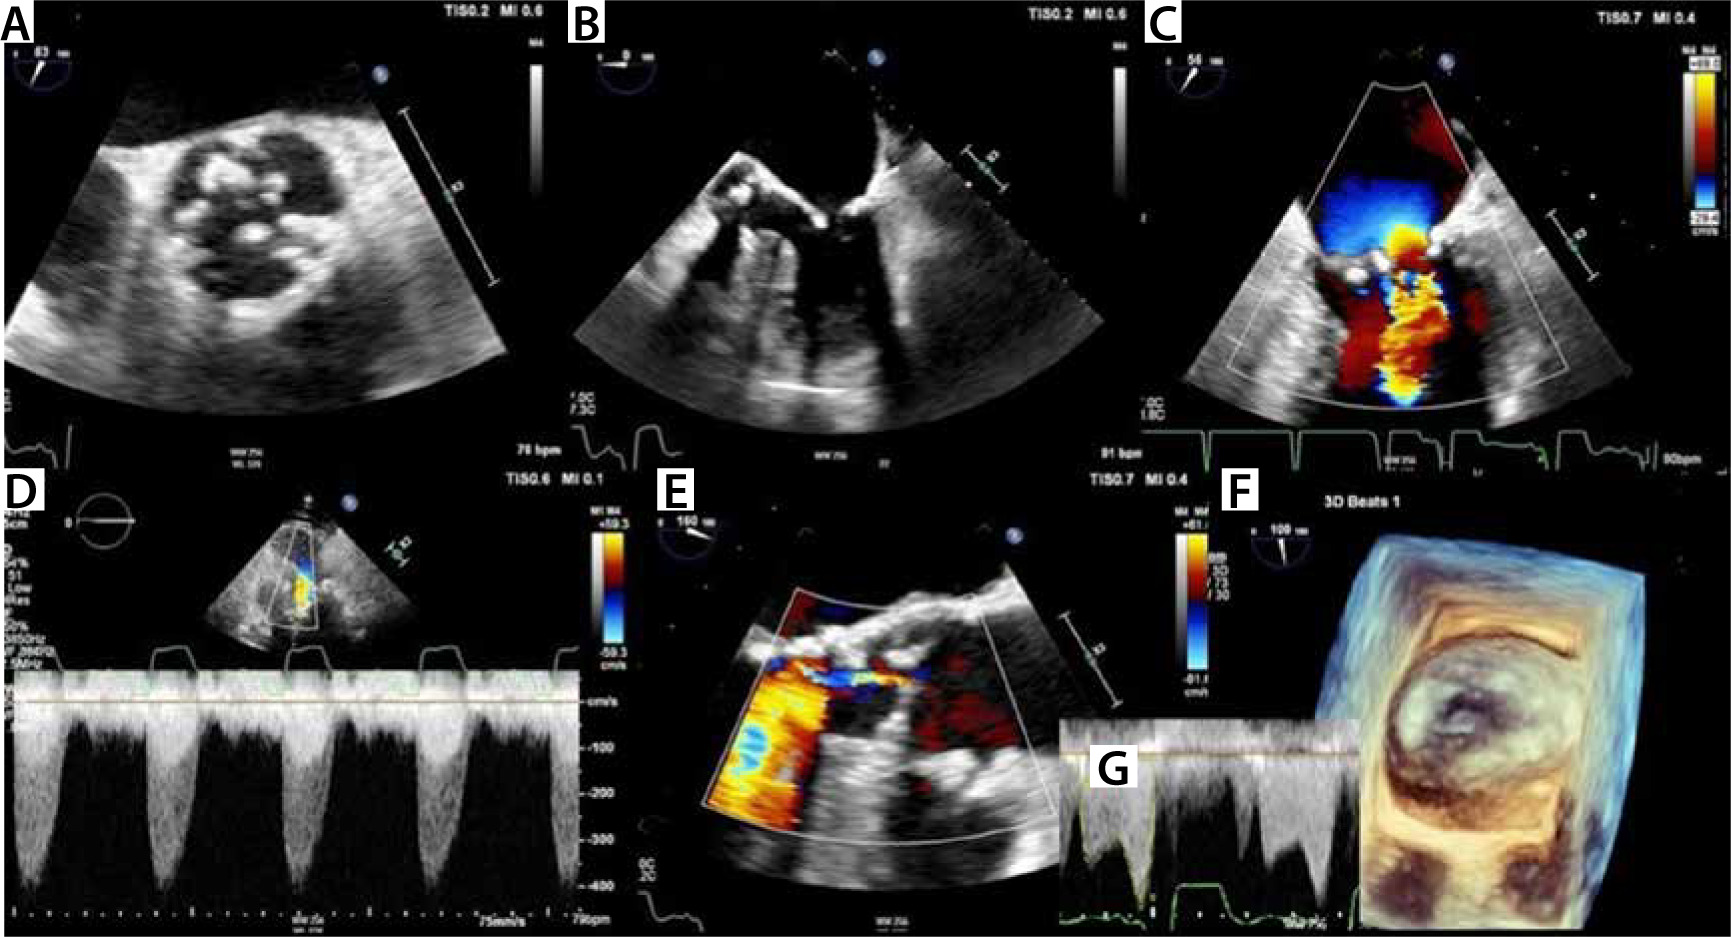
Inflammation causes adhesion of the commissures of the cusps. Neovascularisation of the annulus and cusps results in retraction and increased stiffness of the AV leaflets. Besides stenosis, this mechanism also causes difficult closure of the AV, inducing aortic regurgitation. Rheumatic aortic stenosis usually co-exists with aortic regurgitation. Rheumatic valvular disease preferentially affects the mitral valve. Thus, rheumatic AV disease usually occurs concurrently with rheumatic mitral valve disease [5] (Figure 2).
FIGURE 2
Rheumatic left-sided valve disease. Example of rheumatic valve disease with involvement of the aortic valve (AV) and mitral valve (MV). Panel a shows a systolic frame. Note the commissural fusion from the annulus of the AV. Panel B demonstrates involvement of both left sided heart valves. The anterior mitral valve leaflet has the typical hockey morphology. Panel C shows diastolic atrial convergent flow before the narrowed mitral valve area. Note the post-stenotic turbulence in the LV. This panel shows a typical flow colour flow mapping (CFM) pattern of mitral stenosis. Panel d demonstrates the continuous wave (CW) Doppler signal across the AV, with a peak velocity of 405 cm s-1, demonstrating severe aortic stenosis. Panel e shows mild aortic regurgitation. Panel f shows a 3D echo image of the MV. Note the typical fish mouth opening of the MV. Panel g shows the transmitral CW signal, consistent with moderate MS (mean gradient 7.5 mm Hg)
Bicuspid aortic valve
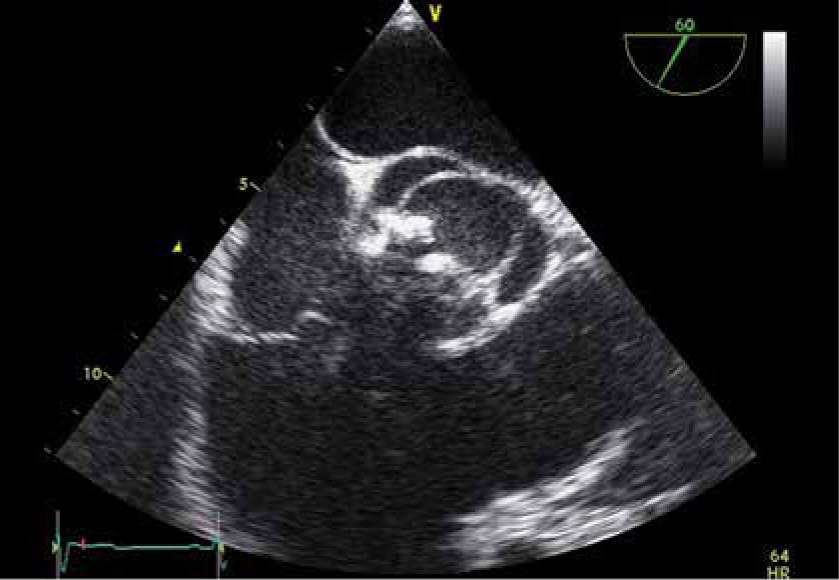
Bicuspid AV occurs in 1–2% of the general population [6], making bicuspid AV the most common congenital heart anomaly. The reported prevalence of bicuspid AV has increased since the advent of echocardiography. Often, a bicuspid AV is an occasional finding in the work-up for other cardiac problems. In patients with coarctation of the aorta, a co-existing bicuspid AV is found in 50–75% of cases [7]. The evolution of a ‘normal functioning’ bicuspid AV to a symptomatic AS is time related, with peak incidence occurring in the 5th and 6th decades of life. A study of 542 patients with bicuspid AV, undergoing aortic valve replacement (AVR), demonstrated that the indication of AVR was pure aortic stenosis (AS), pure aortic regurgitation (AR), combined AS and AR in 75%, 13% and 10%, respectively. In 1% of the patients, there was normal AV function [8] (Figure 3).
FIGURE 3
Bicuspid aortic valve. Systolic transthoracic echocardiography frame of a sclerotic bicuspid aortic valve. Note the commissural fusion of left and right coronary cusp
Pathophysiology, cluster of symptoms and natural history
The pathophysiology of AS is extensively covered in standard works on clinical cardiology and physiology. We will refrain from redundancy and focus on the implications for ICU and critical care departments.
As a rule, AS is a degenerative-progressive disease, that will remain asymptomatic over a long period of time. Some predispositions (e.g. bicuspid valve) may show faster progression of calcification and shorten the asymptomatic period.
Normal aortic valve area (AVA) lies between 2.6 and 3.5 cm2. The critical threshold is considered between 0.8 to 1.0 cm2. On average the progression of aortic stenosis, above 55 years of age, shows a decrease of AVA between 0.1 and 0.15 cm2 per year. Studies on the natural evolution of valve calcification show large variations in velocity of the valve calcification process and poor correlation of prediction [9]. Curiously, neither the initial degree of stenosis at baseline, evidence of left ventricular hypertrophy, nor the development of symptoms are good correlates for predicting the progression of stenosis gradient over time.
For the ICU, it is paramount to understand some basic pathophysiology principles that will come into play as aortic valve area starts to become critical. It is obvious that cardiac output will start to drop, and organ perfusion will be compromised. The most affected organ systems are primarily heart and brain functions. As a result, coronary ischaemia might be clinically present in the form of angina pectoris. It might be evident on the electrocardiogram (ECG) as altered ST repolarization or in blood samples as elevated troponin levels. Due to cerebral hypoperfusion, syncope or altered levels of consciousness might be seen. In the blood analysis, signs of renal failure, hepatic hypoperfusion or lactic acidosis may be found.
The heart itself will have to work hard to maintain cardiac output through a narrow orifice and left ventricular hypertrophy and elevated filling pressures will entail, at some point in time. The patient will present more frequently with pulmonary oedema and shortness of breath.
If left ventricular filling is compromised, the ventricular hypertrophy will promote “kissing walls” and increased stroke volume variation will indicate paradoxical pulse.
A difficult trade-off between adequate filling pressures and elevated pulmonary wedge pressures will become more evident as aortic stenosis becomes more critical. The window of optimal filling becomes a narrow therapeutic grey zone.
Echocardiography: assessment of the aortic stenosis
Echocardiography is the preferential imaging modality of AS severity assessment. This is not only due to its ability of bedside assessment, non-invasiveness and cheapness. Compared to CMR and cardiac CT, echocardiography has the highest temporal resolution. To determine the peak gradient/velocity, temporal resolution is critical.
This section explains how the 3 crucial measurements of the AS – aortic valve area (AVA), peak and mean gradient – are measured and calculated. The pitfalls and limitations are discussed. Subsequently, the expected co-existing features of AS, such as left ventricular hypertrophy (LVH) and narrowed opening box of the aortic valve (AV), are explained. Finally, assessment of diastolic function is reviewed. Information of the LV loading conditions of the patients is highly relevant for the ICU.
Assessment of mean and peak gradient
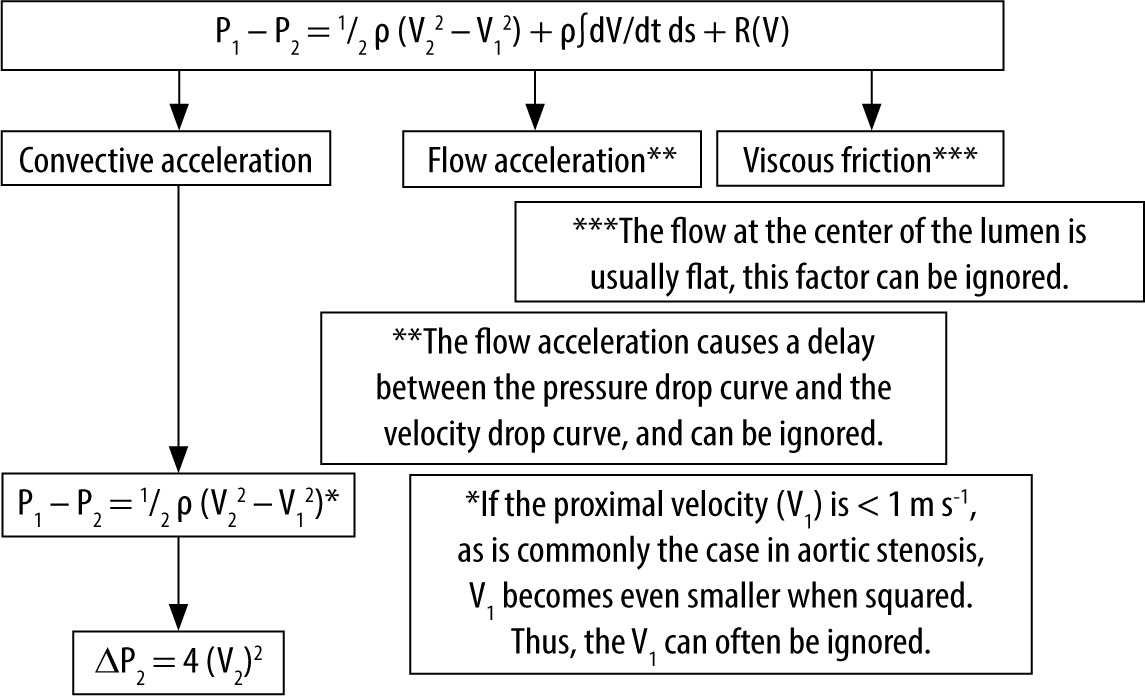
Based on the Doppler shift, Doppler echocardiography measures blood velocities in the heart chambers and large vessels [10–12]. The Bernoulli equation is used to convert velocity (cm s-1) to pressure in millimetres of mercury (mm Hg). The Bernoulli equation consist of 3 components: the convective acceleration, the flow acceleration factor and viscous friction (Figure 4). In the clinical setting, the velocity profile through the centre of the AVA is usually flat, allowing the viscosity component to be ignored [12]. The flow acceleration term describes the delay between the pressure drop curve and the velocity drop curve (Figure 4). In the clinical setting, this term can be ignored [12], leaving the convective acceleration term: ½. ρ ((V2)2 – (V1)2), with ρ being the mass density of blood (1.06 × 10³ kg m-3). Finally, the last simplification of the Bernoulli equation is made by skipping V1. The underlying assumption is that the velocity through the stenotic orifice is much higher than the velocity in the left ventricular outflow tract (LVOT). So, the pressure gradient can be calculated5: pressure gradient (ΔP) = 4 (V2)2 (Figure 4). It should be emphasized that this latter equation can only be used in the absence of an LVOT obstruction.
FIGURE 4
Simplified Bernoulli equation. Description of the simplification of the Bernoulli equation to the equation that is used in clinical medicine. See text
The continuous wave (CW) echo Doppler peak gradient (Figure 5) and peak-to-peak gradient, measured in the catherization laboratory, are not interchangeable. Echo Doppler measures the peak instantaneous gradient, while invasive peak-to-peak gradient, obtained in the catherization laboratory after a pullback manoeuvre, expresses the difference between the peak LV pressure and the peak aortic pressure. Contrary to the echo Doppler peak gradient, the peak-to-peak invasive transvalvular gradient is not a physiological gradient. The invasive peak-to-peak gradient is lower than the echo Doppler peak AS gradient [13, 14].
FIGURE 5
Continuous wave (CW) measurement of mean and peak gradient across the aortic valve. CW Doppler measurement across the aortic valve. The peak velocity is 466 cm. According to the simplified Bernoulli equation: peak pressure = 4 × (peak velocity m s-1)2 = 4 × (4.66)2 = 86.86 mm Hg. By contouring the aortic regurgitation CW signal, the velocity time integral across the aortic valve is determined, allowing the software to calculate the mean pressure gradient. In this case the aortic stenosis mean gradient is 52.75 mm Hg

The mean gradient of the AS is obtained from the CW velocity time integral across the AV [12]. Velocity across the AV differs throughout the heart cycle. The AVA VTI is the integral of all instantaneous velocities throughout the systole. It has been demonstrated that the mean AS gradients, obtained from echo Doppler and invasive measurements, correspond well.
Take home messages on echocardiographic assessment of transvalvular gradients in AS
Pressure gradients across the AV are calculated using the simplified Bernoulli equation: ΔP = 4v2.
The underlying assumptions of the simplified Bernoulli equation imply that this equation cannot reliably be used in patients with AS and co-existing LVOT obstruction.
The values of mean peak gradient across the AV, obtained by echocardiography and invasive measurement, correlate well.
Echo Doppler peak gradient and invasive peak-to-peak gradient in AS are different concepts. The latter is lower than the echo Doppler mean AS gradient.
Suboptimal alignment of the echo beam to the flow crossing the AV will result in underestimation of peak and mean gradient.
Measurement of stroke volume and cardiac output
This step needs to be discussed as it is an essential part of the calculation of AVA. Cardiac output is measured in the left ventricular outflow tract (LVOT) using pulsed wave (PW) Doppler velocity. Since we can measure the LVOT diameter (D), we can calculate its cross-sectional surface area (CSA) and derived stroke volume (SV) (Figure 6).
FIGURE 6
Echocardiographic assessment of stroke volume (SV). Required echocardiography measurements to calculate SV. Flow is the product of velocity and area. Panel a shows the pulsed wave echo Doppler measurement of the velocity time integral in the LVOT (VTILVOT). Panel B shows the measurement of LVOT diameter. LVOT surface area = π (LVOTd/2)2. SV = π (LVOTd/2)2 × VTILVOT = 0.785 × (LVOTd)2 × VTILVOT
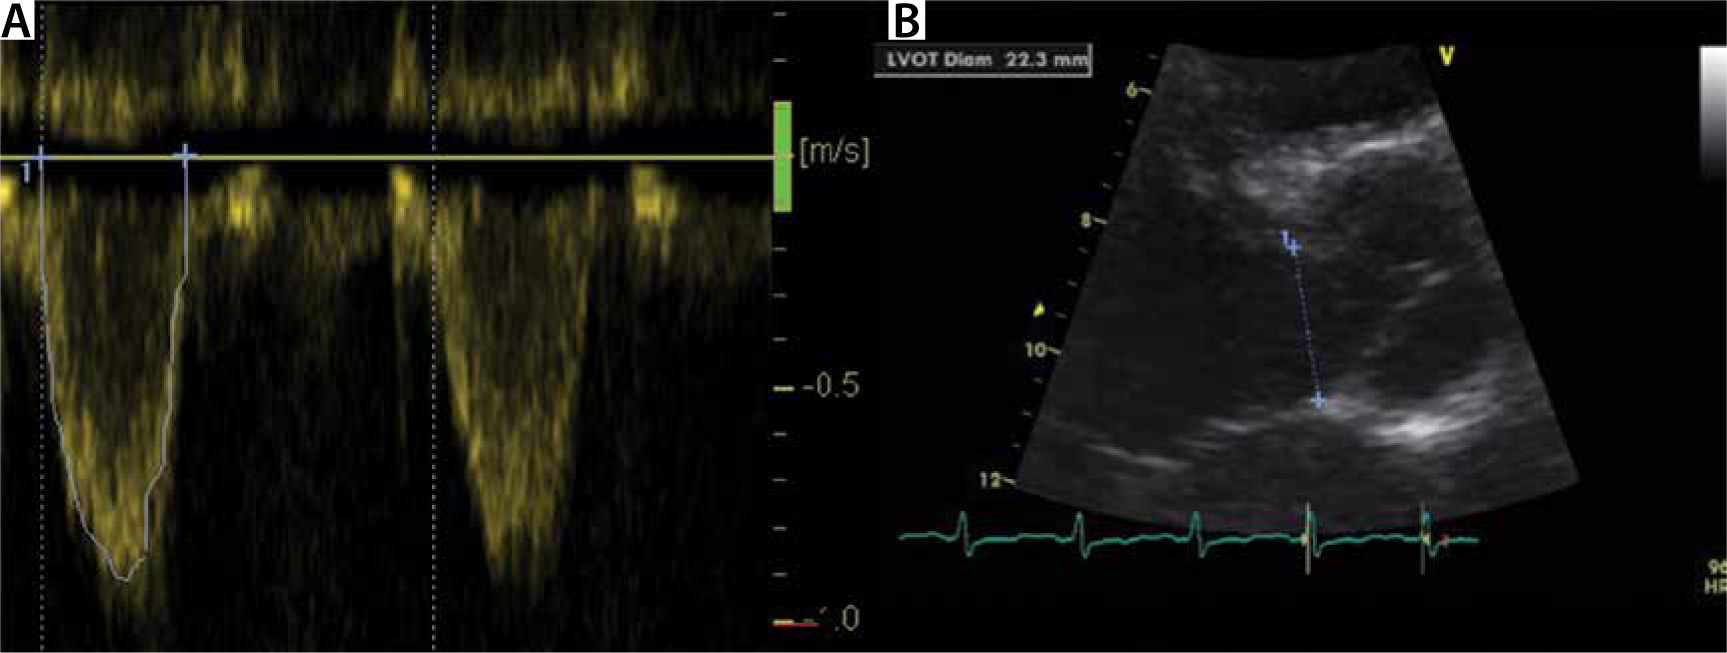
CSA = 3.14 × (D/2)2 = 0.785 × (DLVOT)2
SV = VTI × CSA, with VTI the velocity time integral.
This method of CO calculation by ultrasound measurement of the LVOT was first described and validated by Otto in 1988 [15]. While the cross section of the LVOT at diastole (LVOTd) can also be measured [16], relevant inter-observer variability up to 0.2 cm has been reported [17]. TTE tends to underestimate the LVOT by 0.1 cm [17]. In the general population, variation of the LVOT diameter ranges between 18 and 22 mm and is related to body surface area (BSA) [18].
The velocity time integral (VTI) can be derived with pulsed wave Doppler measured at the LVOT. A normal VTI varies in the range 20–25 cm. Therefore, it can be estimated by a given formula, which is time-effective and reduces error (19):
LVOTd = 5.7 × BSA + 12.1
Cardiac output is derived as follows:
CO (cm3 min-1) = SV × HR = HR (bpm) × CSA (cm2) × VTI (cm).
Continuity equation. Calculation of aortic valve area
The continuity equation is used to calculate the aortic valve area (AVA). The continuity equation is based on the principle of flow preservation, and simply states that flow, passing through the LVOT, must pass through the AV. Thus, FlowLVOT = FlowAVA [16] (Figure 7).
FIGURE 7
Calculation of aortic valve area (AVA), using the continuity equation. Assessment of AVA by the continuity equation. The left ventricular outflow tract (LVOT) flow equals the flow through the AVA. Flow is the product of velocity (VTI – velocity time integral) times surface area (CSA – circumferential surface area). To calculate AVA, measurement of LVOT diameter, VTILVOT and VTIAVA is needed. D – diameter
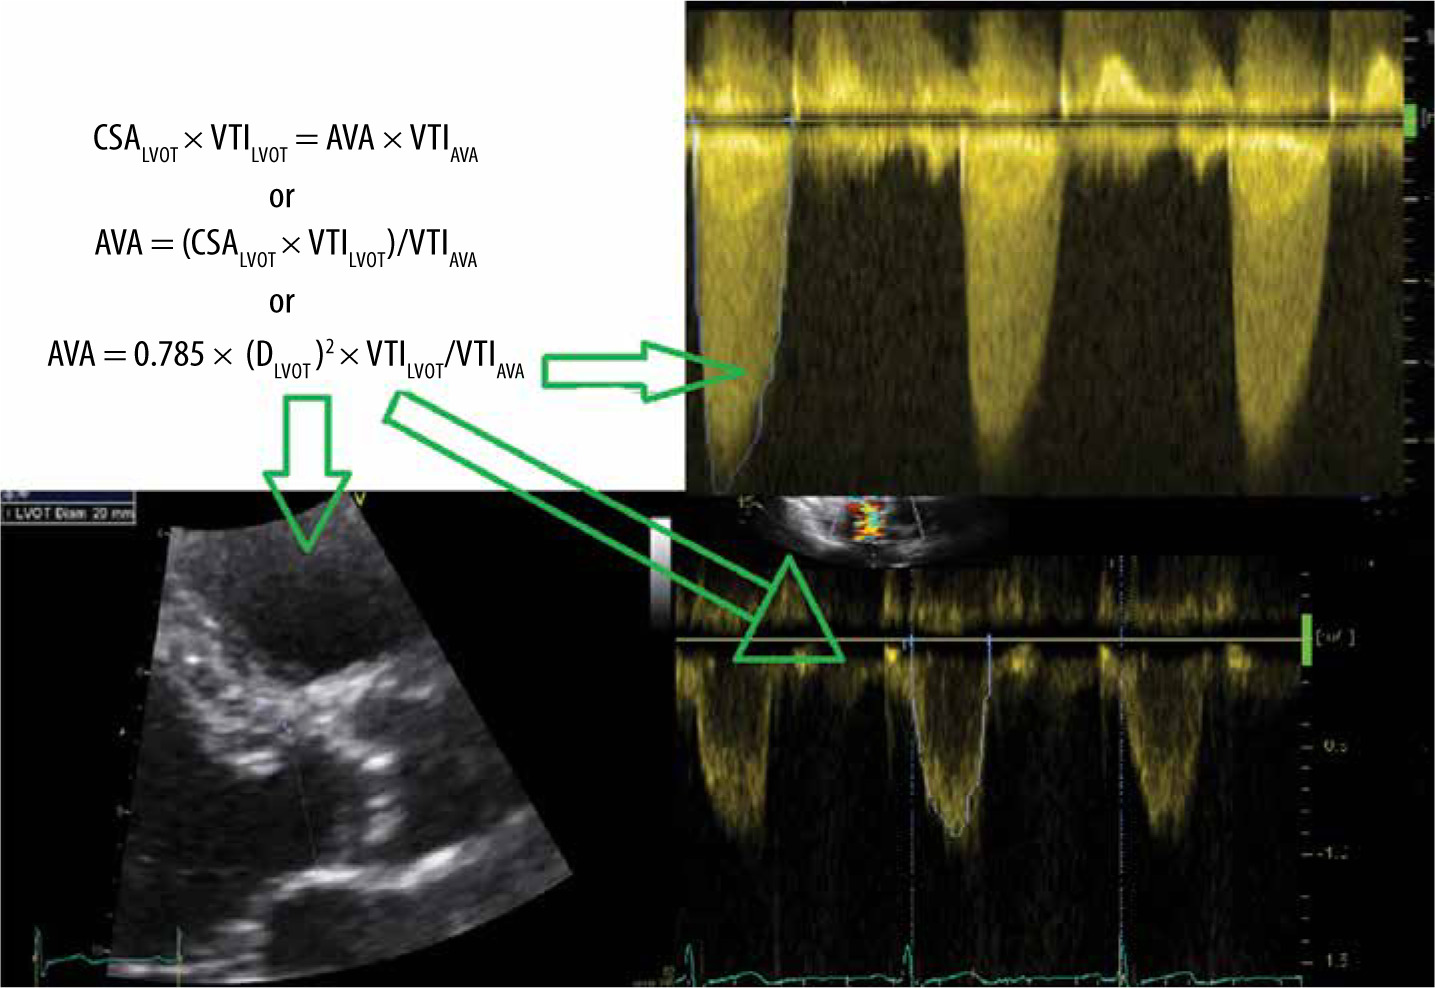
The flow through the LVOT equals stroke volume (SV):
SV = FlowLVOT = 0.785 × (DLVOT)2 x VTILVOT (see previous section).
Thus, according to the principle of preserved flow: FlowLVOT = FlowAVA can be reformulated as follows:
CSALVOT × VTILVOT = AVA × VTIAVA
or
AVA = (CSALVOT × VTILVOT)/VTIAVA
or
AVA = 0.785 × (DLVOT)2 × VTILVOT/VTIAVA
Assessment of the severity of aortic stenosis
Table 2 summarizes the ESC [20] and American [21] guidelines to classify aortic stenosis as mild, moderate or severe. Both guidelines use AVA, peak velocity and mean gradient. It should be noted that there must be accordance between AVA and the mean gradients. In case of disagreement between these measurements, one must ascertain what is the most likely cause of the inconsistency (e.g. an overestimated LVOT diameter). Later, we will discuss the special situation of low-flow, low-gradient AS in patients with reduced systolic function. The Flow Pressure Gradient Classification, helping to further classify patients with preserved LV EF and discordancy between AV and mean gradient, will be discussed below in the ‘special scenarios’ section.
2D and M-mode echocardiography in aortic stenosis
2D and M-mode imaging contribute to the overall assessment of AS. With the exception of the measurement of LVOT diameter, they are not part of the quantification of AS, but are relevant for the reasons below:
2D echo contributes to assessment of the aetiology of AS. However, differentiation of a bicuspid AV from a tricuspid AV may be difficult in the end stage of the disease, due to the severe AV calcification.
2D echocardiography allows visual qualitative assessment as well as quantitative assessment of the LV EF. This is relevant regarding the prognosis of AS. Further, a reduced LV EF in the presence of ‘moderate AS’ according to peak and mean gradients should raise suspicion for a severe low-output, low-gradient AS (see below). Elaboration of the assessment of the LV EF by echocardiography is beyond the scope of this paper.
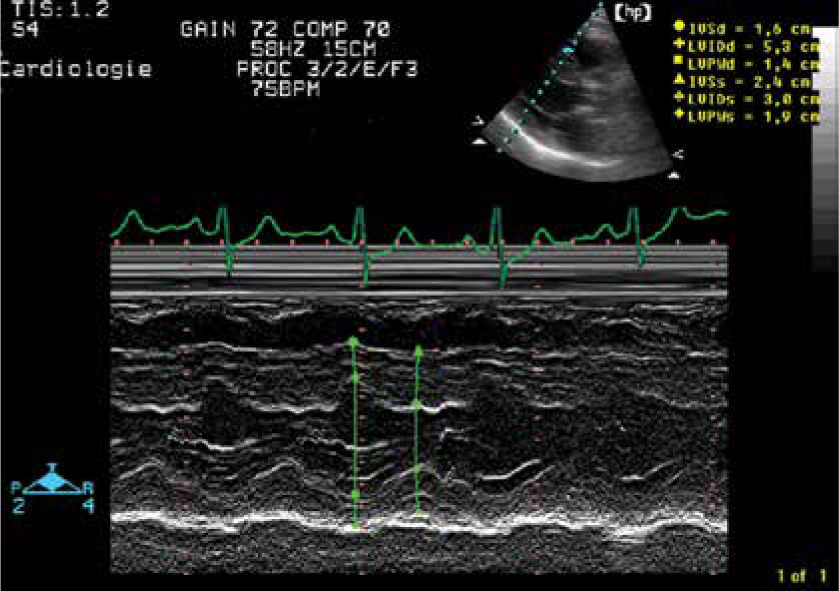
LVH is an adaptation mechanism in AS. Concentric LV remodelling can be visually assessed on 2D echo and be quantified on M-mode. An interventricular septal thickness in end-diastole (IVSd) of more than 11 mm is consistent with LVH (Figure 8).
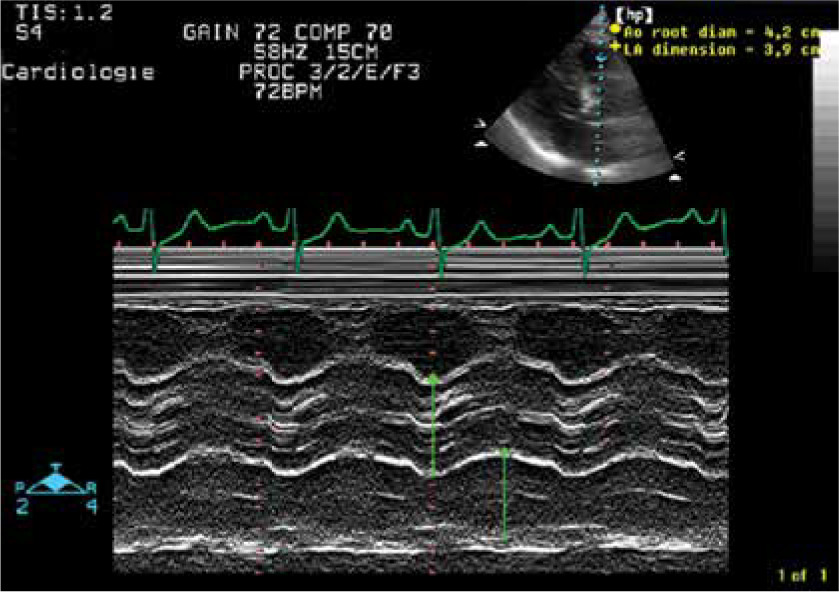
The aortic valve opening box on M-mode in the Valsalva sinus may give an indication of the severity of the AS, but is not suitable for quantitative assessment of AS (Figure 9).
Assessment of diastolic function and LV loading in aortic stenosis
In a previous paper, we described assessment of the diastolic function and LV loading [22]. A detailed description of echo Doppler assessment of the diastolic function is beyond the scope of this overview. Nonetheless, questions regarding the loading conditions in patients with severe AS are particularly critical for the intensivist. Obtaining optimal LV filling in ventilated patients is challenging: underloading of the LV will worsen the haemodynamic condition as adequate LV filling is required to build the emptying gradient across the AV. On the other hand, patients with AS are particularly prone to LV overload due to increased LV wall stiffness, secondary to LVH in this aged population.
It should be emphasized that an abnormal diastolic filling pattern is expected in AS due to the aforementioned reasons. Impaired diastolic relaxation (diastolic disfunction grade I) indicates normal or impaired LV loading. The pseudonormal transmitral echo Doppler signal (diastolic dysfunction grade II) and the restrictive filling patterns imply increased LV end-diastolic pressure. Figures 10 and 11 summarize the filling patterns. The E wave (early filling) and A wave of the transmitral PW signal represent the early filling of the LV due to diastolic relaxation and the atrial kick at end diastole, respectively. The transmitral signal is a composite of LV stiffness and LV loading. The tissue Doppler derived e´, measured in diastole at the medial mitral annulus, is postulated to represent LV stiffness. The combination of E/A ratio of transmitral echo Doppler flow and e´ is particularly helpful to grade the diastolic function and LV loading.
FIGURE 10
Grading of diastolic function. Transmitral echo Doppler signal (row a) and medial mitral valve annular tissue Doppler e’ (row B). Column 1 shows an example of a normal diastolic flow pattern. Column 2: diastolic disfunction grade I (delayed relaxation). Column 3: pseudonormal diastolic flow pattern (diastolic disfunction grade II). Column 4: restrictive diastolic filling (diastolic disfunction grade III–IV). Notably, e’ decreases with increasing diastolic disfunction, while E/A ratio is decreased in diastolic disfunction grade I. From diastolic disfunction grade II, E/A increases with increasing diastolic disfunction
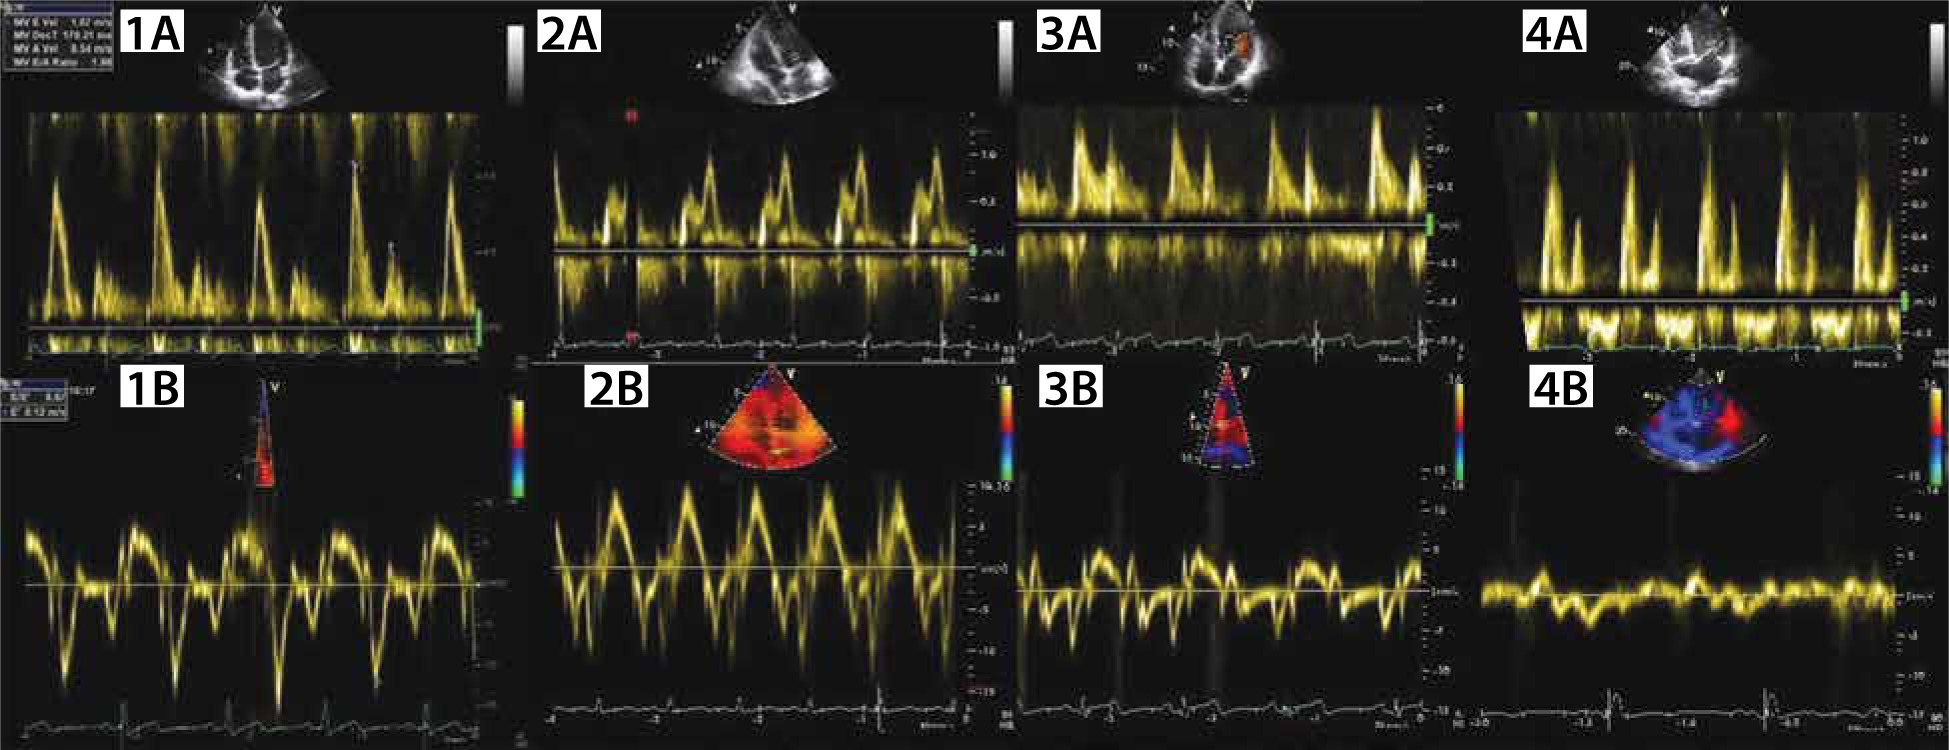
FIGURE 11
Grading of diastolic function. Summary of grading of diastolic function, based on the echo Doppler mitral inflow pattern and the medial mitral annular tissue Doppler e’

Take home messages on echo Doppler assessment of LV loading
Delayed relaxation (diastolic dysfunction grade I): Adequate or impaired LV loading. Presence or absence of tachycardia with this echo Doppler LV filling pattern will increase the likelihood of a low LV load or an adequate LV load, respectively.
Diastolic disfunction grade II and restrictive LV filling pattern imply increased left ventricular end-diastolic pressure (LVEDP).
Differential diagnosis of left ventricle outflow obstruction
The differential diagnosis of left ventricle outflow obstruction consists of 3 main entities: subaortic stenosis, valvular aortic stenosis and supravalvular aortic stenosis. The subaortic stenosis may be caused by a membrane partially occluding and obstructing the LVOT. A subaortic membrane is often poorly visualized by TTE. Carefully screening the LVOT, using colour Doppler and PW doppler at different sample sites in the LVOTm allows the obstruction to be located. TEE is helpful in depicting a subaortic membrane [5].
The LVOT obstruction can be muscular. Finally, the LVOT obstruction can be dynamic, as in hypertrophic cardiomyopathy. The morphology of the CW Doppler signal is helpful in differentiating valvular AS from dynamic obstruction, as the CW signal reaches its peak in late systole (dagger shape) in dynamic obstruction. (see Figure 12).
FIGURE 12
Transthoracic echocardiography (5-CH view) imaging of dynamic left ventricular outflow tract obstruction. Panel a shows the continuous wave (CW) Doppler pattern of a dynamic left ventricular outflow tract (LVOT) obstruction due to dobutamine stimulation. Note the typical dagger shape morphology due to the late systolic peak flow. This CW flow pattern differs from the aortic stenosis CW signal. Panel B shows a systolic frame during low-dose dobutamine stress echo at a dose of 20 mg kg-1 min-1. The thickened proximal interventricular septum causes flow acceleration and turbulence in the LVOT
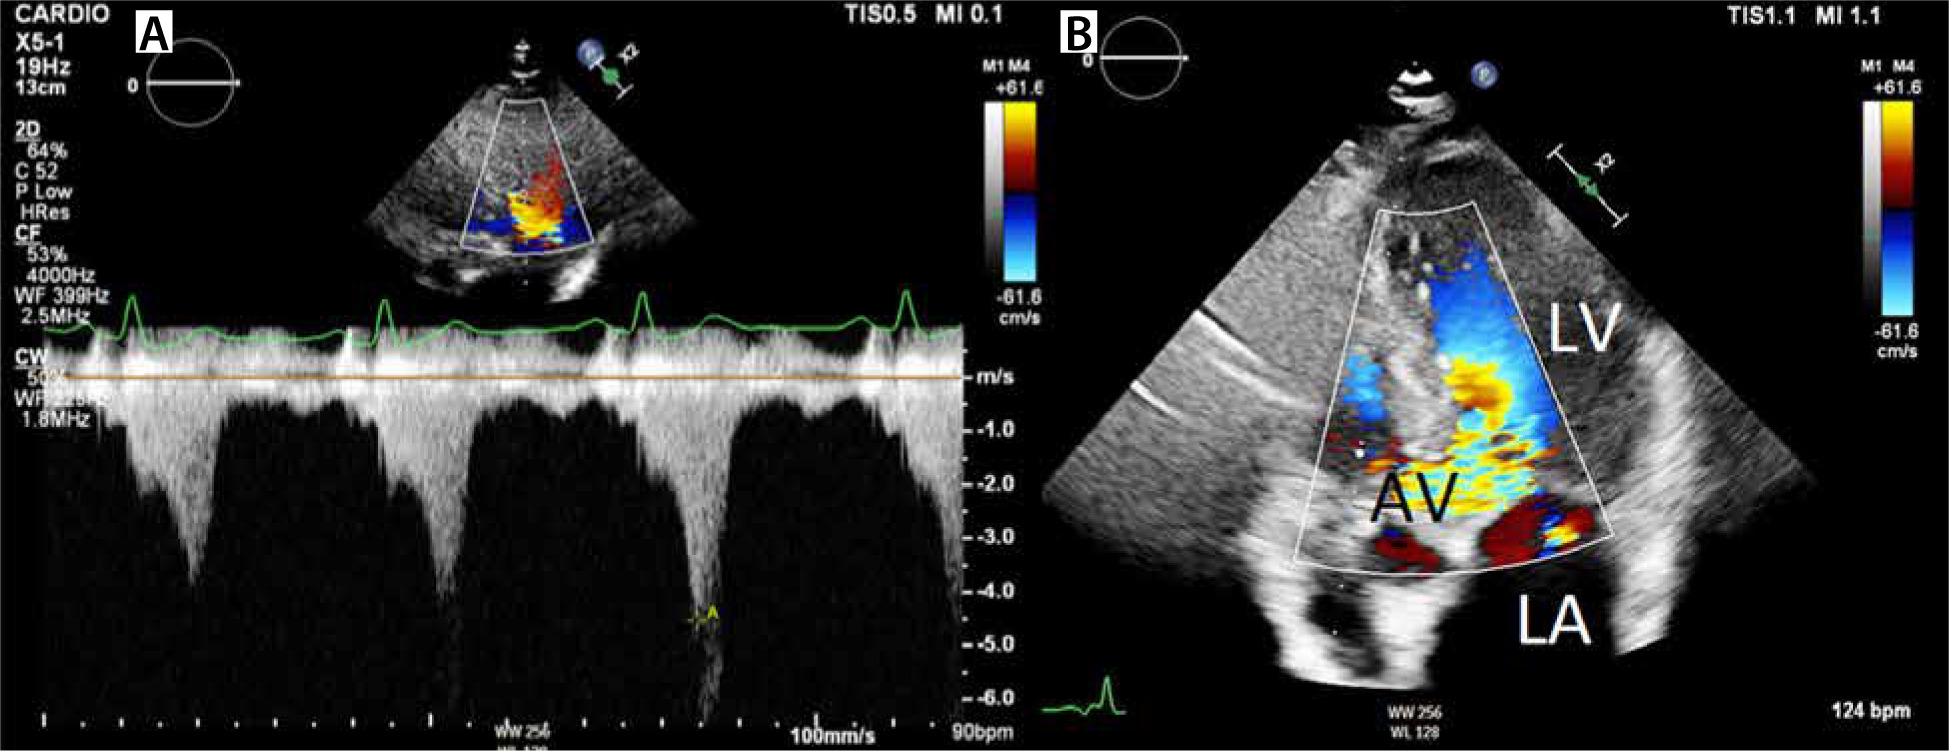
Table 3 lists the differential diagnosis of left ventricular outflow obstruction.
Role of transoesophageal echocardiography in aortic stenosis
The role of transoesophageal echocardiography (TEE) in the work-up of AS severity grading is limited to assessment of the AVA. In TEE imaging, the ultrasound beam cannot be aligned parallel to the blood flow through the LVOT, not allowing quantitative assessment of the gradient across the AV.
However, excellent correlations between AVA by TEE and TTE have been described in subjects with normal systolic function and impaired function. AVA determined by catheterization correlated better with AVA measured by TEE than AVA measured with TTE [23].
TEE may be helpful if concurrent aortic regurgitation or dilatation of the ascending aorta needs to be assessed. The diagnosis of infective endocarditis (IE) of a stenotic aortic valve may be challenging, as sclerotic lesions must be differentiated from the vegetation. In this clinical setting, TEE contributes to the diagnosis, allowing better assessment of the vegetations and extension of the infective process (by detecting abscesses and phlegmon of the valvular annulus).
Finally, when AS has to be differentiated from subaortic stenosis, due to a subvalvular membrane, TEE is helpful, as a thin membranous structure is often difficult to detect using TTE.
Echo strain imaging
There is growing evidence that reduced global longitudinal strain (GLS) is an important predictor of adverse outcome in patients with severe AS [24–26].
In a series of 332 patients with severe AS, no or mild symptoms, and LVEF ≥ 50%, GLS was an effective tool to identify patients with a poor outcome. It was advocated that detection of myocardial dysfunction by identifying GLS magnitude < 15% in patients with severe AS, no or mild symptoms, and LVEF ≥ 50%, improves the risk assessment [24].
A study demonstrated that flow (stoke volume indexed to body surface area (SVI)) and LV global longitudinal strain (GLS) are independently associated with survival after AVR in patients with low-gradient severe AS with preserved LV ejection fraction [26].
Valvular arterial impedance
The concept of valvular arterial impedance (Zva) was developed to measure the global LV load due to vascular afterload and the valve stenosis. Zva is calculated as (SBP+MG)/SVI, where MG is the mean gradient and SBP is the systolic blood pressure [27]. Studies have shown that in asymptomatic patients with moderate or severe AS, Zva > 4.5–5.0 mm Hg mL-1 m-2 is a predictor of reduced event-free survival and a 2.8-fold increased risk of death [27, 28].
Zva does not identify the relative contributions of the valve and vasculature that is necessary to guide management (i.e. AVR versus blood pressure [BP] control) [29].
Invasive work-up and Gorlin equation
Due to the progressive development in the field of echocardiography in the 1980s and 1990s, the role of cardiac catheterization in the work-up for AS has evolved to diagnosing coronary artery disease prior to valve replacement. It was demonstrated that retrograde catheterization across the AV causes (subclinical) cerebral embolization in 22% of cases [30].
According to the guidelines for the management of patients with severe AS, coronary angiography prior to valve replacement is sufficient if clinical symptoms and echocardiographic data agree. However, cardiac catheterization may contribute to solving discrepancies between symptoms and echocardiographic AS severity grading. Like low-dose dobutamine stress echocardiography, catheterization with dobutamine infusion may be performed in patients with low-flow, low-gradient AS and LV dysfunction [31].
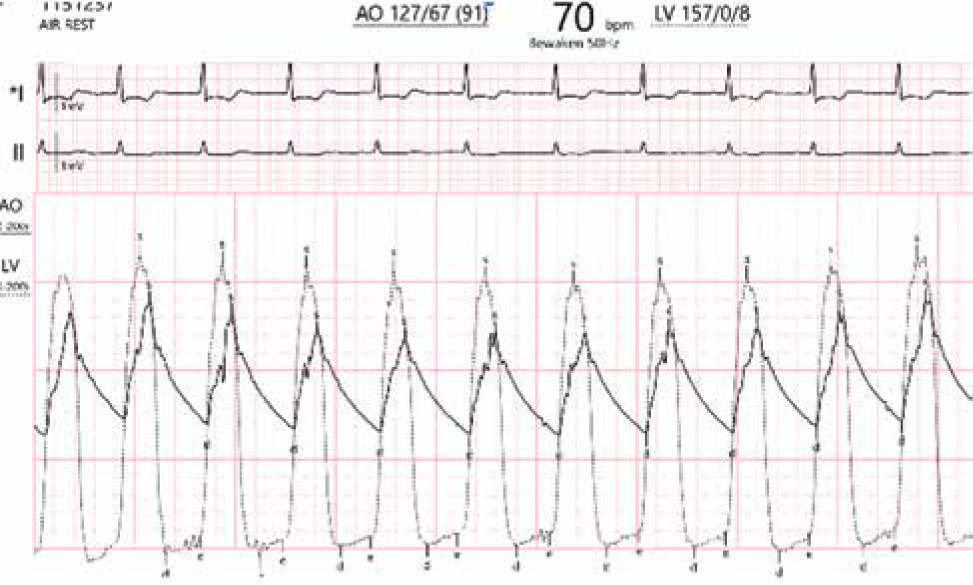
By convention, the pressure gradient (ΔP) is measured between the LV and the ascending aorta, preferably by using double-lumen fluid-filled catheters for simultaneous LV and aortic pressure measurements [32] (Figure 13). There are 2 methods to assess cardiac output (CO) in the cardiac catheterization laboratory: the Fick method and thermodilution [33]. The Fick method relies on obtaining arterial and mixed venous saturations, haemoglobin level, and oxygen consumption [33]. The thermo-dilution method measures the change in temperature, caused by injection of cold saline in the right atrium, as it passes to the thermistor on the Swan-Ganz catheter to calculate CO [33].
FIGURE 13
Invasive assessment of aortic stenosis severity in the catheterization laboratory. Simultaneous measurement of the aortic pressure (127/67 mm Hg) and left ventricular (LV) pressure (157 mm Hg). The peak-to-peak gradient is 157–127 mm Hg = 30 mm Hg, implying that it concerns moderate aortic stenosis. Mean gradient is the area between the LV and aortic pressure curve in systole
Gorlin equation
The Gorlin equation allows calculation of the valve orifice area, when ΔP and CO are measured [34]. Based on principle of preservation of flow (CO equals the product of the flow valve through the valve and valve area), the Gorlin equation provides the mathematical formula relating ΔP and flow rate (Q) to the geometric orifice area (GOA) [34]:
where: Q is flow through the AV (in mL s–1), g – the acceleration due to gravity, ΔP – the pressure drop between the LVOT and VC in cm H2O, and cv – accounts for viscous losses and turbulence.
The constant of 51.6 was derived by using g (980.67 cm s-2) and converting ΔP in cm H2O to mm Hg (1 mm Hg = 1.35 cm H2O). Although the empirical constants were derived for the pulmonary valve, Gorlin and Gorlin suggested that these constants could also be used for the AV (c(c) = 0.85 and c(v) = 1). Thus, the original Gorlin formula can be rewritten:
The original formula by Gorlin and Gorlin, described in 1951, provided an equation for the GOA as a function of the flow through the valve and the pressure drop across the AV [34]. Currently, in most catheterization laboratories, the effective orifice area (EOA) is used instead of the geometrical orifice area (GOA), expressed in the equation below [32]:
where EOA is the smallest cross-section of flow across the AV stenosis at the vena contracta.
The daily clinical practice has proven the utility of the Gorlin formula in the evaluation of patients with AS. The study of Hakki et al. demonstrated the accuracy of valve area determined by means of a simplified formula, easy to remember and to use [32, 35]:
The Gorlin equation quantitatively explains why sepsis has major haemodynamic implications in patients with severe AS. In the assumption that heart rate is constant, the Gorlin equation states that a doubled CO implies that ΔP has to increase 4 times, given the fixed AVA.
Relevant aspects of assessment of aortic valve by cardiac computed tomography and cardiac magnetic resonance imaging
New imaging techniques to assess valvular heart disease have emerged over the last 2 decades. Recently, these new imaging modalities have proved to be useful in the assessment of aortic valve disease, but they have not established a definite place in the guidelines yet. Nonetheless, calcium scoring of the aortic valve by multidetector computed tomography (MDCT) in AS is recommended in the most recent ESC guidelines, when the AS severity assessment by TTE is equivocal [20]. In the ICU setting, the bedside approach of TTE and TEE to assess the cardiac function remains a major advantage [36–38].
This section does not intend to provide a complete review of all CMR and cardiac MDCT studies performed in AS, but to emphasize the potential benefits and pitfalls of these imaging modalities.
Cardiac MDCT aortic valve calcium (AVC) scoring is a technique that may be helpful in clinical decision making, especially in patients with AS and conflicting data, regarding the AS severity, based on inconsistency between the mean gradient and AVA. AVC ≥ 1250 Agatston units (AU) in women and ≥ 2050 AU in men suggests the presence of severe AS [39].
AVA, LVOT area and stroke volume (SV) can be obtained non-invasively using MDCT or MRI and compared with the echocardiography data [39–41]. However, MDCT assessment of SVI implies radiation throughout the entire heart cycle to obtain the peak systolic and end-diastolic frame, while in modern computed tomography coronary angiography (CTCA) preferably only the mid-diastolic phase is imaged, to reduce the radiation burden of the patient.
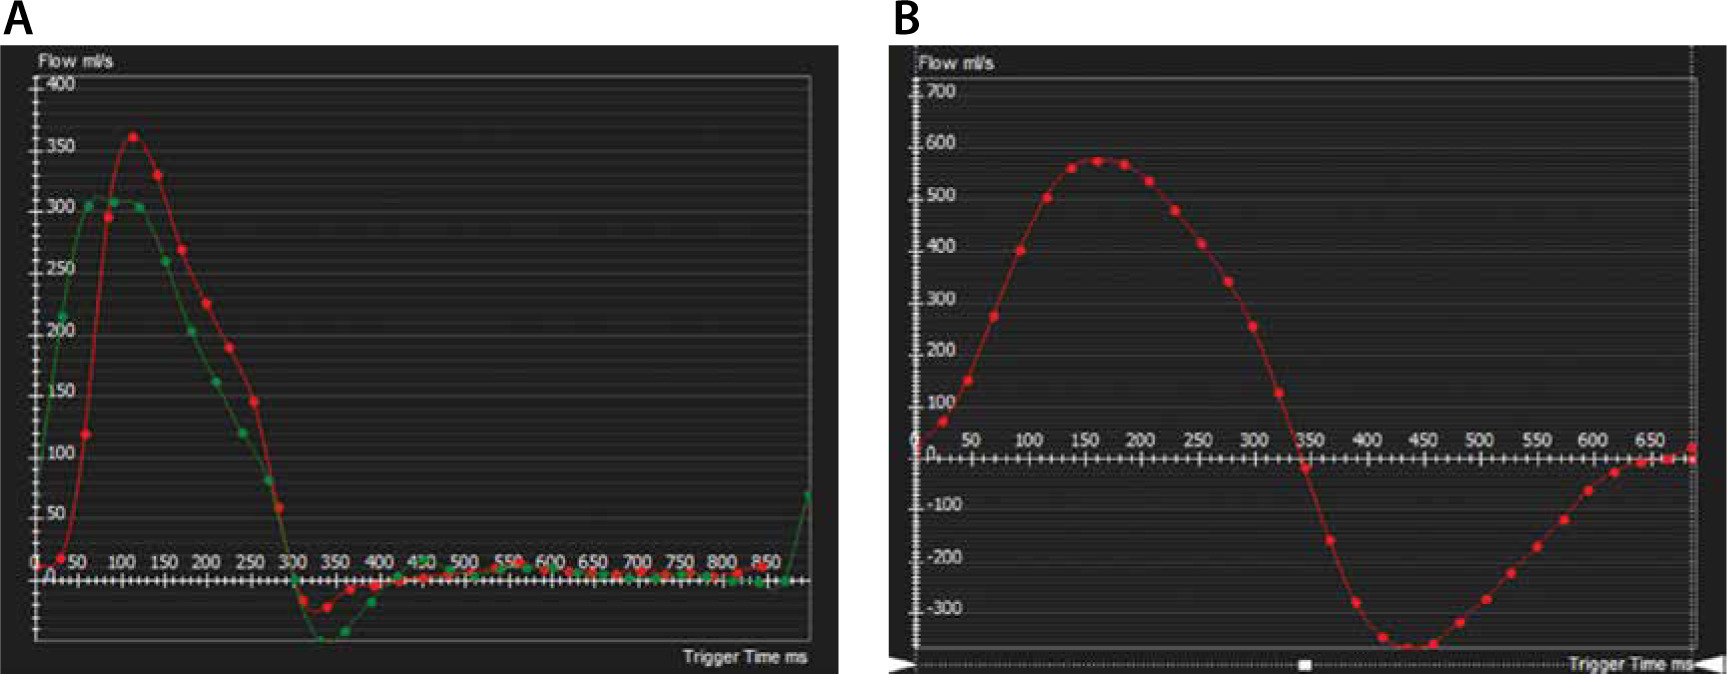
Phase contrast velocity encoded CMR allows accurate volume quantification (Figure 14). CMR has already been proven to be a reliable tool to quantify intracardiac shunting. Also, assessment of pulmonary insufficiency by CMR in congenital (paediatric) cardiology has been proven to be extremely useful, as this pulmonary valve is often difficult to assess by TTE/TEE. CMR allows one to select the optimal plane of the valve. Phase contrast velocity encoded CMR uses the dephasing of blood to quantify the blood velocity and eliminates the angulation problem of echocardiography. Studies have demonstrated the echocardiography measured AVA correlates well with AVA, measured by velocity encoded phase contrast CMR, using the continuity equations [40].
FIGURE 14
Cardiac magnetic resonance imaging (CMR): velocity encoded phase contrast measurements of transvalvular flow. Example of velocity encoded phase contrast measurements of the flow across the aortic valve plane (red) and the pulmonary valve plane (green). This technique is accurate for assessment of the blood volume, and therefore in assessing intracardiac shunting and measuring valve regurgitation. Note the red and green bullets on the curve, showing the measured values. The temporal resolution of CMR is lower than echocardiography (see text). Panel B shows an example of a regurgitant pulmonic valve. The forward and backward flow can be quantified
In the setting of AS, the lower temporal resolution of the velocity encoded CMR, compared to echocardiography, is a major disadvantage when the peak gradient must be determined. The more frames of the systole there are, the higher is the chance to select the real peak velocity.
Magnetic resonance imaging is the medical imaging modality that provides the best tissue characteri-zation. CMR studies using late gadolinium enhancement imaging, native T1 mapping and determination of extracellular volume (ECV), by native and post-gadolinium T1 mapping, have demonstrated the ability of CMR to detect scarring and oedema in patients with AS [42–44]. It sounds reasonable that patients with evidence of intracardiac scars and/or oedema will benefit from early AVR. However, more research is needed to determine the exact role of CMR tissue characterization in the treatment strategy.
Take home messages on the contribution of MDCT and CMR to the assessment of AS
Cardiac MDCT aortic valve calcium (AVC) scoring is useful to assess AS severity, in case of discordancy between TTE obtained AVA and mean gradient.
CMR T1 mapping and late gadolinium enhancement allow myocardial scar quantification and determination of ECV in patients with severe AS.
Phase contrast velocity encoded CMR allows adequate volume quantification (to determine flow/regurgitant volumes). CMR allows adequate measurement of SVI. Given the accurate voluminometric assessment by CMR, AVA can be calculated using the continuity equation. Due its lower temporal resolution than echocardiography, CMR is less accurate to depict the transaortic valve peak velocity.
Specific condition of low-output, low-gradient aortic stenosis in patients with reduced left ventricular ejection fraction. The role of low-dose dobutamine stress echocardiography
As mentioned earlier, the echo Doppler measured AS gradients and calculated AVA need to be in accordance to conclusively diagnose severe AS. In case of discordance between the AVA and gradients across the AVA, the clinician and consultant cardiologist must go back through the measurements and the acquired images, to sort out the cause of the inconsistency between the data (e.g. inadequate measurement of the LVOT diameter).
A special, but not uncommon, scenario should be recognized: low-output, low-gradient AS in patients with reduced LV EF. Suspicion of this clinical entity should be raised in patients with AS and (moderately to severely) reduced LV systolic function, an AVA ≤ 1cm2, an VTILVOT/VTIAVA ratio of ≤ 0.25 and AS gradients not reaching the criterion of severe AS.
Te differential diagnosis should be made between severe low-output, low-gradient AS, in which the impaired LV systolic function is no longer able to build a high transaortic valve gradient, versus truly moderate AS in a patient with reduced LV EF.
Low-dose dobutamine stress echocardiography contributes to the diagnosis of low-flow, low-gradient AS. In a case of severe AS, a proportional increase VTILVOT and VTIAVA with preservation of the VTILVOT/VTIAVA ratio after intravenous administration low-dose dobutamine (10–20 mg kg-1 min-1) is expected [45] (Figure 15). Further increase in peak velocity above 4 m s-1 is also an indirect sign of severe AS.
FIGURE 15
Low-dose dobutamine stress echocardiography. This is an example of a low-dose dobutamine stress echo (DSE) in a 67-yearold man, who was in follow-up in the outpatient clinic for aortic stenosis. Until 2 months before the low-dose DSE, the patient had been asymptomatic. Over the last two months, symptoms of fatigue and exertional dyspnoea appeared. In the transthoracic echocardiography study, there was inconsistency between the calculated aortic valve area of 0.9 cm2 and a peak velocity of 375 cm s-1. Furthermore, the left ventricular ejection fractionhad dropped to 45%, while the systolic function was still normal 8 months ago. A quality control of the Doppler signals and measurement and LVOT could not reveal inadequate data acquisition. A VTILVOT of 22 cm was measured, which is in the normal range and could not be well reconciled with the reduced systolic function. On the other hand, the large build of the patient (height: 196 cm, weight: 96 kg, BSA 2.3 m2) may explain this unexpected finding. SVI (indexed stroke volume) was 30.7 mL m-2 (normal ≥ 35 mL m-2), confirming that there was a reduced stroke volume. Low-dose DSE found at rest: VTILVOT: 22.3 cm, VTIAVA: 88.9 cm, peak velocity 375 cm s-1, mean/peak gradient 30.6/56.2 mm Hg, and VTIAVA/ VTILVOT ratio = 0.25. Low-dose DSE after administration of intravenous dobutamine 20 mg kg-1 min-1: VTILVOT: 25 cm, VTIAVA: 98 cm, peak velocity 503 cm s-1, mean/peak gradient 51/101 mm Hg, and VTIAVA/ VTILVOT ratio = 0.25. It was concluded that the patient suffered from severe AS (VTIAVA/VTILVOT ratio = 0.25 and remained stable throughout the low-dose DSE examination; the peak and mean gradient after low-dose DSE were consistent with severe AS). The patient was referred for aortic valve replacement. The systolic function recovered
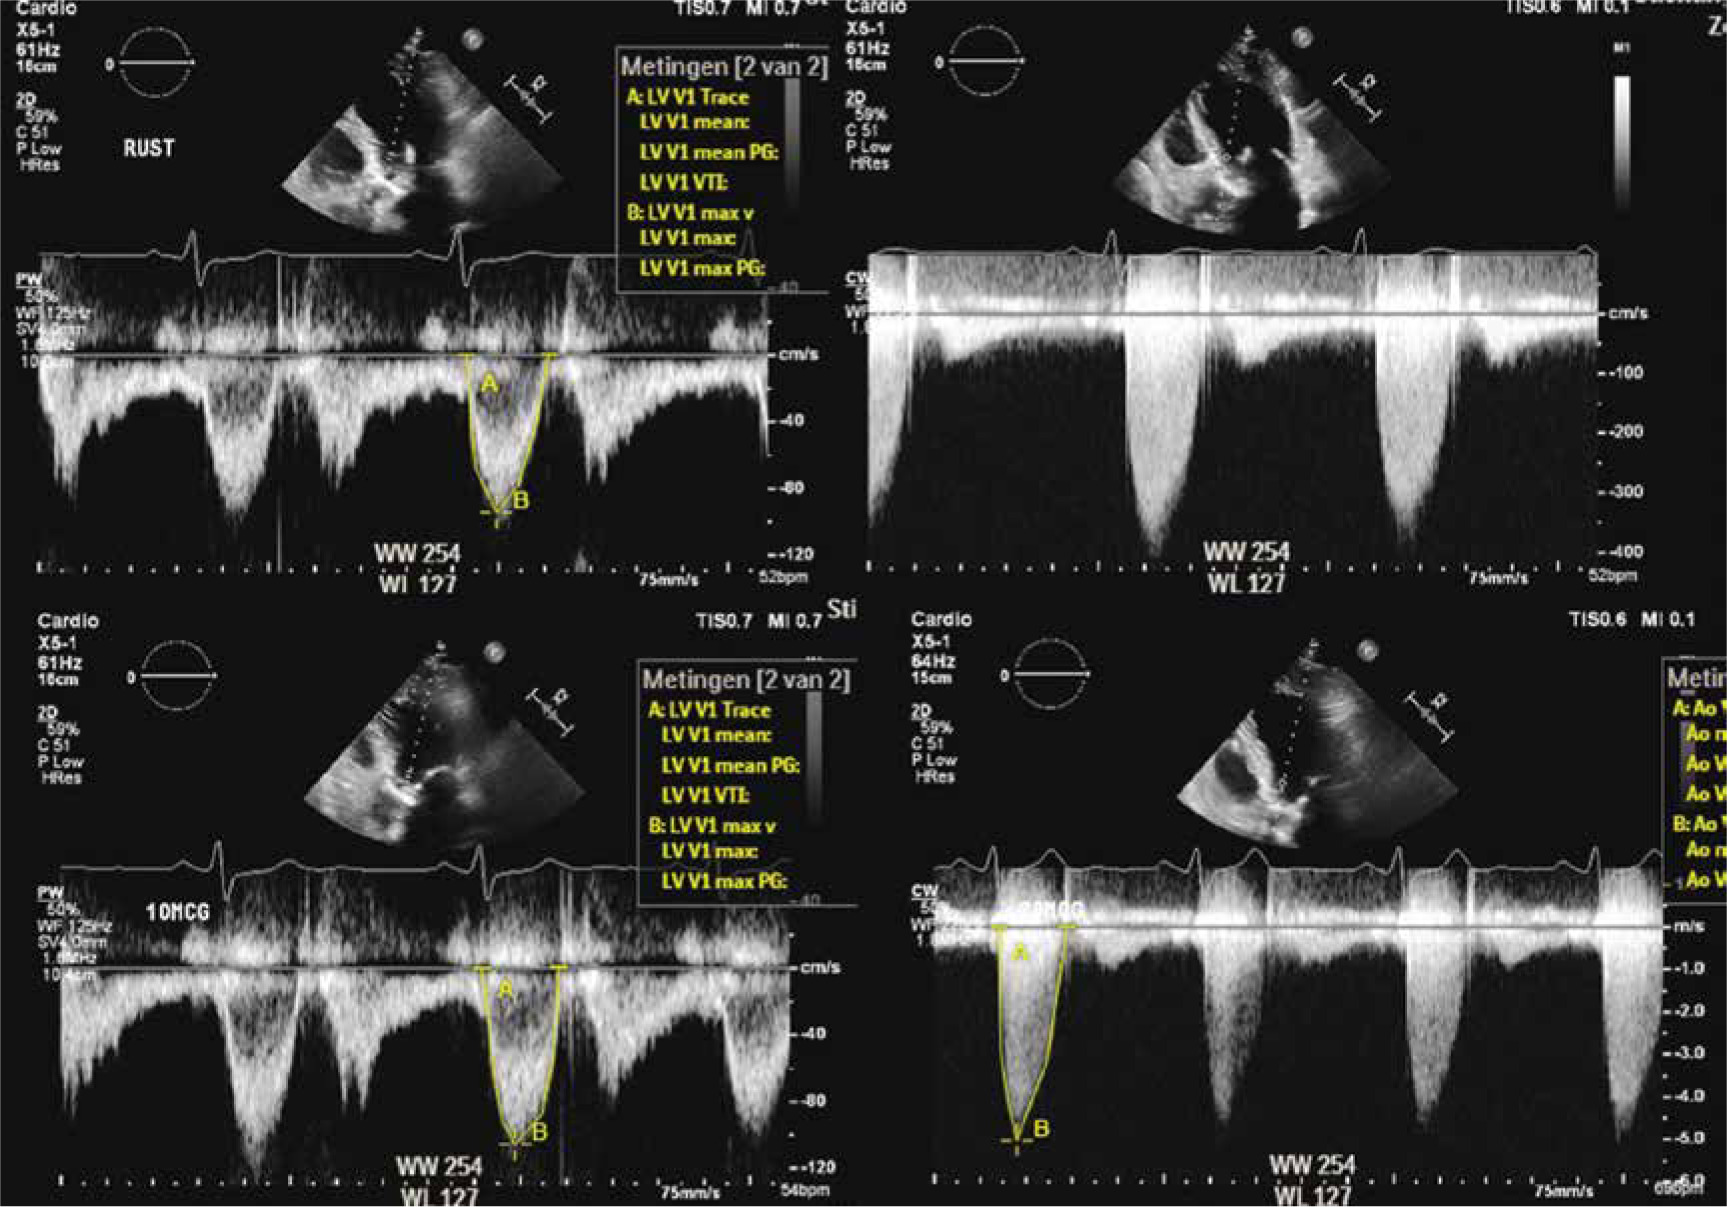
In the case of truly moderate stenosis in patients with reduced LV EF, low-dose dobutamine stimulation is expected to increase VTILVOT with no (or modest) increase in VTIAVA, resulting in an increased VTILVOT/VTIAVA ratio and no or a modest increase in peak velocity across the AV. Figure 15 illustrates this principle.
Furthermore, low-dose dobutamine stress echo has demonstrated that patients with contractile reserve have a better prognosis after AVR/TAVR than patients without contractile reserve.
Specific condition of Flow Pressure Gradient Classification
After qualitative review of the acquired images and measurements, a discrepancy between mean gradient and AVA may remain. According to the medical literature, inconsistency between AVA and mean gradient in AS severity grading occurs frequently, with reported incidences between 20% and 30% [46].
In small patients, an AVA of 1 cm2 may not be critical, while an AVA of 1.1 cm may be critical in a large individual. To overcome this issue, indexing of AVA to body surface area (AVAI) has been advocated, with a proposed threshold of 0.6 cm2 m-2 as a criterion for severe AS [21–47].
However, AVAI was unable to solve most problems of the discrepancy between AVA and mean pressure/peak velocity. Therefore, the concept of Flow Pressure Gradient was introduced. Patients with AVA ≤1.0 cm2 and a normal LVEF can be classified into four subtypes based on the presence of [29]:
normal flow (NF) or low flow (LF) (stroke volume indexed (SVI) ≥ or < 35 mL m-2); and
high mean gradient (HG) or low mean gradient (LG) (mean gradient ≥ or < 40 mm Hg).
Most patients have the NF/HG pattern, in which AVA and mean gradient are consistent with severe AS and SVI is normal. The NF/LG pattern includes patients with inherent inconsistencies in the threshold for severe AS. Often, these patients have a small body size, and prolonged ejection times, and normal SVI, but the transvalvular flow rate is reduced. In the LF/HG pattern, there is discordance between the haemodynamic indices (normal mean gradient) and the low flow state. This group represent patients with intrinsic LV dysfunction, despite a normal LVEF. The LF/LG pattern characterizes the group of patients with discordant haemodynamic indices and a low flow state [29].
These 4 subgroups of patients with severe AS have different prognoses after valve replacement, with the LF/LG subgroup having the worst outcome [48–50].
Take home messages on Flow Pressure Gradient Classification
The Flow Pressure Gradient Classification offers a tool to further stratify patients with presumably severe AS with preserved LV EF but discordancy between AS mean gradient and AVA:
Normal flow (NF) and low flow (LF): stroke volume indexed (SVI) ≥ and < 35 mL m-2, respectively.
High mean gradient (HG) and low gradient (LG): mean gradient ≥ or < 40 mm Hg, respectively.
Based on both variables the population with severe AS can be differentiated in 4 categories: HF/HG, HF/LG, LF/LG and LF/HG.
ESC guidelines: criteria that increase the likelihood of severe aortic stenosis in patients with inconsistent aortic valve area and mean gradient (AVA < 1 cm2 and mean gradient < 40 mm Hg)
To deal with the relatively common problem of inconsistency between AVA and mean gradient, the European Society of Cardiology 2017 guidelines for valvular heart disease offer the physician some tools to help decide which of these patients are likely to have severe AS. These criteria for a high likelihood of severe AS are subdivided into 3 categories [20]:
Clinical criteria:
Qualitative assessment:
Quantitative assessment:
Treatment of aortic stenosis
Symptoms or gradients?
Alarm symptoms are very important signs for critical care and emergency health care providers. Syncope, angina pectoris and heart failure are symptoms that might indicate that aortic stenosis is becoming symptomatic and survival is thus dramatically reduced to 50% in a 1–3 year window. Referral to a cardiologist and a diagnostic work-up for aortic valve replacement are necessary [20].
For asymptomatic AS, the gradients and aortic valve area are indicative for timing of invasive therapy. For reasons of clarity one might use the following heuristic: aortic valve area (AVA) of less than 1.0 cm2 and mean gradient ≥ 40 mm Hg are regarded as an indication for replacement or valvuloplasty [20].
There are many pitfalls to this heuristic, but they would lead us into the specialized field of low output and other considerations (see Special Scenarios section). This is beyond the scope of critical care.
Mechanical therapy
Once the decision for mechanical correction has been made, the choice of modality roughly depends on age and physical performance. Below the age of 70 a mechanical prosthesis is the rule. Over the age of 70, cardiac surgery is reserved for patients with reasonable overall fitness and performance. A bio-prosthesis would be the optimal choice, even nowadays.
If the risks of cardiac surgery would outweigh the benefit, a catheter-based intervention would be an option: transcatheter aortic valve implant (TAVI) with a stent mounted valve. Early TAVI and its indication are under investigation, and it looks promising for broader use in the near future.
In selected cases it is possible to perform only a valve commissurotomy with a balloon: percutaneous transluminal aortic valvuloplasty (PTAV). Since PTAV only “cracks” the valve (and does not replace it), this technique is inferior to TAVI. If the ICU is located in a facility with interventional cardiology, PTAV could be considered in some selected ICU cases. It should be emphasized that PTAV is not the final treatment of symptomatic AS, but a bridge to AVR/TAVI after recovery from the medical conditions leading to hospitalization in the ICU.
ICU and aortic stenosis
In the ICU, aortic stenosis will frequently be diagnosed in patients as an incidental clinical finding in the asymptomatic state. Furthermore, the admission to the ICU, due to non-cardiac pathology, precludes that the patient is in a stable state to evaluate the aortic valve function in a steady state. The ICU is thus not the time or place to consider indications for actual/future surgical repair. However, the existence of an aortic stenosis may have implications for current therapy goals.
Aortic stenosis and ICU medical management
Since cardiac output is reduced and coronary perfusion compromised, ejection time has to be preserved and facilitated. The use of beta blockers for rate control is thus pivotal: try to maintain the rate at the lower limit of normal, within 50–60 per minute. Beta blockers have long been considered deleterious in AS, but recent studies suggest safe use [51] and improved survival [52].
Atrial filling is responsible for 20-25% of ventricular filling [53, 54]. Atrial fibrillation must be treated aggressively.
Filling pressures have to be maintained, for obvious reasons. There is still a debate as to the extent of filling.
Some references go for optimal perfusion pressures and aim at the ‘verge of pulmonary oedema’ and thus compromise on ventilation pressures.
Others aim at ‘low normal’ and thus compromise general perfusion and renal function, to optimize ventilatory settings.
The therapy choice might be guided by the most imminent problem at hand. It would be wise to opt for higher filling pressures at first to favour perfusion and switch to lower levels if weaning from ventilation is desired.
In order to correct filling pressures diuretic therapy is preferred over vasodilators.
In the ICU the use of dilators for short periods might be necessary, but severe hypotension must be avoided.
Systemic diastolic pressure must be maintained above 70 mm Hg [55].
The heart is already working hard to overcome the narrow stenosis, so it is only logical to avoid excessive afterload. In patients with aortic stenosis mean arterial pressures will be low and there will be no need to give anti-hypertensive drugs, as a rule. However, the ICU patient frequently needs epinephrine for treatment of sepsis (etc.). In the latter case it is important to monitor systemic vascular resistance (SVR). Again, two schools exist:
some aim for low normal values (700–1000 dynes × s cm-5) to decrease work effort,
others aim above 1000 dynes × s cm-5 to favour perfusion.
We consider the advantages in the afterload discussion more in favour for the ‘low normal’ variant.
Conclusions
Aortic stenosis causes left ventricular outflow obstruction. Severe AS has major haemodynamic implications in critically ill patients, in whom increased cardiac output and oxygen delivery are often required.
Echocardiography plays a key role in the assessment of AS severity. AVA, mean and peak gradient are the basic elements in the echocardiographic assessment of AS. Agreement between AVA and mean gradient is required to establish the AS severity grading. A good understanding of some essential underlying assumptions in echocardiography is mandatory to interpret the results of an echocardiographic study (Tables 4 and 5) and to avoid the many pitfalls in AS severity grading.
TABLE 4
Assessment of aortic stenosis severity: summary of the take home messages
TABLE 5
Haemodynamic parameters that can be derived from TTE/TEE and invasive work-up of aortic stenosis
| Parameter | View | Calculation | Comments |
|---|---|---|---|
| Cross sectional area (CSA) | PLAX | CSA = 3.14 × (D/2)2 = 0.785 × D2 | 2.6–3.1 cm2 |
| Velocity time integral (VTI) | 5CH | Pulsed wave Doppler measured at the LVOT | 20–25 cm VTI > 20 cm refers to a normal CO |
| Stroke volume (SV) | 5CH | SV = VTI × CSA, with VTI the velocity time integral | |
| Cardiac output (CO) | 5CH | CO (cm3 min-1) = SV × HR = HR (bpm) × CSA (cm2) × VTI (cm) | For quick bedside calculation in the ICU, CSA can be assumed to be around 3 cm2 CO (mL min-1) = 3 × HR × VTILVOT |
| Left ventricle outflow tract (LVOT) at diastole | Simulation | LVOTd = 5.7 x BSA + 12.1 | 1.8 for females and 2.0 for males TTE tends to underestimate the LVOT by 0.1 cm |
| Left ventricular ejection fraction | PLAX 4CH | LVEF = (LVEDV – LVESV)/LVEDV | Normal LVEF is above 55% |
| Fractional shortening (FS) | PSAX PLAX | FS = (LVEDD – LVESD/LVEDD) | Normal FS is between 25 and 40% |
| Fractional area contraction (FAC) | PSAX | FAC = (LVEDA – LVESA/LVEDA) | Normal FAC is between 35–45% |
| Contractility dP/dt | 4CH | Continuous wave signal | • The normal dP/dt is > 1200 mm Hg s-1 • dP/dt between 800 to 1200 mm Hg s-1 suggests mild LV dysfunction • dP/dt < 800 mm Hg s-1 severe LV contractile dysfunction |
| Diastolic (dys)function | 4CH | E/A ratio DT, IRT, isovolumetric relaxation time | Impaired relaxation (e.g. hypertrophy): • Decreased E velocity • Increased A velocity • E/A ratio < 1 • Prolonged DT (> 160 ms) • Prolonged IRT (> 90 ms) |
| AS peak gradient | 5CH | ΔP = 4 × (Vmax AVA)2 | • This formula can only been used in absence of LVOT obstruction • AS peak velocity ≥ 400 cm s-1: severe AS |
| AVA (aortic valve area) | 5CH PLAX | AVA = 0.785 × (DLVOT)2 × VTILVOT/ VTIAVA | • Severe AS: AVA ≤ 1 cm2 |
| GOA: geometric orifice area (Gorlin formula) | N/A | • Invasive work-up in the catherization laboratory of AS | |
| EOA: effective orifice area (simplified Gorlin formula by Hakki) [35] | N/A | • This simplified formula allows a quick estimation of the AS severity |
[i] PLAX – parasternal long axis view, PSAX – parasternal short axis view, 5CH – apical 5-chamber view, 4CH – apical 4-chamber view, D – LVOTd, LVEDV(D): left ventricular end-diastolic volume (diameter), LVESV(D) – left ventricular end-systolic volume (diameter), LVEDA – LV end-diastolic area, LVESA – LV end-systolic area, DT – deceleration time, LAP – left atrial pressure, PEP – pre ejection period, AcT – acceleration time, ET – ejection time, CO – cardiac output measured by thermodilution or Fick method