
Summary
Echocardiography is the cheapest and the most routinely used method to assess left ventricle geometry and function, but it can be limited. In this study, we found that cardiac computed tomography could be considered as an alternative method in assessing left ventricle morphology. Direct comparison of corresponding left ventricle parameters measured in transthoracic echocardiography and cardiac computed tomography revealed some significant difference between the two imaging modalities.
Introduction
Aortic valve stenosis has a complex effect on left ventricle (LV) geometry and function. Aortic stenosis should be regarded as a clinical syndrome involving the aortic valve as well as the LV. Elevated due to decreased aortic valve area, end-systolic LV pressure may subsequently cause left ventricular dysfunction with cavity enlargement and impairment of contractility. Additionally, severe aortic stenosis may aggravate subendocardial ischemia with a detrimental effect on LV function [1]. Taking into consideration this complication, the LV should be given greater priority when assessing and treating aortic valve stenosis [2].
Standard two-dimensional transthoracic echocardiography (TTE) is a great tool for clinical assessment of most cardiac structures. Nevertheless, 2D-TTE often is not sufficient to properly visualize the complicated geometry of the aortic valve and LV which, however, can be successfully visualized by the modern imaging methods that are increasingly available. Three-dimensional (3D) imaging allows detailed and spatial assessment of even the most complex cardiac structures. One of the best clinical imaging modalities that can be used for this purpose is contrast-enhanced, electrocardiologically gated cardiac computed tomography. Nowadays, in addition to standard imaging protocols, we have an opportunity to use image segmentation, which allows us to identify chosen anatomical structures and to show their spatial image and in effect it delivers a huge dose of detailed morphometrical information. Semi-automatic segmentation is a very promising tool that can easily provide high-quality segmentation of the heart chambers and vessels obtained from images using computed tomography with a little human participation [3].
Cardiac computed tomography is a standard imaging test performed to assess the aortic valve structure before qualification for transcatheter aortic valve implantation (TAVI). Unfortunately, even though it provides data on other heart structures as well, it is not routinely used to obtain information on LV morphology.
Aim
Therefore, in this study we sought to compare cardiac computed tomography and TTE as tools for assessing geometry and function of the LV in patients with severe aortic stenosis.
Material and methods
This study was approved by the Bioethical Committee of the Jagiellonian University, Krakow, Poland (No. 1072.6120.179.2020). The study protocol conforms to the ethical guidelines of the 1975 Declaration of Helsinki.
Study population
We analyzed 58 consecutive patients (43.1% males, mean age: 81.4 ±6.0 years) with severe aortic stenosis admitted to the 2nd Department of Cardiology and Cardiovascular Interventions, University Hospital in Krakow between August 2016 and July 2019, who had cardiac computed tomography and TTE performed before qualification for the TAVI procedure. Both examinations were conducted within 2 months. All included patients had high risk or serious contraindications for surgical aortic valve replacement and were qualified for the TAVI procedure by a multidisciplinary heart team.
Echocardiographic assessment
All patients underwent standard protocol 2D and 3D TTE using a Vivid E9 (GE Healthcare, Waukesha, WI, USA) echocardiograph with an M5Sc probe (GE Healthcare, Waukesha, WI, USA) for 2D imaging and the 4Vc-D volumetric probe (GE Healthcare, Waukesha, WI, USA) for 3D imaging. Recorded images were stored for further off-line analysis using a dedicated workstation (EchoPAC, GE Healthcare, Waukesha, WI, USA). All linear measurements were taken using virtual calipers. Diagnosis of severe aortic stenosis and all echocardiography measurements were performed according to the current recommendations [4, 5].
The following LV geometry parameters and LV function indicators were assessed (Figure 1):
Figure 1
Transthoracic echocardiography images showing performed measurement: end-diastolic LV diameter in parasternal long-axis (A), major and minor dimensions of LV in four-chamber view (B), major LV axis in three-chamber view (C); distance between heads of left ventricular papillary muscle in parasternal short axis view (D), LV ejection fraction assessed using the biplane Simpson method - end-diastole view in four-chamber (E), LV ejection fraction assessed using 3D triplane analysis (F)
LV – left ventricle, RV – right ventricle, LA – left atrium, RA – right atrium.
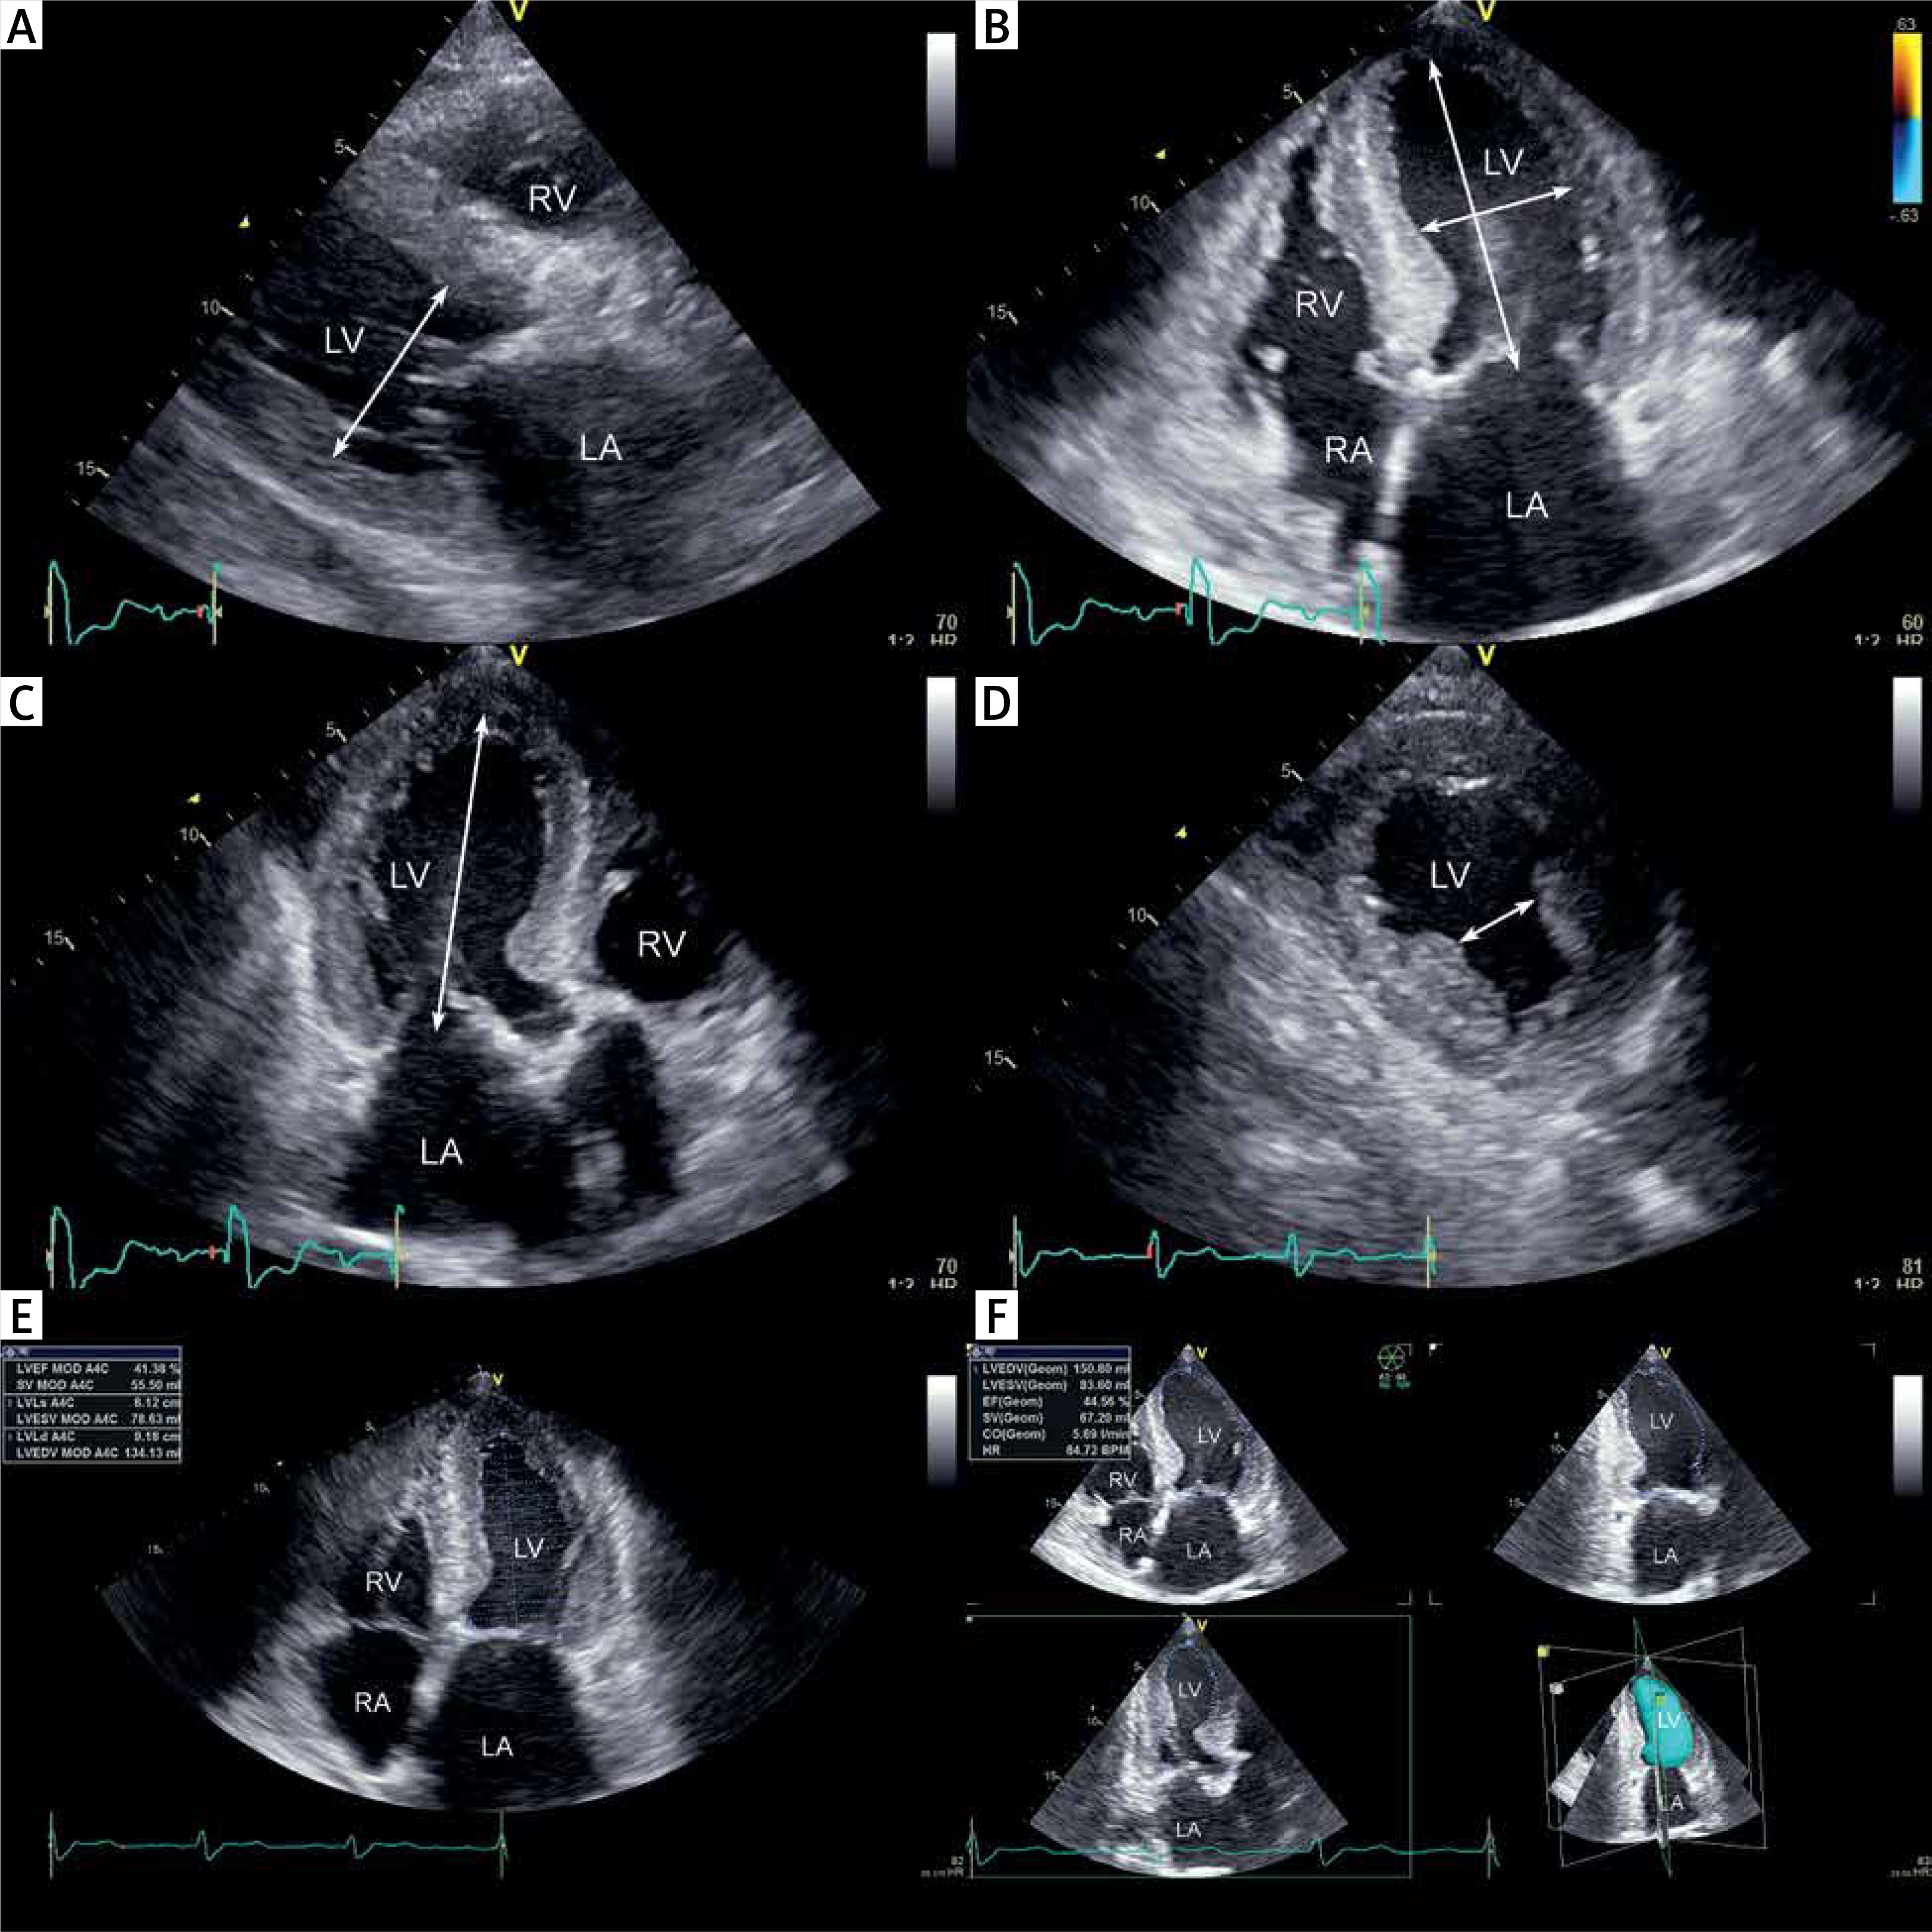
– end-diastolic and end-systolic LV diameters in parasternal long-axis view (2D),
– major and minor dimensions (axes) of LV in apical four-chamber view (end-diastolic, 2D),
– major LV axis in three-chamber view (end-diastolic, 2D),
– distance between heads of left ventricular papillary muscle in end-diastolic phase in parasternal short axis view (2D),
– systolic and diastolic ventricular volumes and stroke volumes, assessed using two methods: the biplane Simpson method of disc summation, based on manual tracking of endocardium in end-systole and end-diastole in standard 2D four-chamber and two-chamber views (1); and 3D triplane analysis of left ventricular algorithm required manual tracing of LV endocardium in end-diastole and end-systole. In three planes the LV is intersected in the longitudinal axis every 60°, which represents standard apical four-, three- and two-chamber views (2),
– LV ejection fraction was assessed using three methods: visual estimation (1), biplane Simpson method (2), and 3D triplane analysis (3),
– LV mass using formula: 0.8{1.04[(LV end-diastolic diameter + interventricular septal thickness at end-diastole + posterior wall thickness at end-diastole)3 – LV end-diastolic diameter3]} + 0.6.
Additionally, we assessed parameters of aortic valve severity and grade of aortic and mitral regurgitation. All measurements were performed by two independent investigators and the mean of two values was calculated and reported as a final value.
Cardiac computed tomography
Cardiac computed tomography was performed using a 64-row dual-source scanner (Aquilion 64, Toshiba Medical Systems, Tokyo, Japan). The contrast-enhanced electrocardiogram-gated image acquisitions were performed during inspiratory breath hold. The imaging parameters of the scanner were a tube voltage of 100–120 kV and an effective tube current of 350–400 mA. The collimation and temporal resolution were 2 × 32 × 0.6 mm and 165 ms, respectively. Contrast agent was injected at a dose of 1.0 ml/kg and a rate of 5.5 ml/s followed by 40 ml of saline at the same rate. The acquisition delay was the time of maximum density of the ascending aorta in the test bolus with an additional 6 s of delay. Images were reconstructed with a B26f and B46f kernel and an image matrix of 512 × 512 pixels. Multiphase reconstruction (from 10 to 100%) was performed and 30% (LV end-systole) and 70% (LV end-diastole) image reconstructions were evaluated. The postprocessing, study evaluations and measurements were performed using multiplanar reconstructions. Three-dimensional reconstruction and visualization software (Mimics Innovation Suite 22, Materialise, Plymouth, MI, USA) was used for heart chamber semi-automatic segmentation (blood pool) and myocardial manual segmentation (tissue segmentation) to visualize 3D structure of the left ventricle and to conduct all measurements. Linear measurements were taken using virtual calipers. We assessed and measured (Figure 2):
Figure 2
Blood pool left ventricle 3D reconstructions (end-diastole) segmented from contrast enhanced computed tomography of the heart with marked measured dimensions (Mimics Innovation Suite 22, Materialise): a plane formed by the apex of the LV and the inter-commissural mitral annulus diameter (A), LV major dimension (B), formation of a perpendicular plane in the middle of the LV major axis (C, D), perpendicular dimension to inter-commissural mitral annulus diameter (black narrow) and parallel dimension to inter-commissural mitral annulus diameter (LV minor dimensions) (white narrow) (E), LV width at papillary muscle head level (F)
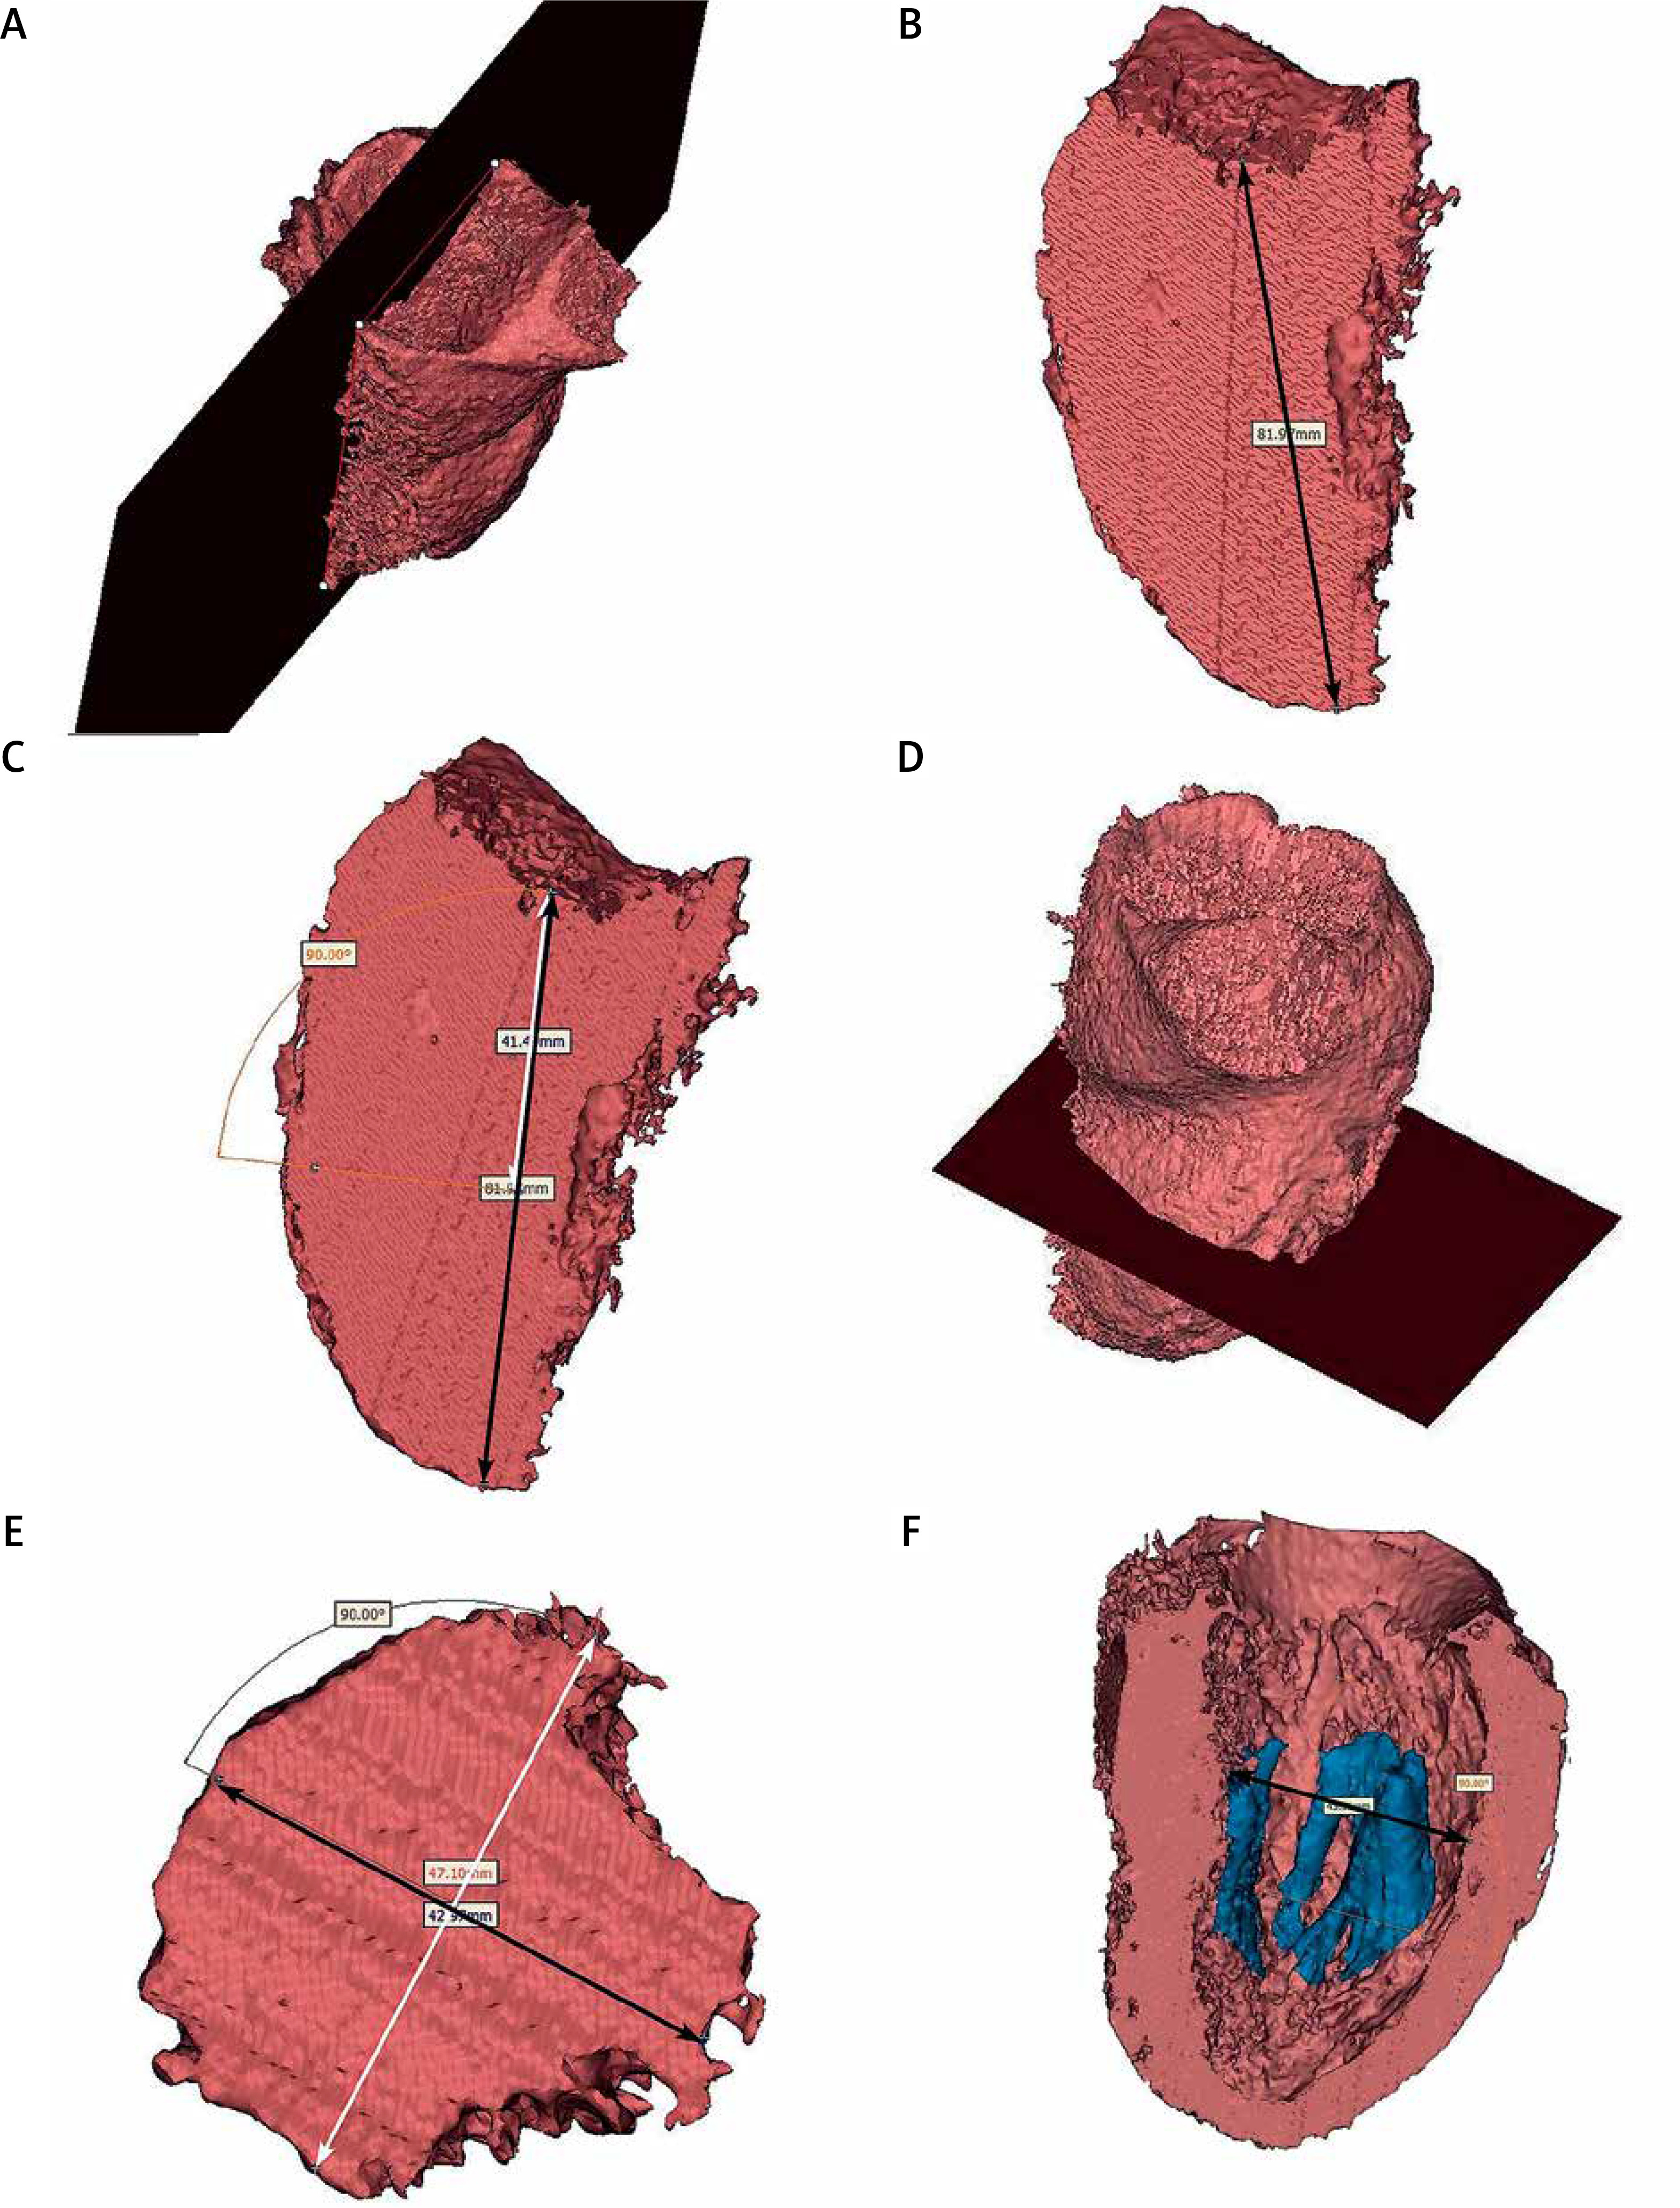
– LV major axis diameter, defined by a plane of blood pool formed by the apex of the LV and the inter-commissural mitral annulus diameter (LV major dimension) in end-systole and end-diastole,
– the LV major axis was next intersected with a perpendicular plane in its middle point. Two dimensions in this plane were measured: perpendicular to inter-commissural mitral annulus diameter and parallel to inter-commissural mitral annulus diameter (LV minor dimension) in end-systole and end-diastole,
– LV width at papillary muscle head level, measured at the level of the lowest visible papillary muscle, perpendicular to the long axis of the LV in end-systole and end-diastole,
These measurements do not include the LV wall.
– systolic and diastolic ventricular volumes calculated from the blood pool segmentation,
– stroke volume assessed by subtracting the end-systole from end-diastole ventricular volume,
– LV ejection fraction calculated as the difference between end-diastole volume and end-systolic volume divided by end-diastole volume,
– LV mass calculated as myocardial volume in cm3 × 1.05 g/cm3. Myocardial volume was automatically calculated based on three-dimensional reconstruction of LV myocardium.
All measurements were performed by two independent investigators and the mean of two values was calculated and reported as a final value.
Statistical analysis
Standard descriptive statistical methods were used. Continuous variables were presented as mean of values with their corresponding standard deviations (SD). Categorical results were presented as numbers and percentages. The normality of the data was assessed with the Shapiro-Wilk test. The Wilcoxon signed-rank test with Bonferroni corrections to account for the multiple comparisons was used to compare measurements. The intra-class correlation coefficient (ICC) for a relative measure of interobserver variability was calculated. An ICC value of 0.7–0.8 indicated a strong agreement; a value > 0.8 indicated excellent agreement [6]. We performed statistical analyses with Statistica v13 (StatSoft Inc., Tulsa, OK, USA). The statistical significance was set at a p-value lower than 0.05.
Results
Clinical and echocardiographic characteristics of studied patients are shown in Table I. All patients suffered from severe aortic valve stenosis that was accompanied with at least moderate aortic regurgitation in 25.9% or at least moderate mitral regurgitation in 31.0% (Table I).
Table I
Clinical and echocardiographic characteristics of studied patients (n = 58)
The detailed results of all performed measurements and calculations in TTE and cardiac computed tomography are shown in Table II. The image quality was not significantly different between TTE and computed tomography and none of the images was considered nondiagnostic. Calculated interobserver variability showed almost perfect agreement for all sets of performed measurements (ICC > 0.80).
Table II
Results of obtained left ventricle (LV) parameters in transthoracic echocardiography and cardiac computed tomography. Data are presented as mean ± standard deviation (SD)
When analyzing TTE results no significant difference was found in LV major axis measurements in two different views (four-chamber view: 74.6 ±13.5 mm vs. three-chamber view: 76.8 ±9.1 mm, p = 0.306). Also, no difference was found between two estimation TTE methods in measured end-diastolic (2D biplane: 127.9 ±63.7 ml vs. 3D triplane: 127.1 ±63.1 ml, p = 0.946) and end-systolic (2D biplane: 64.7 ±55.9 ml vs. 3D triplane: 67.4 ±58.1 ml, p = 0.799) volumes. However, significant differences were found in stroke volumes calculated in TTE (2D biplane: 63.2 ±19.6 ml vs. 3D triplane: 42.9 ±29.8 ml, p = 0.0001). There was no significant difference in the value of ejection fraction in visual estimation and 2D biplane (53.8 ±14.4% vs. 54.5 ±15.1%, p = 0.403) as well as visual estimation and 3D triplane (53.8 ±14.4% vs. 51.5 ±15.2%, p = 0.067). Nevertheless, the ejection fraction assessed by the 3D triplane method was statistically significantly lower than in the 2D biplane (51.5 ±15.2% vs. 54.5 ±15.1%, p = 0.007).
Direct comparison of corresponding LV parameters measured in TTE and cardiac computed tomography revealed a significant difference between the two imaging modalities (Table III). The first difference may be observed in LV major axis length (end-diastolic). This is significantly longer in computed tomography than in TTE (81.5 ±11.7 mm vs. 74.6 ±13.5 mm, p = 0.004). The LV width at papillary muscle head level in computed tomography was greater than the distance measured between LV papillary muscle heads in TTE (45.7 ±12.0 mm vs. 24.1 ±8.2 mm, p < 0.0001). Although no difference was found in end-systolic LV volume between the two imaging methods, the end-diastolic volume of the LV was significantly larger when measured in computed tomography than in both 2D biplane and 3D triplane TTE (Table III). Stroke volume was not different between 2D biplane TTE and computed tomography, but significantly lower values of stroke volume were reported in 3D triplane (Table III). No significant difference was found between computed tomography and echocardiography in the calculation of ejection fraction and LV mass/LV mass indexed to body surface area (p > 0.05, Table III).
Table III
Comparison of corresponding left ventricular (LV) parameters measured in transthoracic echocardiography and cardiac computed tomography (mean ± SD)
Discussion
This study suggested that cardiac computed tomography could be a useful tool in the assessment of LV geometry and function. Echocardiography is the cheapest and the most routinely used method to assess LV geometry and function, but it can be limited by poor acoustic windows in some patients [7] and by experience of the operator [8, 9]. In these cases, it is worth using other available imaging methods. There has been rapid development of cardiovascular imaging and spread of cardiac computed tomography, which is now available even in relatively small medical centers [10]. Cardiac computed tomography is a fast and highly reproducible imaging modality. Beside radiation exposure and the necessity of contrast agent usage, computed tomography is a safe examination. In some cases cardiac computed tomography can be considered superior to echocardiography for detailed morphological observations as it produces the exemplary representation of cardiac structure [9, 11–15]. Moreover, the implementation of some modifications to the acquisition protocol and post-processing workup (especially the utilization of three-dimensional tools) may benefit in more accurate assessment of left ventricle geometry and its global function. It can be comparable to cardiac magnetic resonance imaging [16]. Therefore, computed tomography may serve as an alternative option for functional assessment, particularly when other imaging modalities such as echocardiography give inadequate images or in patients with contraindications to magnetic resonance imaging [7].
Cardiac computed tomography has proven to have considerable importance for patients undergoing the TAVI procedure, because it allows detailed evaluation of the aortic root that is crucial for selecting patients with suitable anatomy and to guide prosthesis sizing [17]. Moreover, computed tomography-guided valve sizing in TAVI significantly reduces the incidence of post-procedural aortic regurgitation compared to TEE sizing [18]. Multiplanar reconstruction is an additional diagnostic tool to computed tomography that allows one to create a three-dimensional model and perform precisely advanced three-dimensional measurements. Surprisingly, despite the availability of LV computed tomography images, produced for the assessment of the aortic valve, they often are not assessed. Meanwhile, they often provide a much more detailed overview of the morphology and function of other cardiac structures and heart cavities than that shown in routinely performed echocardiography [12]. Contrast-induced nephropathy after computed tomography is a significant complication of this examination especially in patients with impaired renal function. We took preventive measures in all patients, such as adequate fluid intake, discontinuation of nephrotoxic medications, and minimizing the amount of contrast agent while maintaining satisfactory image quality. We did not observe any contrast-induced nephropathy in our patients.
The aim of basic LV measurements is to describe the size and shape of this cavity. Major (long) and minor (short) axes are fundamental linear measurements that provide information on LV chamber morphology. Although no significant difference in the corresponding minor axes is found between TTE and cardiac computed tomography, the latter imaging technique should be preferable as it provides multiplanar insight into the LV cavity [19, 20]. It is also perfectly visible when analyzing the position of papillary muscle heads, which can be assessed far more accurately and correctly in computed tomography than in TTE (selection of the correct measurement plane). On the other hand, a considerable difference is observed in LV major axis length, which is significantly longer in computed tomography than in TTE. This difference between seemingly correlating dimensions in echocardiography and cardiac computed tomography is a result of impaired visualization of the LV in TTE where due to the non-perfectly conical shape of the ventricle the long axis is usually not fully visible during 2D ultrasound examination [21, 22].
The parameter most frequently used to assess LV function is ejection fraction, which has been shown to correlate with morbidity and mortality and thus is used as a guide for management of the individual patient [23]. 2D biplane TTE ejection fraction assessment is recommended as a reference method [4]. In our study some considerable differences in assessment of LV function could be found between 3D and 2D TTE. A meta-analysis on the accuracy of 3D echocardiography showed that 3D TTE underestimates end-diastolic and end-systolic LV volumes, but not the ejection fraction. In high imaging quality studies 3D TTE offered better accuracy and precision in measuring LV volumes and better precision in measuring LV ejection fraction compared with 2D TTE [24]. Additionally, 3D TTE has been considered as a better technique than 2D TTE to predict cardiovascular mortality and outcomes for ejection fraction [23, 25]. Furthermore, measurements performed on computed tomography reconstructions showed significantly larger LV volumes and stroke volumes, which however were closer to 2D than 3D TTE estimations (Table III). Surprisingly, no significant differences in the ejection fraction were found between computed tomography and echocardiography. The LV model gained as the result of three-dimensional segmentation represented the most accurate image of this structure. The direct measurement of volume of the created LV model allowed for the most accurate calculation of stroke volume and ejection fraction, avoiding misleading estimations that were used in TTE assessments [24].
Some significant limitations of this study should be mentioned. Firstly, it is a retrospective study. Second, it is a single center study with a relatively small study group. Moreover, possible measurement biases result from the limitations of used imaging techniques and calculation methods/formulas for LV function estimations in TTE. Finally, the three-dimensional segmentation tool (Mimics Innovation Suite 22, Materialise) is not a standard clinical instrument used in everyday practice. It is expensive software with high hardware requirements that demands some experience in operation, but is highly necessary and useful. However, we believe that these limitations do not hamper our results and the drawn conclusions.
Conclusions
Contrast-enhanced cardiac computed tomography should be considered as an alternative method in assessing the LV morphology and geometry. The use of three-dimensional postprocessing provides a very accurate image of heart structures, which in some aspects may significantly differ from the values estimated by TTE. Due to the use of direct measurement methods and calculations (without estimation) in three-dimensional computed tomography reconstructions, this method should be regarded as an accurate imaging tool.


