
Summary
Detailed assessment of global unipolar voltage, bipolar voltage and local linear shortening parameters of the left ventricle were 11.56 mV, 3.63 mV and 11.32%, respectively. Comparing active and placebo groups, there were no significant differences in electromechanical (EM) characteristics at global and segmental levels. Analysis of factors associated with improvement of ischemic segments in single-photon emission computed tomography (SPECT) showed no correlation between EM parameters and changes of perfusion at rest and stress. Baseline SPECT results are only predictors of changes of myocardial ischemia observed at 4-month follow-up. With median value-based grouping, the correlation between EM parameters and myocardial ischemia changes in the active group showed no statistical significance.
Introduction
The long-term prognosis of patients with both acute coronary syndrome and chronic coronary syndromes has improved due to multi-modal approaches, including interventional and surgical revascularization along with optimal medical treatment [1, 2]. However, some patients complain of refractory angina (RFA), alternatively defined as no-option angina, which refers to the presence of chest pain symptoms/angina equivalents (lasting for ≥ 3 months) associated with reversible ischemia due to untreatable obstructive coronary artery disease not amenable to conventional treatment (neither pharmacological nor interventional) [1]. Pre-clinical and phase I/II studies showed that trans-endocardial application of cell therapy might serve as a promising treatment strategy for these patients [3, 4]. The REGENT-VSEL trial evaluated the effects of trans-endocardial injection of autologous bone marrow-derived CD133+ cells in the left ventricle (LV) of such patients [3]. Despite a lack of significant difference in inducible ischemia between the treatment and placebo group after 4 months, the logistic regression model suggested that allocation to the stem cell arm was associated with 3.5× higher odds of SPECT-evaluated reduction of ischemic area [3]. Thus, to further evaluate potential stem cell-induced changes of myocardial ischemia, we performed an in-depth analysis of electromechanical parameters and their correlation with SPECT results. Importantly, data from the 3-dimensional NOGA XP mapping system [5] allows for detailed electromechanical analysis and delineation of hibernated – i.e., viable but hypokinetic – myocardium.
Aim
Taking into consideration novel insights and advances in the field, we aim to perform a retrospective analysis of the REGENT-VSEL trial (1) analyzing EM parameters (unipolar voltage (UV), bipolar voltage (BV), and local linear shortening (LLS)) of LV in patients with RFA, and (2) assessing the correlation between EM characteristics and changes in myocardial ischemia.
Material and methods
Study population
Thirty of 31 patients from the REGENT-VSEL [3] trial were enrolled in the retrospective analysis. The placebo and active group consisted of 14 and 16 patients, respectively. One patient from the placebo group was excluded because of a missing electromechanical map.
Inclusion criteria
1) Stable angina in CCS class II–IV despite maximum pharmacotherapy for at least 2 weeks since last change of medications; 2) presence of ≥ 1 myocardial segment with reversible ischemia in qualifying Tc-99m SPECT; 3) disqualified from further revascularization by independent Heart Team; 4) age > 18 and < 75 years; and 5) written informed consent.
Exclusion criteria
1) acute coronary syndrome ≤ 6 months; 2) heart failure NYHA class III–IV; 3) LVEF < 35%; 4) contraindications to NOGA procedure (ventricular wall thickness < 8 mm, intracardiac thrombus, severe aortic stenosis, LV an aneurysm or severe peripheral artery disease precluding the vascular access); 5) previous implantation of cardioverter-defibrillator or pacemaker; 6) history of malignancy; 7) active infection; 8) life expectancy less than 6 months; 9) bleeding diathesis; 10) renal insufficiency (GFR < 30 ml/min/1.73 m2) and 11) pregnancy, lactation, or lack of effective contraception in women of childbearing potential.
Single-photon emission tomography
All patients underwent a myocardial perfusion gated SPECT study, using the 1-day protocol with the adenosine stress test. The adenosine stress test was performed first, during which patients received adenosine infusion intravenously at the rate of 140 μg/kg/min for 6 min. At the third minute of infusion approx. 370 MBq of 99mTc-MIBI was administered intravenously with continuous electrocardiographic and blood pressure monitoring. A similar dose of 99mTc-MIBI was administered intravenously 6 h later for the resting myocardial perfusion. The 99mTc-MIBI gated SPECT study was done approx. 45 min after the administration of 99mTc-MIBI for both the adenosine stress and rest studies. Acquisition used a low-energy, high-resolution (LEHR) collimator, 180-degree acquisition over 64 projections, 25 s per projection with patients in the supine position and a 15% window centered on the 140 KeV peak in a Siemens dual-headed gamma camera (Symbia, Siemens Healthcare). Preprocessing was done with a Butterworth filter of order 5 with a cutoff frequency of 0.33 Hz. Short axis, vertical and horizontal long axes tomograms of the LV were automatically extracted from the reconstructed trans-axial tomograms by performing reorientation to the long axis of the LV. Perfusion defect score was evaluated by the severity of perfusion of each segment scale from 0 (normal uptake) to 4 (uptake absent) using the visual analysis of results obtained using QPS software (Cedars-Sinai, Los Angeles, California). The summed stress scores (SSS) equaled the sum of the stress scores of all the segments, and the summed rest score (SRS) equaled the sum of the resting scores of all the segments. The difference between the SSS and SRS is the summed difference score (SDS), and it was a measure of inducible ischemia [6]. In order to match the NOGA-XP system, semi-quantitative analysis was performed using a matching 9-segment scoring model calculating the percentage of myocardial ischemia ranging from 0% to 100%.
Electromechanical mapping and stem cell injection
Patients underwent electromechanical mapping and the intramyocardial cell/placebo application procedure with the NOGA-XP 3D system (Biosense Webster, Johnson & Johnson, Diamond Bar, CA, USA). During the procedure, approximately 200–250 mapping points were collected in order to obtain a precise electromechanical map of the left ventricle. Target regions of the myocardium with impaired mechanical (LLS (reflecting regional wall motion) < 6%) but maintained electrical activity of ≥ 6.0 mV UV were defined as a viable hibernated myocardium. Thereafter, a median of 10 intramyocardial CD133+ cells (dosing ranges 2.8 × 10⁶–5.3 × 10⁶)/placebo injections were performed using a MyoStar catheter (Biosense Webster, Johnson & Johnson, Diamond Bar, CA, USA).
Post-processing of electromechanical data
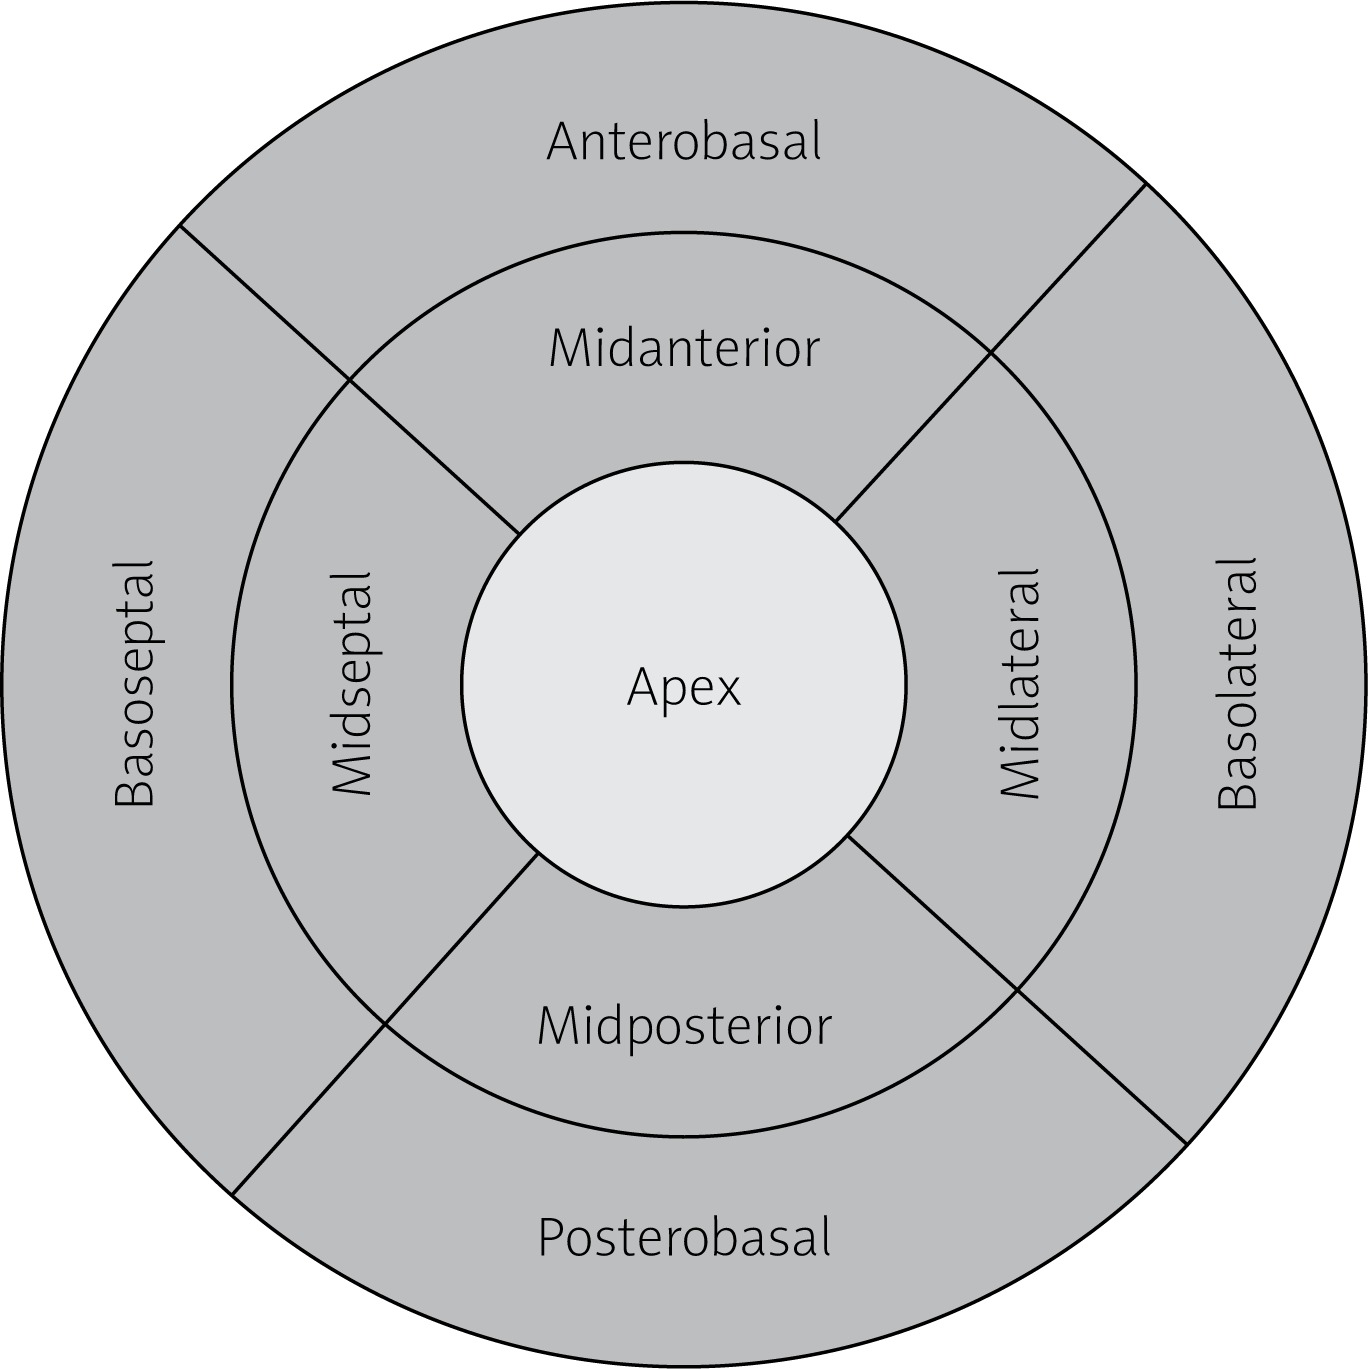
A nine-segment model of the LV (bulls-eye projection, Figure 1) was used to position NOGA-XP mapping points. Each of the LV segments (basoseptal, basolateral, posterobasal, anterobasal, midseptal, midlateral, midposterior, midanterior and apical) was represented by an averaged value of UV, BV, LLS parameters. Subsequently, corresponding global EM parameters were calculated as a mean or median value of all 9 segments for UV, BV and LLS.
Statistical analysis
Data are shown as mean ± standard deviation (SD) or median (25th;75th percentile) for quantitative data or number and percentage for qualitative data. The prevalence of features in the subgroups was compared with the χ2 test. The differences between groups were analyzed by the Mann-Whitney U-test or Student’s t-test used as appropriate according to normality of variables tested by the Shapiro-Wilk test. The relative difference (RD) of rest and stress myocardial ischemia at baseline (pre-injection) and 4-month follow-up (post-injection) was calculated based on SPECT examination according to the following formula: RD = (ischemia at baseline (%) – ischemia at follow-up (%))/ischemia at baseline (%).
Positive and negative RD values refer to increase and decrease of myocardial ischemia (%), respectively.
Since the EM variables representing global and segmental characteristics were not normally distributed, patients were grouped based on the median value of each parameter. Multiple linear regression was firstly employed to test the correlation between post-injection SPECTs as dependent variables and pre-injection SPECT+ EM parameters as independent ones. Subsequently, simple linear regression was used to assess individual associations between stress and rest SPECT variability and different levels of UV, BV, and LLS variables, including consideration of intervention (CD133+ cells). Missing data were excluded from all analyses, and the level of significance was set at p < 0.05. Analyses were performed with TIBCO Software Inc. (2017) Palo Alto, USA. Statistica (data analysis software), SAS 9.4 (SAS Institute Inc., Cary, NC, USA) and Prism 9 (GraphPad, San Diego, CA, USA).
Results
Electromechanical and perfusion characteristics
Global electromechanical and SPECT-evaluated perfusion characteristics of LV are presented in Table I. We found no significant differences in global UV, BV, and LLS as well as rest and stress SPECT values between active and placebo groups.
Table I
Left ventricle electromechanical and perfusion characteristics
Segmental electromechanical data are presented in Table II. There are no significant differences between cell and control groups regarding EM parameters at the segmental level.
Table II
Segmental electromechanical characteristics
Correlative results between treatment groups
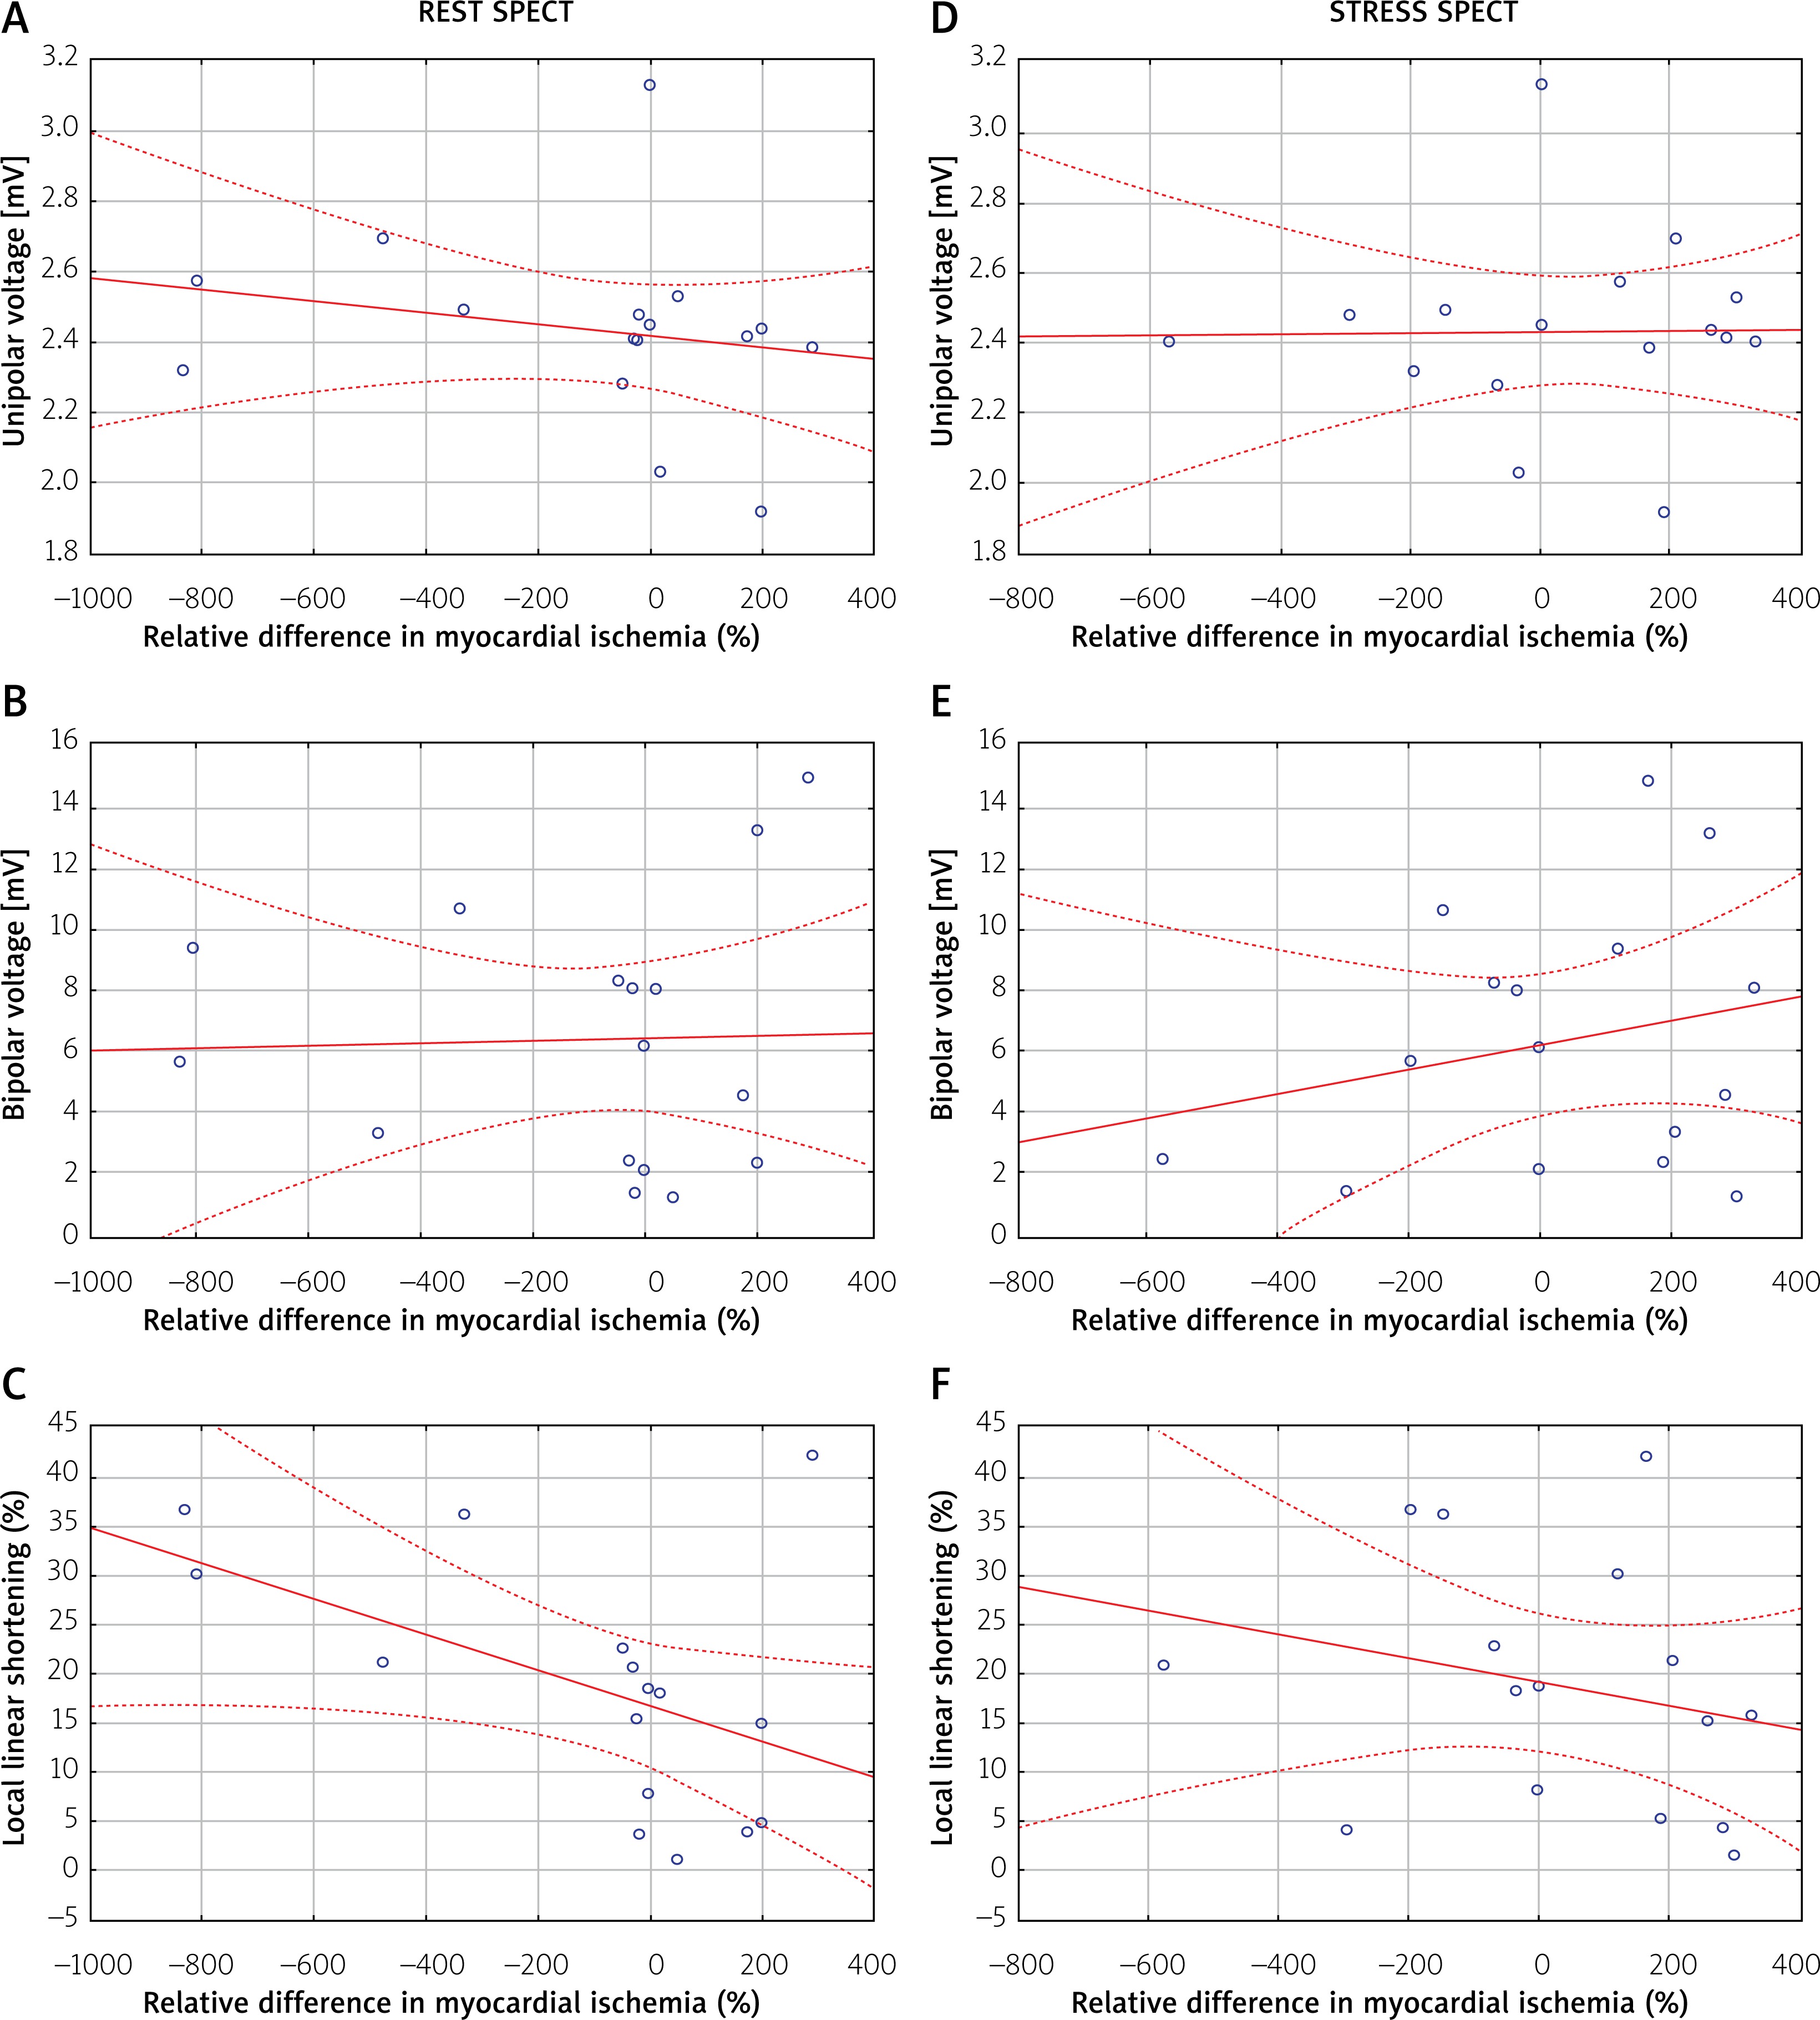
Global changes of myocardial ischemia expressed as RD and EM parameters showed none or weak correlation for UV, BV and LLS at rest (R = –0.06; R = 0.2; R = –0.1, respectively), see Figures 2 A–C. Results of correlation analysis using RD at stress did not im-prove R values (R = 0.07; R = 0.09; R = –0.1, respectively), Figures 2 D–F. Similar analysis performed in patients who received CD133+ cell therapy showed none or a weak cor-relation in SPECT at rest for UV (R = –0.2), BV (R = 0.03) and LLS (R = –0.4), see Figures 3 A–C. No or weak cor-relation was found in SPECT at stress (R = 0.02; R = 0.2; R = –0.2, respectively), see Figures 3 D–F.
Figure 2
Correlation between median value of the left ventricle EM parameters (unipolar voltage, bipolar voltage, local linear shortening) and global changes of SPECT-evaluated myocardial ischemia at rest (A–C) and stress (D–F)
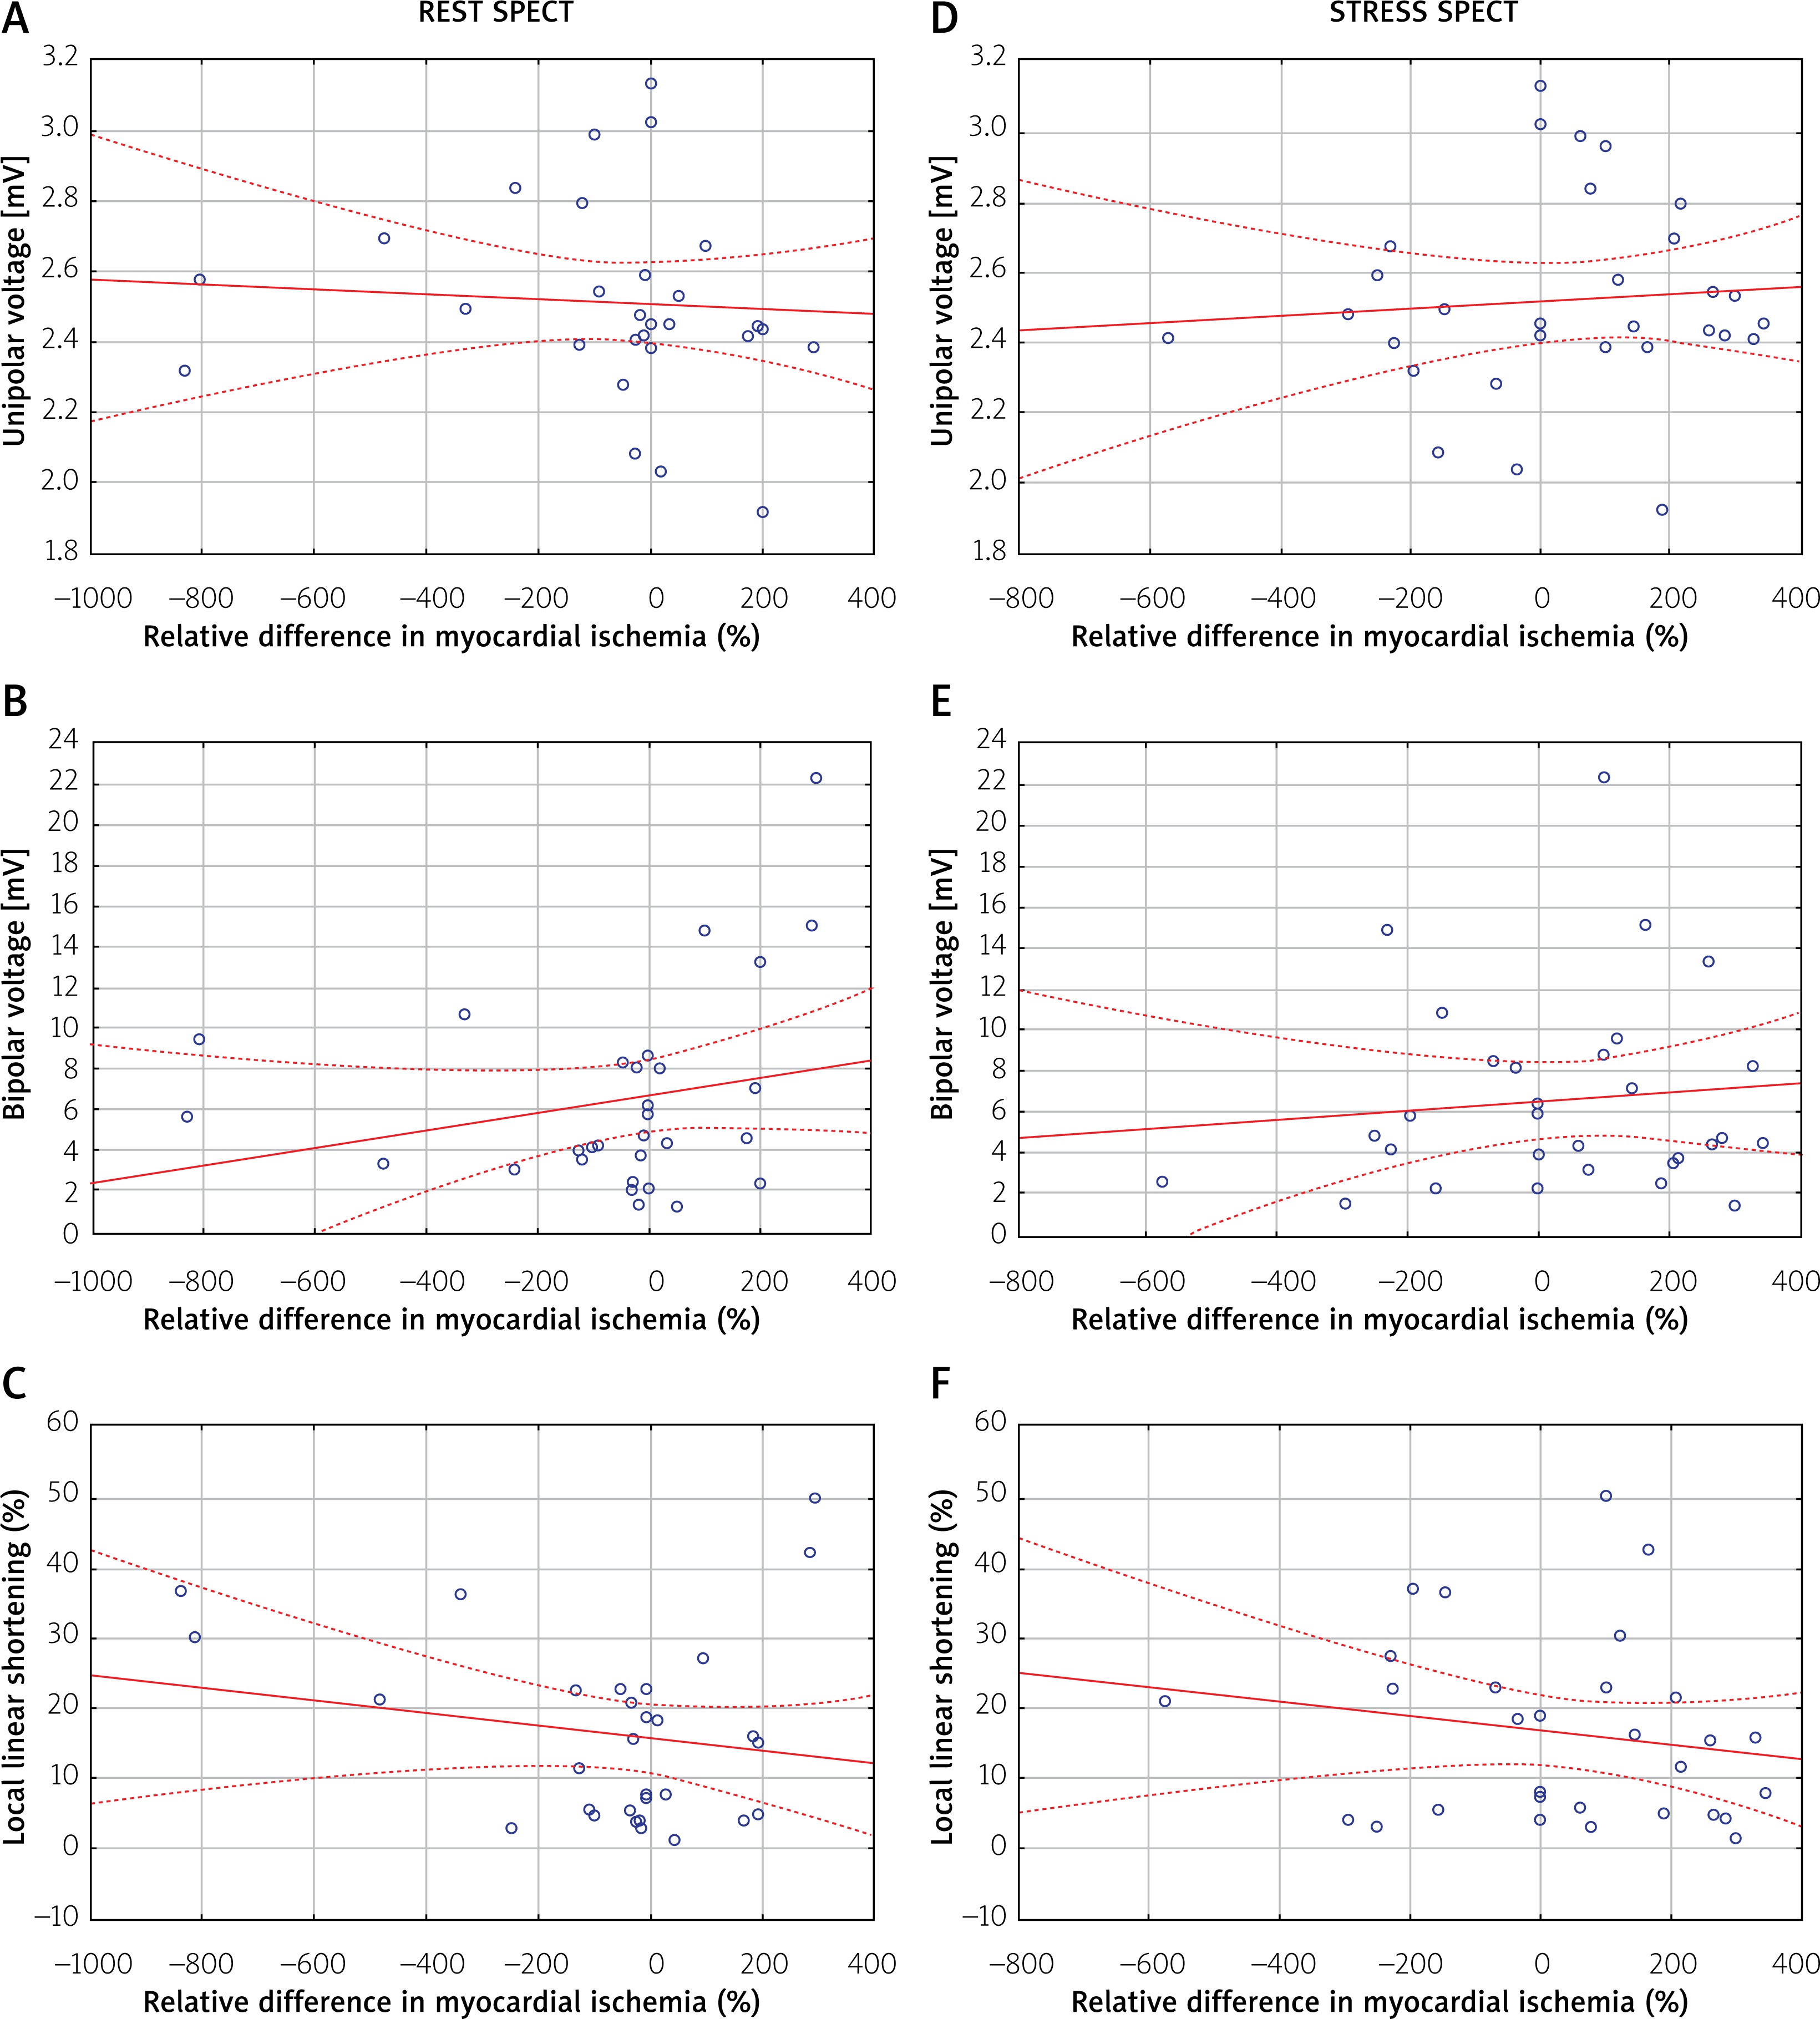
Figure 3
Correlation between median of the left ventricle EM parameters (unipolar voltage, bipolar voltage, local linear shortening) values of hibernated segments injected with CD133+ cells and changes of SPECT-evaluated myocardial ischemia of targeted segments at rest (A–C) and stress (D–F)
Multiple linear regression of the treated segments showed that only pre-injection SPECT levels – both at rest and stress – were significantly or close to significance correlated with post-injection SPECT, either at rest (p = 0.001 vs. pre-injection SPECT levels at rest and p = 0.0003 vs. pre-injection SPECT levels at stress) and stress (p = 0.076 vs. pre-injection SPECT levels at rest and p = 0.041 vs. pre-injection SPECT levels at stress). The pre-injection and post-injection levels showed a positive correlation.
Segmental intragroup correlation between electromechanical parameters and myocardial ischemia based on median value-based grouping
Active group
Unipolar voltage
With a division criterion of global LV unipolar median value, patients were assigned to Group 1 (< 11.56 mV) or Group 2 (≥ 11.56 mV). Unipolar voltage did not correlate with response to cell therapy reflected by changes of myocardial ischemia analyzed by rest and stress SPECT test (Table III).
Table III
Correlation between unipolar voltage and changes of myocardial ischemia
Bipolar voltage
With a division criterion of global LV bipolar median value, patients were assigned to Group 1 (< 3.63 mV) or Group 2 (≥ 3.63 mV). Bipolar voltage did not correlate with response to cell therapy reflected by changes of myocardial ischemia analyzed by rest and stress SPECT test (Table IV).
Table IV
Correlation between bipolar voltage and changes of myocardial ischemia
Local linear shortening
With a division criterion of global LV LLS median value, patients were assigned to Group 1 (< 11.5) or Group 2 (≥ 11.5). LLS did not correlate with response to cell therapy reflected by changes of myocardial ischemia analyzed by rest and stress SPECT test (Table V).
Table V
Correlation between local linear shortening and changes of myocardial ischemia
Global intergroup and intragroup correlation between electromechanical parameters and myocardial ischemia based on median value-based grouping
No statistically significant differences in myocardial ischemia changes were observed within the active and placebo group (intragroup analysis) or between groups (intergroup analysis) using the median value of each EM parameter for grouping (Table VI).
Table VI
Intergroup comparison of electromechanical parameters
Discussion
In order to evaluate new factors that might be associated with changes of myocardial ischemia upon CD133+ cell injection, we integrated SPECT data with electromechanical maps acquired from NOGA XP, obtaining a unique insight into mutual relations between EM parameters and ischemic substrates. Regardless of overall electromechanical characteristics of LV as well as cell-targeted segments, time-dependent changes of myocardial ischemia do not appear to be related to the CD133+ treatment or presented EM characteristics. The primary findings of this retrospective study demonstrate that patients with RFA have comparable EM properties of LV myocardium and that intramyocardial CD133+ cell therapy was not associated with the reduction of ischemia measured in SPECT, which is in line with the primary results of the REGENT-VSEL trial.
Results of the stem cell therapy applying transendocardial delivery should be interpreted in regard to the EM parameters of the scar, target zone, and viable myocardium. EM characteristics of left ventricle myocardium described in our retrospective analysis are in line with data from the PROGENITOR study applying CD133+ cells in the RFA population, where the authors reported global UV values in the active and control group as 10.4 (7.4 to 14.2) and 12.5 (8.1 to 15.0) mV, respectively. Furthermore, overall LLS values were 10.6 (5.2 to 13.6) and 10.7 (3.8 to 17.4), respectively. To personalize treatment strategy and select targeted regions, it is necessary to delineate hibernated myocardium, defined as viable tissue devoid of or with significantly reduced contractile function, as well as fibrotic scar tissue regions characterized by low UV and LLS reflecting no electrical or mechanical activity. Importantly, the definition of myocardial properties for the most suitable injection site is still under scientific debate, mirroring inconsistent results of stem cell trials [4, 7, 8]. Moreover, recent trials change perspective in terms of different cut-off values for unipolar and bipolar voltage of hibernated myocardium, which can significantly affect the cell therapy response [9, 10]. In our study, CD133+ cells were injected in the areas with UV ≥ 6.0 mV (with the exception of 2 out of 315 cell injections, when cells were injected in the areas of UV < 6.0 mV) and LLS < 6%. In comparison to the REGENT-VSEL trial, the PROGENITOR study used 6.9 mV UV and LLS < 12% cut-offs for hibernated myocardium showing improvement of the SPECT-derived summed score at rest and stress in the active group (median absolute difference –1.0 (95% CI: –1.9 to –0.1)). Interestingly, in the active group within 6-month follow-up, LLS value improved statistically from 10.6 to 12.3 (p = 0.01), while in the placebo group LLS was reduced from 10.7 to 8.9 (p = 0.30). These data suggest that baseline EM parameters of the cell target zone may play a role. Moreover, it is proposed not only to change the cut-off values of viable myocardium to UV 6.7 mV and BV 3.0 mV, but also to take into consideration the presence of LV remodeling with further voltage changes [9].
In contrast to our results, electro-anatomical properties of myocardium were found to predict response to stem cell therapy. In the study by Zemljic et al. [11], patients with ischemic and non-ischemic heart failure received CD34+ stem cell injections into hibernated myocardial segments. The authors defined hibernated myocardium as areas with unipolar voltage ≥ 8.3 mV and myocardial scar as segments with unipolar voltage of < 8.3 mV. In conclusion, higher myocardial scar burden was associated with worse clinical response to CD34+ cell therapy. It is worth remarking that CD133+ cells are a subfraction of CD34+ coexpressing this surface marker [12]. Presented data suggest that the clinical effect of cell therapy depends on the cell type, underlying medical condition and EM characteristics of target zones.
Heterogeneity of EM parameters values for target zone, scar and viable myocardium hinder comparison of our study results with data from other trials. However, we performed an additional analysis classifying patients into groups based on the median value of each EM parameter to simulate different cut-offs. Due to the relatively small number of patients included in the analysis, further studies with larger numbers of participants are needed.
Conclusions
Detailed assessment of global UV, BV and LLS parameters of the left ventricle were 11.56 mV, 3.63 mV and 11.32%, respectively. Comparing active and placebo groups, there were no significant differences in EM characteristics at global and segmental levels. Analysis of factors associated with improvement of ischemic segments in SPECT showed no correlation between EM parameters and changes of perfusion at rest and stress. Baseline SPECT results are only predictors of changes of myocardial ischemia observed at 4-month follow-up. With median value-based grouping, the correlation between EM parameters and myocardial ischemia changes in the active group showed no statistical significance.


