
Introduction
Hepatitis B seroprevalence is between 1.4% and 2.7% of the Indian population, with the lifetime risk of acquisition of infection being approximately 4% [1, 2]. Most asymptomatic subjects who do not undergo blood investigations remain undetected and constitute a reservoir of infection. The American Association of Study of Liver Diseases (AASLD) guidelines recommend screening for all individuals living in countries with seroprevalence > 2%, pregnant women, patients planned for immunosuppressive therapy, and other high-risk groups such as injection drug users, chronic kidney disease patients on hemodialysis, men who have sex with men, persons with HIV and health care workers [3]. Management of incidentally detected and asymptomatic patients has been a subject of debate. In asymptomatic subjects with normal liver function tests, fibrosis is a major determinant for therapy. Despite normal liver function tests, therapy is warranted in those with HBV DNA levels > 2000 IU/ml if significant fibrosis is present [3, 4]. Antiviral treatment for hepatitis B can not only prevent progression but also leads to fibrosis regression, including cirrhosis [5].
Although liver biopsy remains the gold standard for assessing fibrosis, noninvasive assessment with vibration-controlled transient elastography (VCTE) or FibroScan (EchoSens, France) is safe, convenient, and accurate. Median liver stiffness values of ≥ 8 kPa and ≥ 11 kPa are associated with good prediction for significant fibrosis and cirrhosis with mean area under the receiver operator curve (AUROC) values of 0.85 and 0.92, respectively [6, 7]. Issues with FibroScan include the equipment and testing cost, which limits access in low-resource settings.
A previous study from China using FibroScan showed that alanine transaminase (ALT) levels, HBV DNA titers, and gender were significant predictors of fibrosis in patients with hepatitis B and persistently normal ALT levels (PNALT) and also in persistent or intermittently elevated ALT levels (PIEALT) [8]. Another study from northern India showed an inverse correlation between quantitative hepatitis B surface antigen (HBsAg) levels and fibrosis [9]. We aimed to assess the prevalence and predictors of significant fibrosis in incidentally detected asymptomatic hepatitis B positive subjects (IDAHS) to develop a model for the prediction of fibrosis for use in low-resource primary care settings.
Material and methods
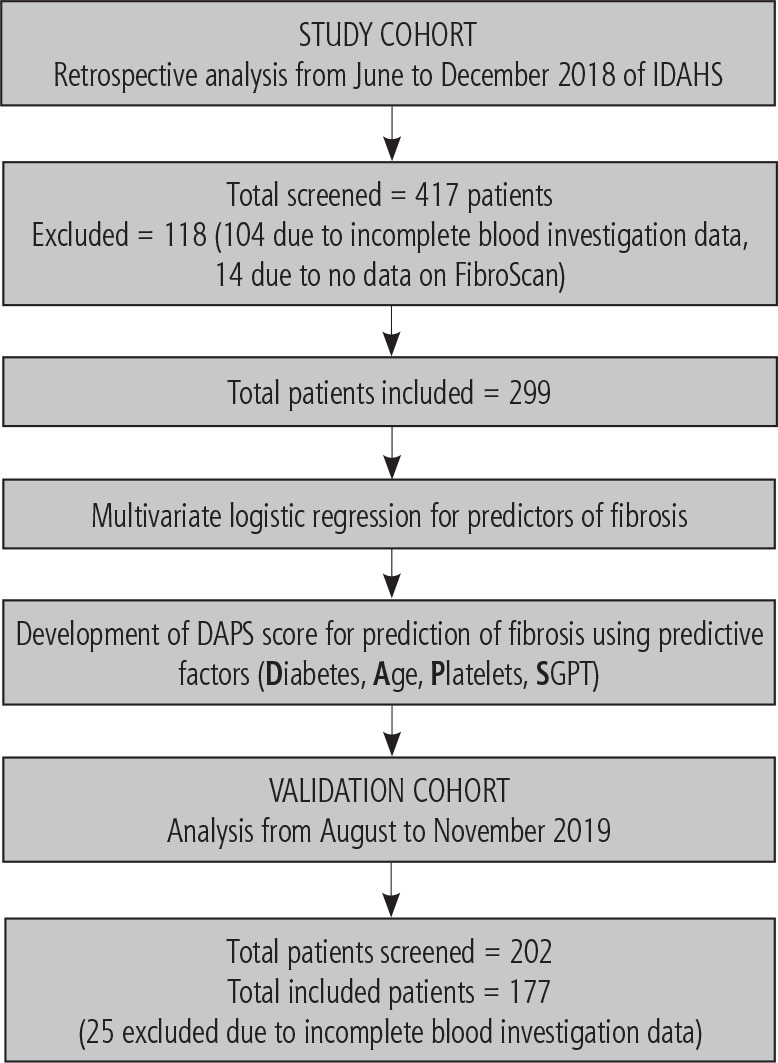
A retrospective review of IDAHS referred to the liver clinic at a tertiary care public hospital in western India between June to December 2018 as part of the study cohort was done. As part of the validation cohort, patients registered between August and November 2019 were included. The study design is presented in Figure 1. The exclusion criteria for both the study and validation cohorts were: 1) presence of decompensated liver disease in the form of variceal bleed, ascites, or hepatic encephalopathy, 2) presence of hepatocellular carcinoma, and 3) patients with incomplete data, including liver function tests, complete hemogram, background clinical history and data of noninvasive assessment of fibrosis using FibroScan. Weight and body mass index (BMI) were noted as per the clinical records. Those with BMI > 25 kg/m2 were considered obese [10]. Baseline HBV DNA levels and hepatitis B e antigen (HBeAg) status were noted.
Liver stiffness measurements (LSM) were done using FibroScan 430 Mini (EchoSens, France) with both M and XL probes. Measurements were performed following an overnight period of fasting for the patient. The tip of the transducer was covered with a drop of gel and placed perpendicularly in the intercostal space of the patient, who was required to lie in the dorsal decubitus position with the right arm on maximal abduction. Scanning was conducted in a region encompassing the 6th, 7th, and 8th intercostal spaces between anterior axillary and mid-axillary lines [11].
The number of successful detections per case was required to be ≥ 10 with a success rate of ≥ 80% and an interquartile range/median LSM ≤ 30%. Median liver stiffness values of ≥ 8 kPa were considered significant fibrosis, and ≥ 11 kPa was considered cirrhosis as per Asia-Pacific Association of Study of Liver (APASL) guidelines [12].
Statistical analysis
Continuous variables were expressed as mean and standard deviation with data comparison done using the Mann-Whitney U test and Student’s t-test. Categorical variables were compared using the χ2 test or Fisher exact test. The study cohort’s variables with statistical significance (p < 0.05) were subjected to multivariate analysis by logistic regression. The model for the prediction of fibrosis was made using the regression analysis results. As the aim was the development of a model which is easy to use in clinical practice without the need for a calculator, a log weighted score was not developed. The model was then applied to the validation cohort to predict fibrosis. The sensitivity and specificity of the model in the study and validation cohorts were calculated. All statistics were done using SPSS version 23 (IBM, Armonk, NY, USA).
Results
Four hundred and seventeen patients presented to the liver clinic during the period of the study cohort. After reviewing the case details for exclusion criteria, 299 patients (mean age 42.6 years, male 63.2%) were included in the analysis for the study cohort. The demographic details with statistical summary are presented in Table 1. Of the included patients, 20% were obese as per BMI criteria, and 76% (226/299) were HBeAg non-reactive. Mean HBV DNA levels were 3.35 log, with 74.6% having DNA levels < 5 log IU/ml. There was no correlation between serum SGPT levels and HBeAg status (p = NS) or between serum SGPT and HBV DNA levels (Pearson correlation = 0.16).
Table 1
Demographic parameters of study cohort with multivariate analysis
Significant fibrosis was found in 27.4% (82/299) of the study cohort. Of these, 36 patients (12%) had cirrhosis as per VCTE. Of those with normal transaminase, 16.8% (30/178) had significant fibrosis. Patients with significant fibrosis were older, with higher levels of SGPT, lower platelets and higher incidence of diabetes per the univariate analysis. HBV DNA levels, presence of HBeAg, and obesity did not correlate with the presence of significant fibrosis on univariate analysis. On multivariate analysis, age, lower platelets, and presence of diabetes were associated with fibrosis. As SGPT was nearing towards in multivariate analysis, the value was used to create the model and also considered as significantly associated with fibrosis. Hence a predictive model was developed using these parameters to assess fibrosis (Table 2). The DAPS prediction model assigned equal weightage to each variable, making it easy to use in practice. Based on the cumulative score, a patient was categorized as having low risk (DAPS score 0-2) or high risk (DAPS score 3-4). Those with high risk had an odds ratio of 43.7 (95% CI: 14.8-128.9) over those with low risk for significant fibrosis. The model’s sensitivity was 45%, and specificity of 98.2%, with an accuracy of 83.6%. The positive predictive value per the study cohort is 89.3%, and the negative predictive value is 82.8%.
Table 2
DAPS score
| Parameter | Points = 0 | Points = 1 |
|---|---|---|
| Diabetes | No | Yes |
| Age (years) | < 45 | > 45 |
| Platelets (× 103/mm3) | > 240 | < 240 |
| Serum glutamic pyruvic transaminase (IU/l) | < 45 | > 45 |
| Low risk = 0-2, high risk = 3-4 |
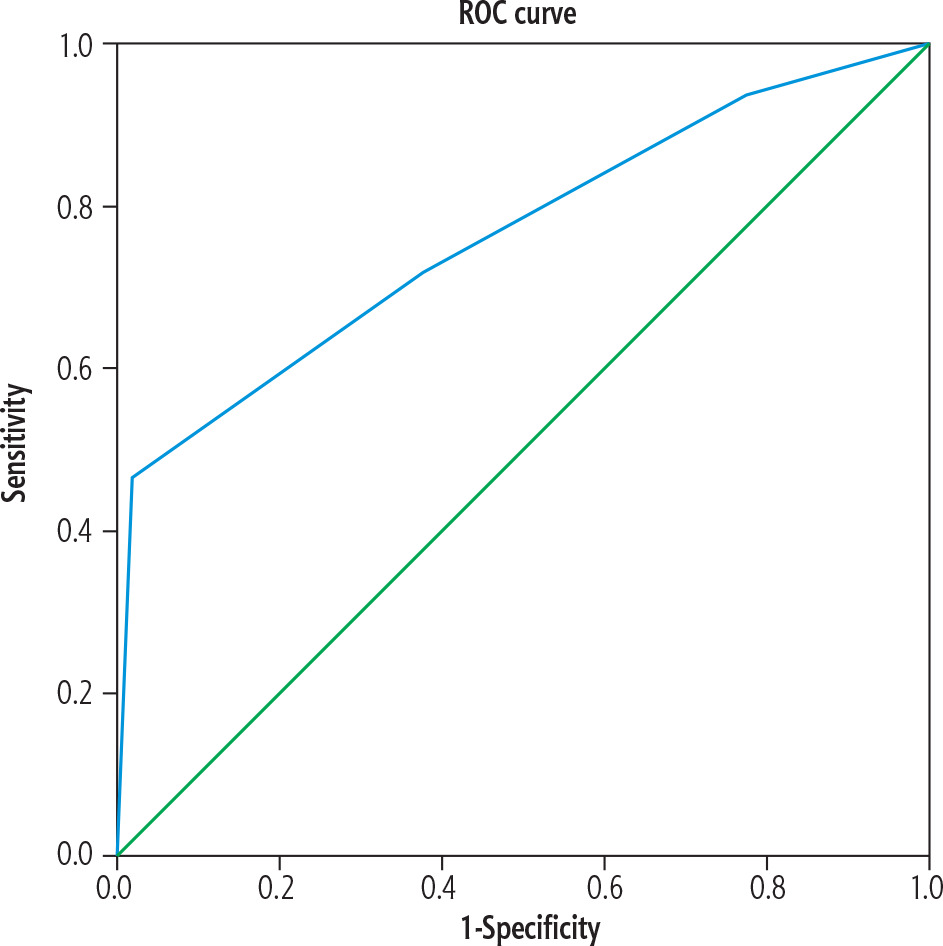
A total of 177 patients were included in the analysis for the validation cohort (mean age 45.3 years, male 65.5%). Among patients in the validation cohort, 30.5% (54/177) had significant fibrosis on FibroScan. On validation of the DAPS score, the patients with high-risk DAPS score had an odds ratio of 27.4 (95% CI: 7.74-97.77) for predicting significant fibrosis over low-risk DAPS score with a specificity of 97.6% and accuracy of 80%, although sensitivity was 41%. Figure 2 shows the ROC curve for validation of DAPS score with AUROC of 0.763 (95% CI: 0.697-0.830).
Discussion
IDAHS form a major cohort of patients with hepatitis B presenting to hepatology outpatient clinics. In countries with higher seroprevalence, a large number of patients in low-resource settings may remain untreated for want of further evaluation. The major drivers for therapy are the HBV DNA levels and SGPT levels, which mark the presence of necroinflammation. However, even in settings with normal SGPT levels, 29% of patients had necroinflammation in a previous large study from China. Even in those with SGPT 1-1.5 times the upper limit of normal (ULN) and those with 1.5-2 ULN, the rates of necroinflammation were similar. This showed that a linear correlation was challenging to establish [13]. Although various scores are available for the prediction of fibrosis, models which are easy to use at the bedside and in low-resource settings remain an unmet need.
The DAPS score is a model with excellent specificity for predicting fibrosis in IDAHS, as seen with both the study cohort and validation cohort with good positive and negative predictions. The model can be used in low-resource settings to identify patients more likely to have significant fibrosis and can be considered for treatment or further confirmation by transient elastography or liver biopsy as indicated. Wang et al. described a model using SGPT levels, HBV DNA levels, and sex of the patient for the prediction of fibrosis in incidentally detected hepatitis B [8]. The formula is as follows: −2.632 + (0.93 × ALT) + (0.258 × DNA) – (0.995 × sex) (male = 1, female = 2). The AUROC was 0.72 with 61% sensitivity and 70% specificity with a score of > −2.22. The utility of the score described at the bedside and in low-resource settings was unclear. Another study assessed fibrosis prediction in HIV-HBV coinfected individuals using the aspartate aminotransferase to platelet ratio index (APRI), FIB-4, and VCTE. VCTE was the best modality for fibrosis prediction, with an AUROC of 0.87 [14]. We used VCTE in our study as the standard for prediction, considering the overall accuracy, ease of use, convenience, and availability at our institution.
Sarin et al. previously studied the incidence of fibrosis in patients with PNALT and PIEALT. In PIEALT, 65% of HBeAg positive and 63% of HBeAg negative patients had significant fibrosis. On the other hand, in PNALT, 40% of HBeAg reactive and 13% of HBeAg negative patients had fibrosis. Approximately 21% of patients with HBeAg negativity, PNALT, and HBV DNA < 5 log had significant histologic activity [histologic activity index (HAI) ≥ 3 and fibrosis ≥ 2] [15]. In our study, 16.8% with normal liver function test (LFT) had significant fibrosis.
The prevalence of significant fibrosis was 27% in the study cohort and 30.5% in the validation cohort. Three-fourths of patients in the study cohort were HBeAg negative with DNA load < 5 log IU/ml. In a study by Dixit et al. of 29 IDAHS, 51% had Knodell HAI > 3, with higher serum glutamic-oxaloacetic transaminase (SGOT) having higher activity, and 20% of those with normal ALT showing histologic activity. Most patients included in the study were HBeAg negative, with the authors also concluding that HBeAg seroconversion was common in patients > 20 years of age [16]. They also concluded that HBeAg reactivity and higher mean HBV DNA levels were associated with those with activity on biopsy. However, in our study, there was no association of HBeAg status and DNA levels with SGPT levels or fibrosis on FibroScan.
In a previous study from Northern India of 113 IDAHS, steatosis was noted in 52% of biopsies. 34% had significant fibrosis. Fibrosis was more commonly associated with those having higher necroinflammatory activity and those with anti-HBe reactivity [17]. Even in our study, there may have been an association with nonalcoholic fatty liver disease (NAFLD), leading to increased fibrosis in hepatitis B subjects with diabetes. Superimposed NAFLD in patients with hepatitis B was associated with a three-fold increased risk of hepatocellular carcinoma in these patients [18]. In a previous study by Sun et al., patients with chronic hepatitis B and abdominal obesity had more significant liver fibrosis than those with normal BMI. Diabetes, increased aspartate transaminase, and smoking were associated with advanced fibrosis in the group with obesity [19]. The patients with NAFLD in the same study were more likely to have increased BMI and the presence of metabolic risk factors, with proportionately more cirrhotics. However, their values of SGOT and SGPT were lower in the group with more steatosis. In our study, no correlation of fibrosis with BMI was found. Also, there was no correlation between raised SGOT or SGPT and diabetes in our study.
The potential advantages of the DAPS score include ease of use at the bedside, no need for costly tests, and high specificity with good positive and negative prediction, although sensitivity remains low. The results were internally validated, providing strength to our initial findings. The limitations include the fact that biopsy correlation was not done. There is equal weightage in the scoring design for all parameters. Also, the cutoffs for SGPT were based more on convenience and could have been higher. Although an ideal score is one with high sensitivity and specificity, those with moderate sensitivity and specificity compromise the predictive accuracy. To preserve predictive accuracy of the score, the low-risk and high-risk groups of the DAPS score were defined as 0-2 and 3-4, respectively. Next, due to the low sensitivity and imperfect negative predictive value of this scoring system, many patients will have a false negative result. Hence, there might still be a segment of patients with low or intermediate predictive value, who are to be referred for VCTE. Lastly, diabetes mellitus itself is a confounding factor. Presence of diabetes predisposes to NAFLD, and in a study 15.4% and 7.7% of patients with diabetes were found to have advanced fibrosis and cirrhosis, respectively [20]. Thus, differentiating the exact etiology of fibrosis becomes difficult. This is important as fibrosis due to HBV requires antiviral therapy but that due to NAFLD may not require anti-viral therapy.
To conclude, significant fibrosis is present in up to 30% of IDAHS. Approximately 17% of individuals with IDAHS and normal LFT have significant fibrosis. Assessment of fibrosis in this subgroup is of importance in defining therapy. The DAPS score can be used easily at the bedside to assess significant fibrosis in IDAHS with excellent specificity and positive and negative predictive value.


