
Introduction
Liver transplantation is the current standard of care treatment for patients with end-stage liver disease [1]. However, scarcity of donors, complex surgical technique, and need for immunosuppression remain major disadvantages of the procedure. Due to the increasing discrepancy between patients requiring transplants and available organs, there is an urgent need for alternative pathways for organ replacement.
Cell-based therapies have emerged as an appealing alternative to whole organ transplantations [2]. They offer hope for extending from the palliative short-term approach, such as bioartificial liver, to more permanent solutions, such as cellular transplantation [2, 3]. Studies using hepatocytes as cellular transplantation revealed the short life span of these injected cells. The introduction of scaffolds was proposed to improve cell viability and function [4].
Decellularization is a process aiming to use natural extracellular matrix (ECM) as a scaffold after complete removal of cells. ECM is composed of structural components: collagen and elastin and proteoglycans, in addition to bioactive molecules capable of growth factor signaling and cell-cell interaction [5, 6].
In the case of decellularized liver bioscaffold, recellularization can be done by stem cells introduced into the vascular tree. These cells typically grow and differentiate into proper cells triggered by signal proteins in the ECM.
As tissue engineering methods evolve to approach clinical translation, it is important to explore possible options for scaffold materials. Thus, this study was designed to compare the histological, morphological and immunohistochemical differences between decellularized liver bioscaffolds in two common liver disorders, liver fibrosis and hepatocellular carcinoma, and a normal liver bioscaffold.
Material and methods
Animal model
Thirty Swiss albino rats (130-150 g) were used in this study. The rats were housed in plastic laboratory cages in the animal facility of the Egyptian Company for the Production of Sera and Vaccines (EgyVac.), affiliate of the Holding Company for Biological Products and Vaccines (Vacsera). They were hosted under conditions of fixed 27°C and 12 hours of light/day and fed on pelleted chow (composed of: 11.2% moisture, 25.4% protein, 4.8% crude fiber, 8.5% ash, and 3.4% fat). Water was offered freely. Rats were hosted according to the regulations of the animal care and use committee (ACUC) [7].
The animals were divided into 3 main groups, 10 rats of each as follows: group I: normal control group, group II: hepatocellular carcinoma (HCC) group, and group III: hepatic fibrosis (HF) group.
Hepatocarcinogenesis was induced chemically by injection of a single intraperitoneal dose of diethylnitrosamine (200 mg/kg b.w.) (Sigma Aldrich, St. Louis, USA) followed by weekly subcutaneous injections of carbon tetrachloride (3 ml/kg b.w.) for 6 weeks [8, 9].
Hepatic fibrosis was induced chemically by intraperitoneal injection of carbon tetrachloride (CCl4) (Sigma Aldrich, St. Louis, USA) at a dose of 1 μl/g b.w. twice a week for 4 weeks [10].
Evaluation of the animal models
Histological study
Evaluation of animal model induction was done by histological examination of H & E stained sections [11].
Decellularization study
Animal preparation. Rats were euthanized; a longitudinal abdominal incision was made. The portal vein was dissected and transected. Falciform and cardiac ligaments were transected and the liver mobilized to show the inferior vena cava. The vena cava was transected above and below the liver and any remaining attachments to the liver were dissected. The liver was removed with the capsule intact.
Decellularization process. One side of the vena cava was ligated and the other end was cannulated with a 20 G cannula. The portal vein was also cannulated with a 20 G cannula. The cannulae in the portal veins were attached to a pump and distilled water was perfused through the portal vein at a rate of approximately 5 ml/minute. Approximately 40 times the volume of the liver was perfused through this circuit. Subsequently, 1% Triton-X 100 (Sigma Aldrich, St. Louis, USA) with 0.1% ammonium hydroxide (Sigma Aldrich, St. Louis, USA) was perfused through the livers to decellularize the organ. Approximately 50 times the volume of the liver was circulated through the vascular tree. Finally, a distilled water wash was circulated to wash out the decellularization detergent [12-14]. After decellularization was complete, the resultant decellularized liver bioscaffolds were evaluated.
Decellularization quality evaluation and bioscaffold characterization. The extent of decellularization was evaluated through histological examination and measurement of DNA concentration in the decellularized sample and comparing it with that of a whole cell liver sample. Characterization of the resultant bioscaffold and its extracellular matrix component was done through immunohistochemical and morphometric studies.
DNA concentration study
DNA was extracted from small pieces of the different resultant bioscaffolds as well as from fresh livers using a Mini-prep kit (Promega, Madison, USA). The study was done according to the manufacturer’s instructions. Briefly, 20 μg of tissue were grinded by a sonicator and proteinase K was used for DNA extraction. DNA concentration was estimated at 280 nm using a spectrophotometer (Thermo Spectronic, Biomate 3, Rochester, NY).
Histological study of scaffold
Samples from the bioscaffold resulting from liver decellularization of normal, HCC and HF rat models were examined histologically as stated before [11].
Immunohistochemical study
The immunohistochemical analyses were performed in formalin fixed and paraffin embedded bioscaffold sections using anti-collagen IV (Dako, Glostrup, Denmark), anti-laminin (Dako, Glostrup, Denmark), anti-fibronectin (Dako, Glostrup, Denmark) and anti-alpha-fetoprotein (Dako, Glostrup, Denmark) according to the manufacturer’s instructions. Immunostainings were performed by the labeled streptavidin avidin biotin (LSAB) method. The time from the fixation of the specimens to embedding is about 3 to 4 days. Tissue sections were deparaffinized in xylene and dehydrated. They were immersed in citrate buffer (0.1 m, pH = 0.6) and subjected to microwave irradiation twice for 15 min. Subsequently, all sections were treated for 30 minutes with 0.3% hydrogen peroxide in methanol to quench endogenous peroxidase activity and then incubated with primary antibodies. All dilutions were made in TBS-1% BSA solution, followed by overnight incubation. The antibody sources and dilutions are shown in Table 1. After washing in TBS, the paraffin sections were incubated for 30 minutes with a rabbit antimouse antibody and for another 30 minutes with mouse antirabbit peroxidase conjugate. Between each conjugation, sections were washed for 10 minutes with TRIS buffer. After final washing with TBS, diaminobenzidine (DAB) containing 0.05% H2O2 solution was used to visualize the immunoreactivity [15, 16].
Morphometric study
The slides of the immunohistochemical study were used in this study. The Leica Qwin 500 image analyzer computer system was used to measure, analyze and compare the different resultant bioscaffolds regarding the thickness of the bioscaffold capsule, thickness of the main blood vessel wall, colored area and the color intensity resulting from anti-collagen IV, anti-laminin, and anti-fibronectin immunohistochemical staining. As alpha fetoprotein is a cytoplasmic marker, so for anti-alpha fetoprotein, numbers of stained cells were counted as the only parameter that can be measured.
Statistical analysis
The results of this study were represented by means ± SD. The data were subjected to statistical analysis using oneway ANOVA [17].
Results
Histological study
Light microscopic examination of H&E stained liver sections of the control normal rats showed a normal hepatic architectural pattern. Each hepatic lobule was formed of tightly packed cords of hepatocytes radiating from the central vein. The hepatic cords were composed of polygonal hepatocytes with rounded vesicular nuclei and acidophilic cytoplasm. Blood sinusoids with their endothelial lining were noted between hepatocyte cords (Fig. 1A, B).
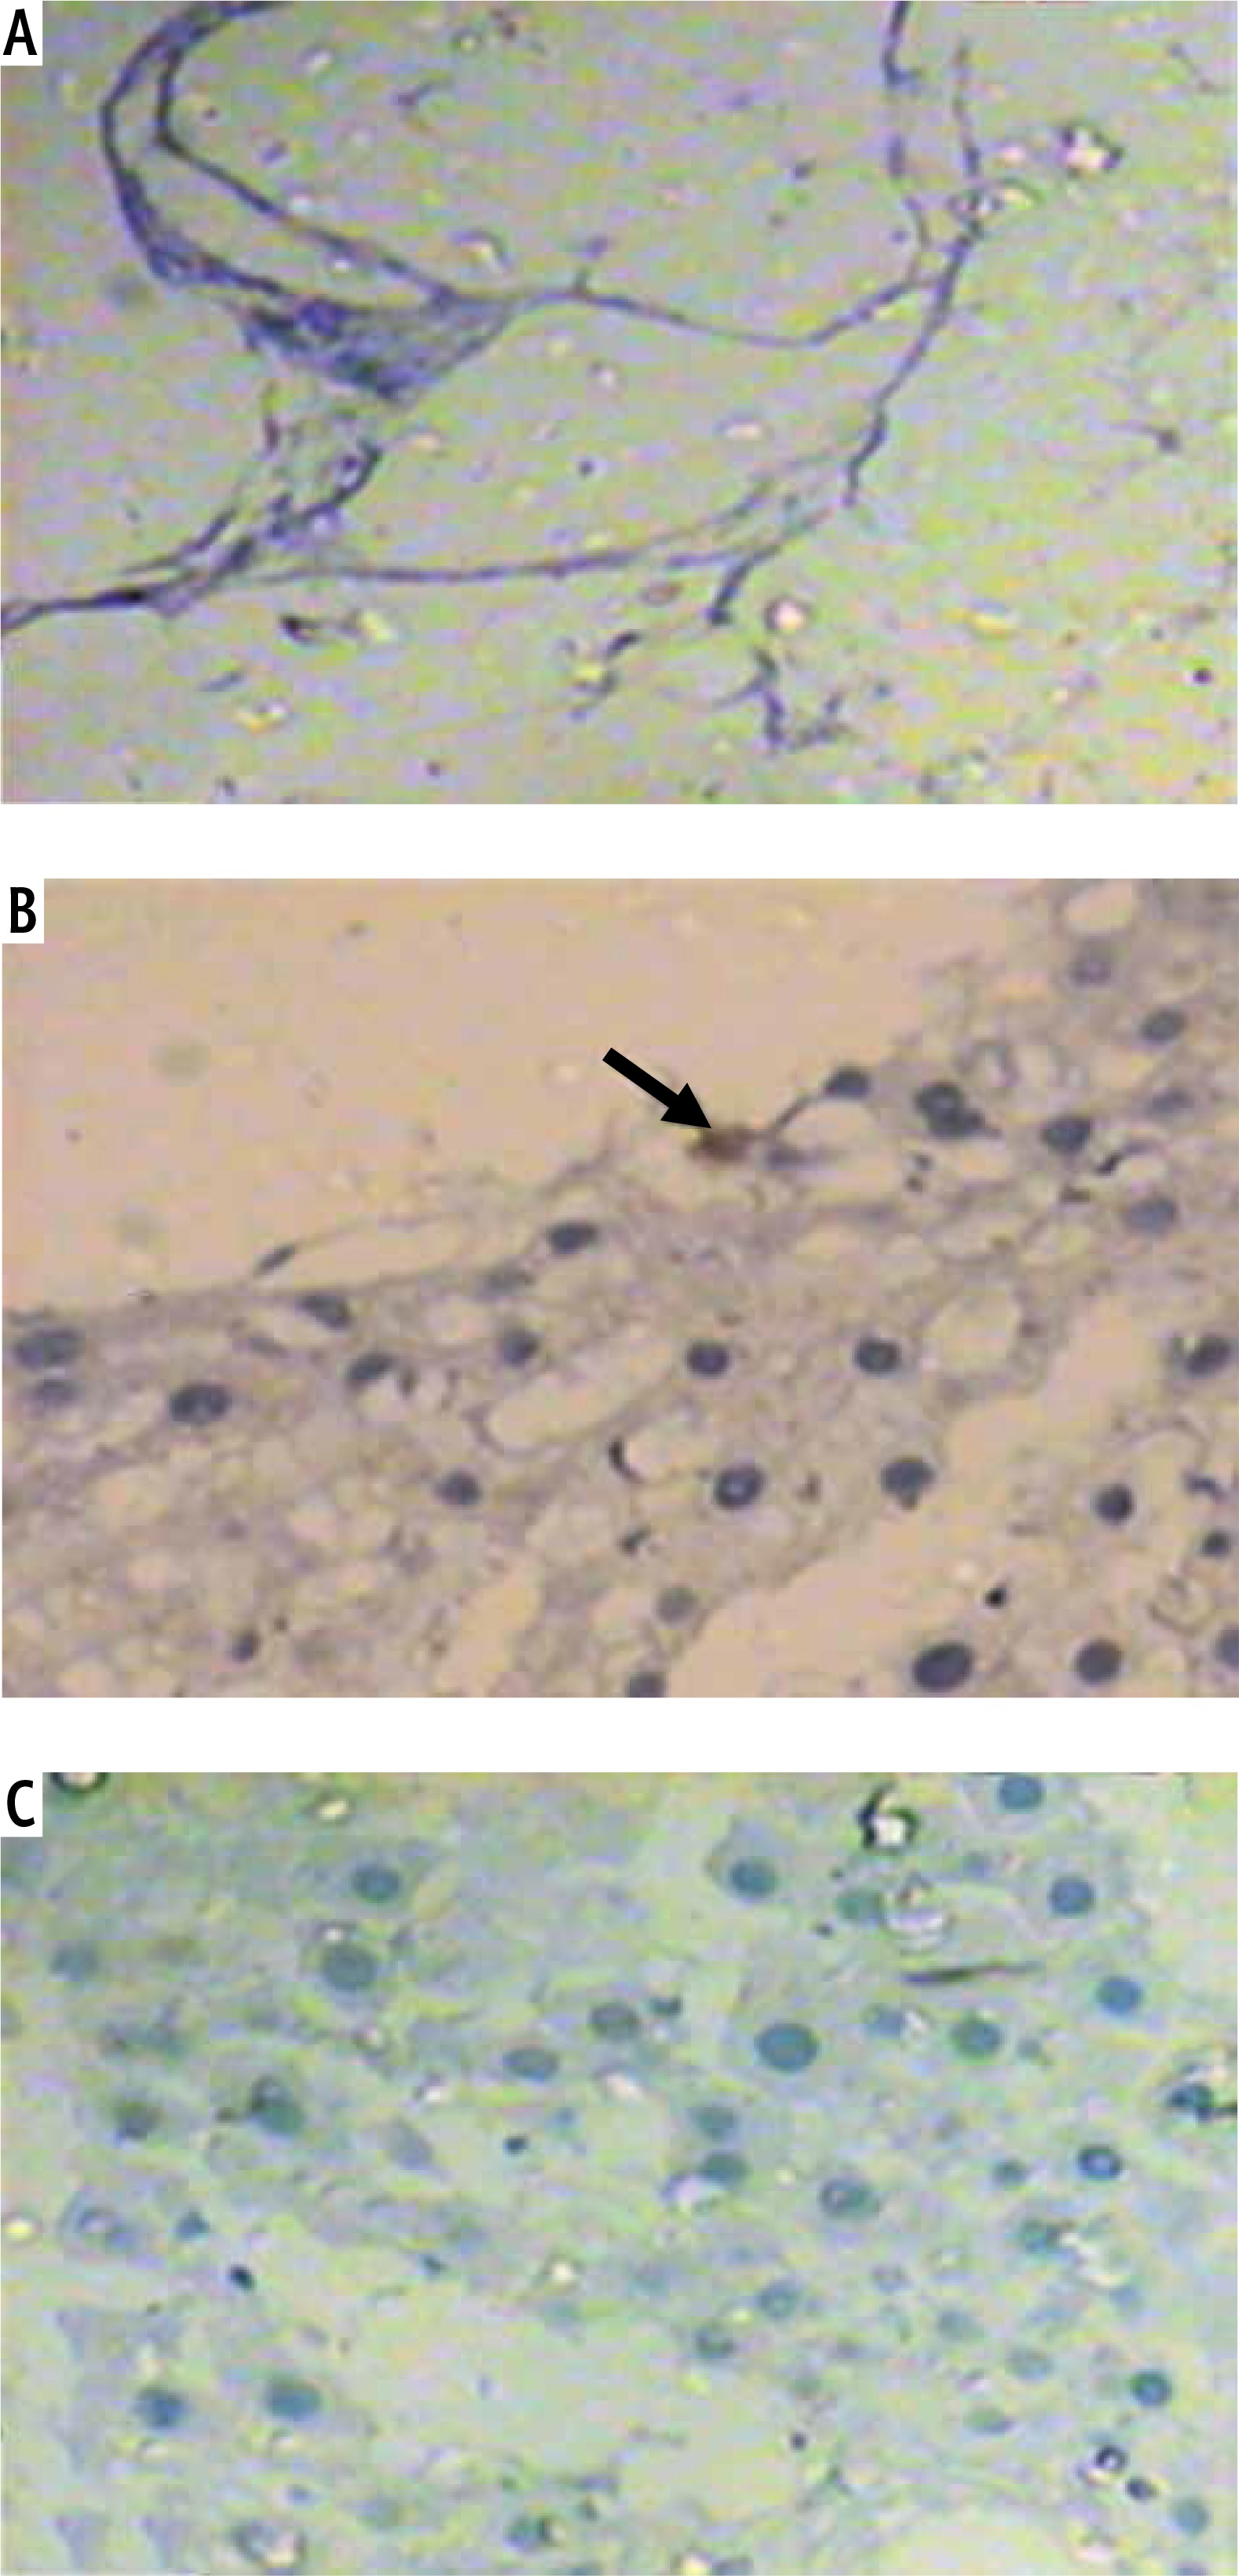
Fig.1
Micrograph of liver sections of (A) normal rat model showing normal architectural pattern as well as the portal area (black arrow), B) normal rat model showing tightly packed cords of hepatocytes (white arrow) radiating from central vein (blue arrow), hepatocytes with rounded vesicular nuclei (black arrow), acidophilic cytoplasm and blood sinusoids (orange arrow), C) HCC rat model showing great destruction of hepatic architectural pattern with multi-nucleated, highly proliferated hepatocytes (orange arrow), abnormal mitotic figures with pleomorphic nuclei (red arrows) and cellular infiltration of blood vessels (white arrow), D) HCC rat model showing focal lesion area (white arrows) of severe regression with vacuolar degeneration (bent arrows), E) HF rat model showing loss of architecture and dilated central vein (blue arrow) with detachment of the endothelial lining. Quantitative increase in connective tissue which peritubularly deposited (green arrow) and lipid droplets (yellow arrow), and (F) HF rat model showing many cells with vacuolated cytoplasm (arrow) and darkly stained nuclei. Dilated blood sinusoids (white arrow) and connective tissue peritubularly deposited (green arrow) (H & E, scale bar: 20 μm)
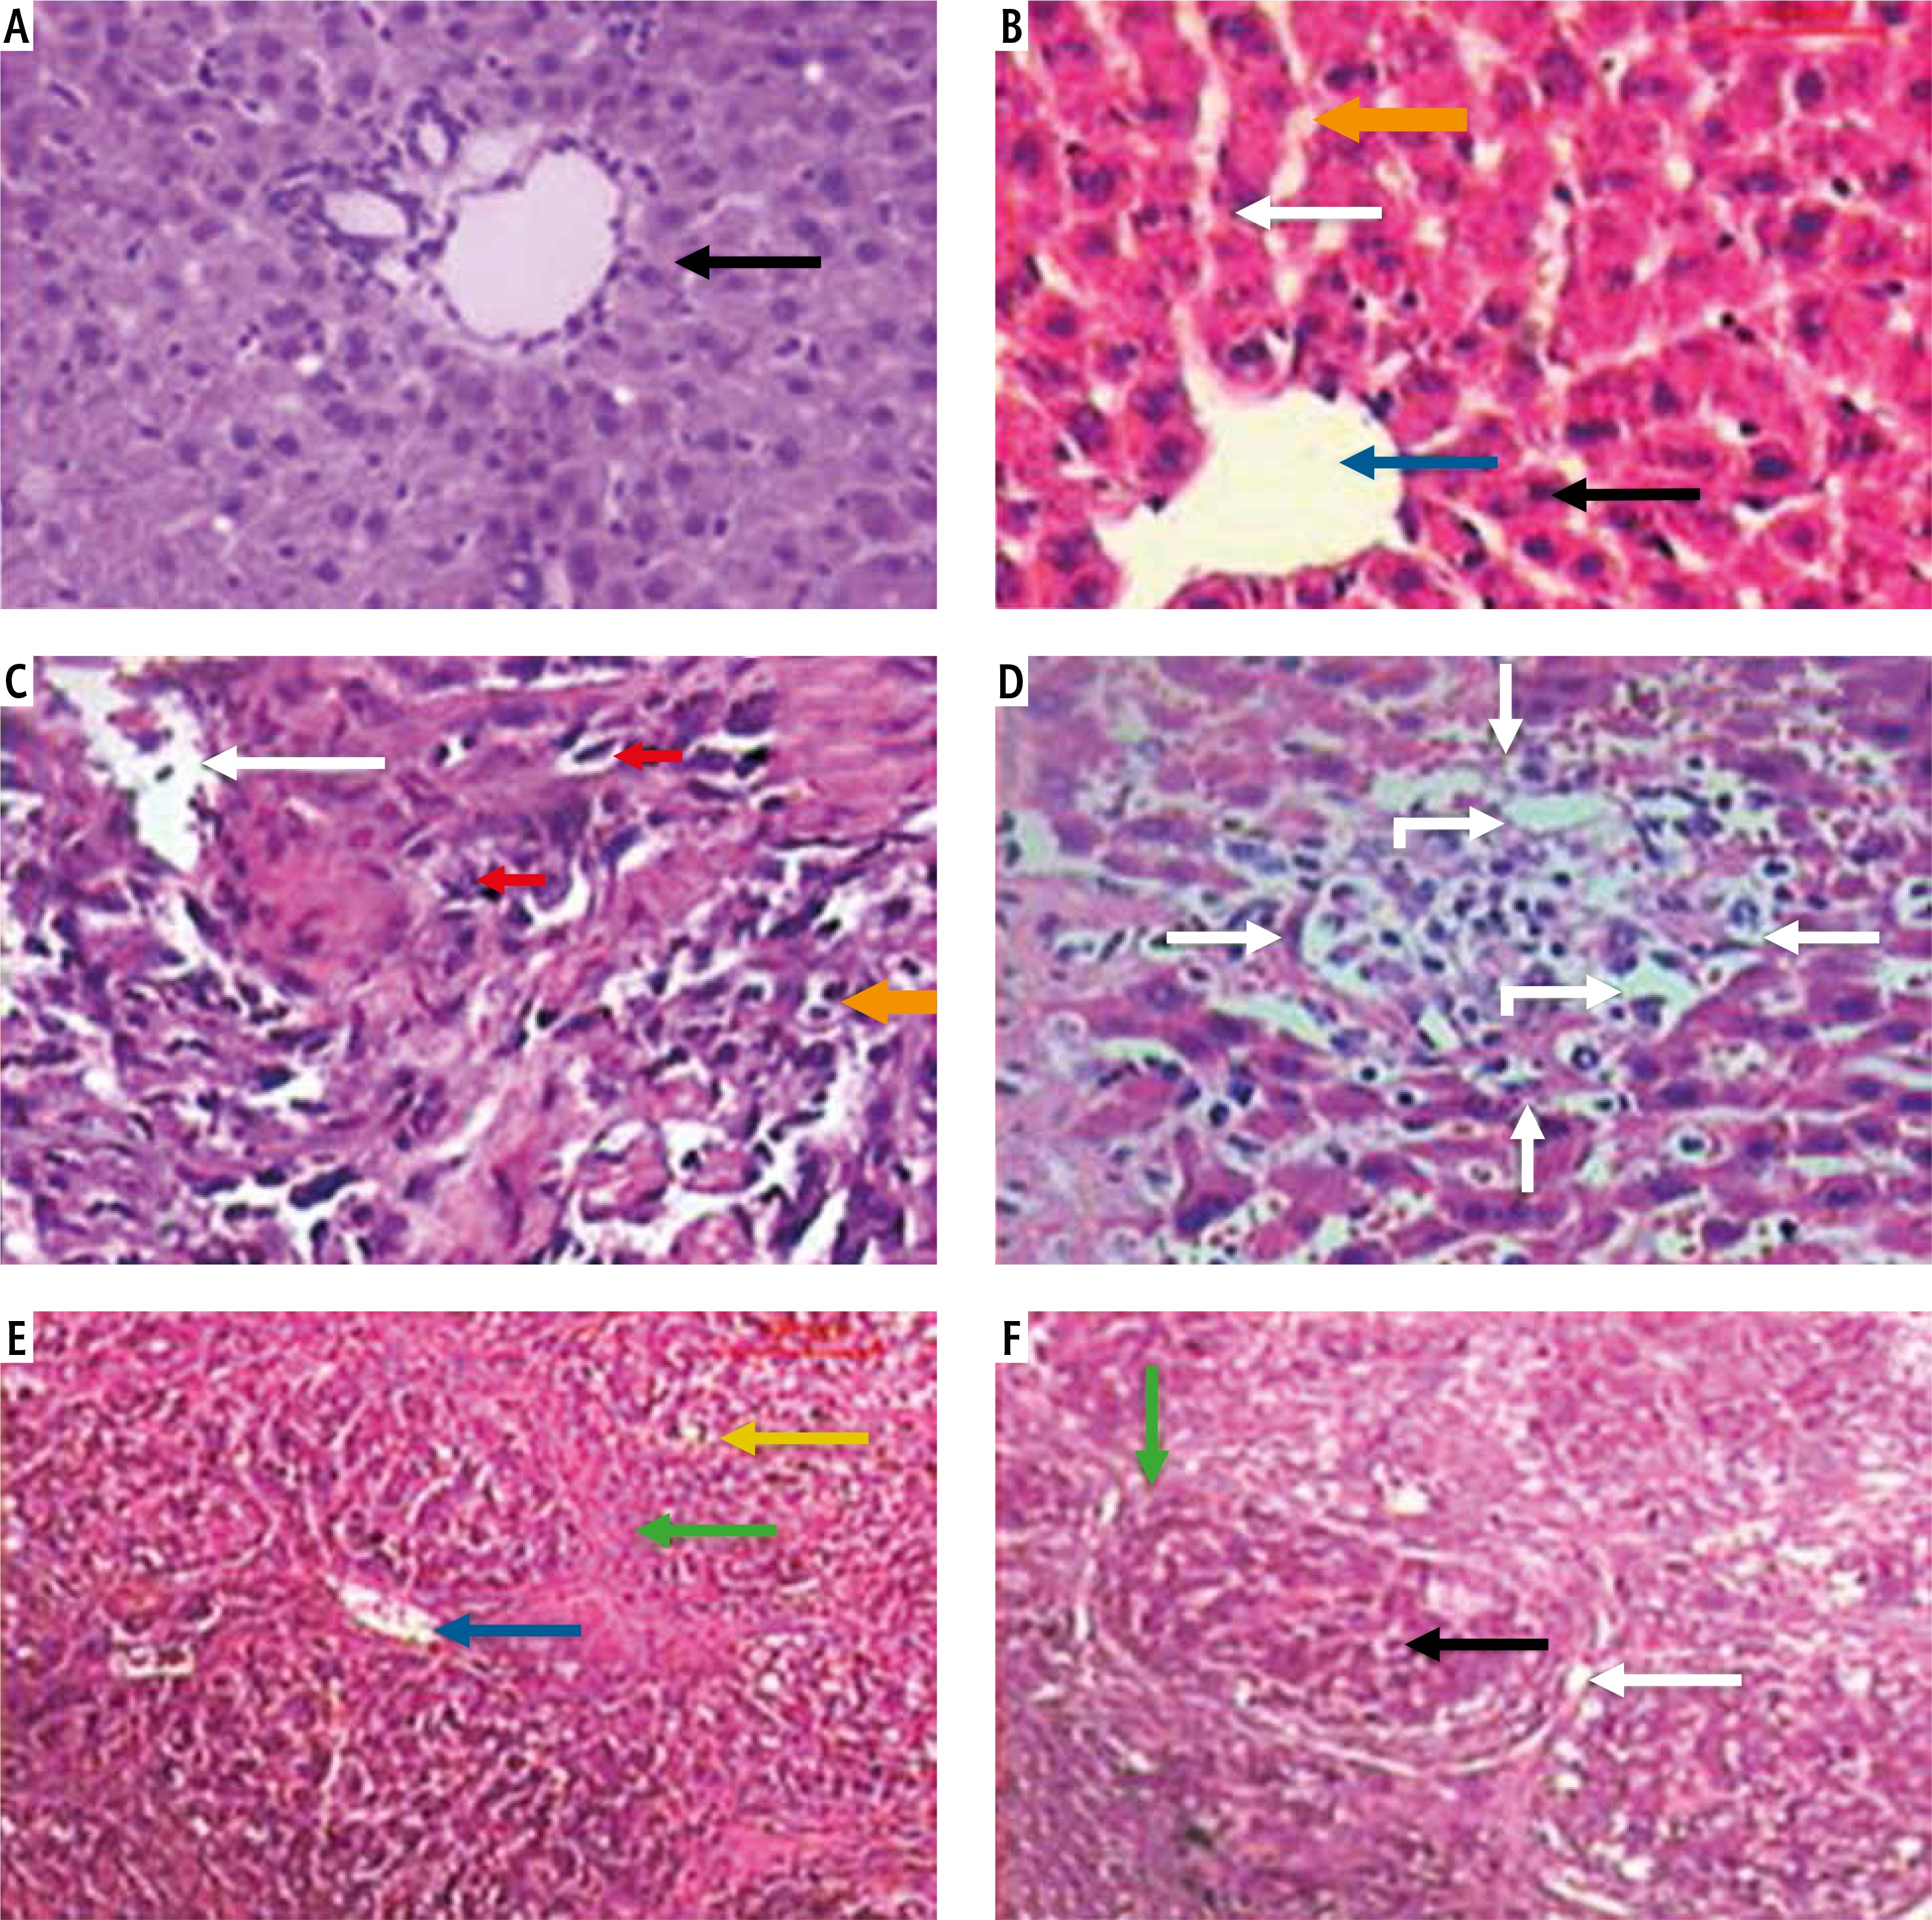
Examination of H&E stained liver sections of the HCC rat model showed great destruction of the hepatic architectural pattern with multi-nucleated, highly proliferating hepatocytes and abnormal mitotic figures with pleomorphic nuclei. Also, cellular infiltration of blood vessels, and a focal lesion area of severe regression with vacuolar degeneration were also observed (Fig. 1C, D).
Examination of H&E stained liver sections of the HF rat model showed loss of architecture and a dilated central vein with detachment of the endothelial lining is seen. There was an increase in connective tissue which deposited peritubularly with numerous lipid droplets, many cells had vacuolated cytoplasm and darkly-stained nuclei were observed (Fig. 1E, F).
Decellularization study
Decellularization quality evaluation and bioscaffold characterization
Gross architecture study. After the decellularization process was completed, the liver of all three rat models was transparent with no cell aggregations observed. The decellularized liver bioscaffolds retained the same gross shape of the liver with complete architecture of the hepatic capsule (Fig. 2A-C).
Fig. 2
Photographs of (A) decellularized liver bioscaffold showing complete architecture of liver with transparent appearance. B) Decellularized liver bioscaffold showing dorsal view of the architecture of the liver with no cell aggregations and large blood vessels, C) decellularized liver bioscaffold showing ventricle view of the architecture of the liver with transparent appearance, no cell aggregations and enlarged blood vessels, and (D) decellularized liver bioscaffold lobe showing complete vascular network with large blood vessels and multiple branching
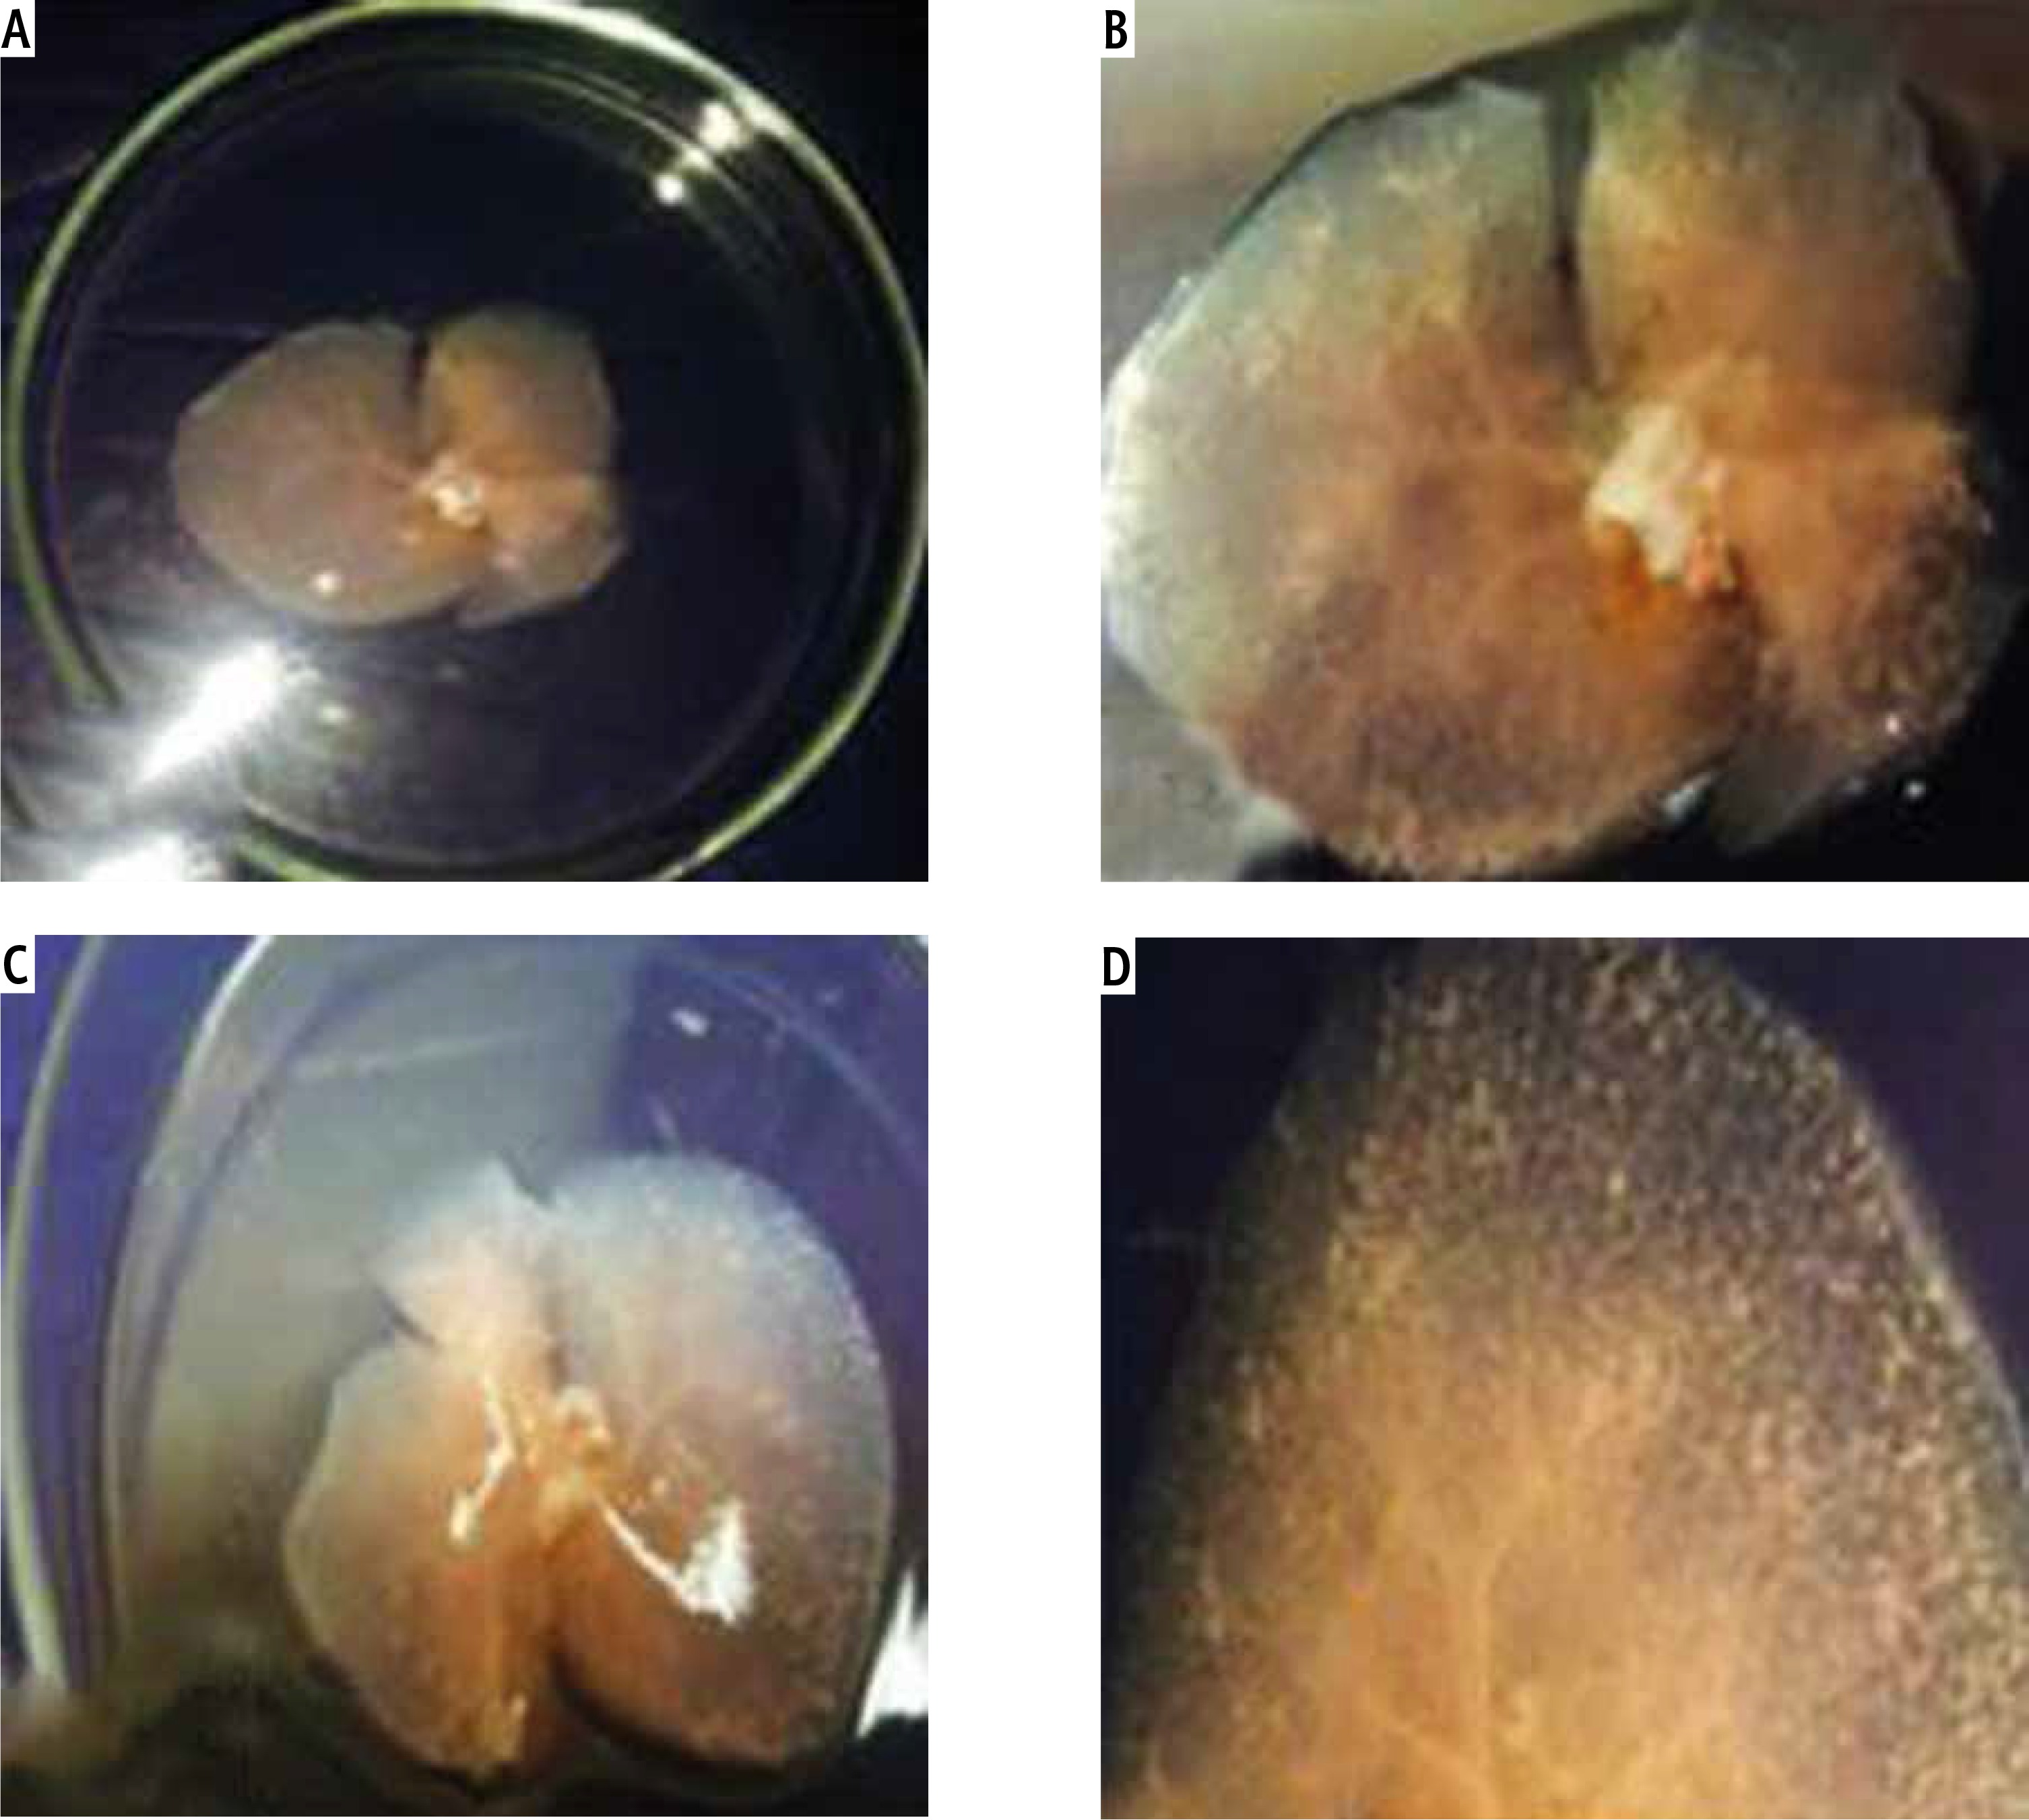
The vascular system was visualized clearly with large blood vessels and multiple branching (Fig. 2D). There was no significant difference between the gross shape of decellularized liver bioscaffolds of the three rat models used in the experiment.
Histological study. Light microscopic examination of the decellularized liver bioscaffold sections of normal rats showed complete cellular removal with neither nuclear hematoxylin staining nor cellular cytoplasmic keratins, leaving behind complete architecture of the liver. The preserved extracellular matrix and capsule wall with the septum extend into the liver about one-third of the way from the middle. Also, preserved blood vessels and complete portal areas were observed (Fig. 3A, B).
Fig. 3
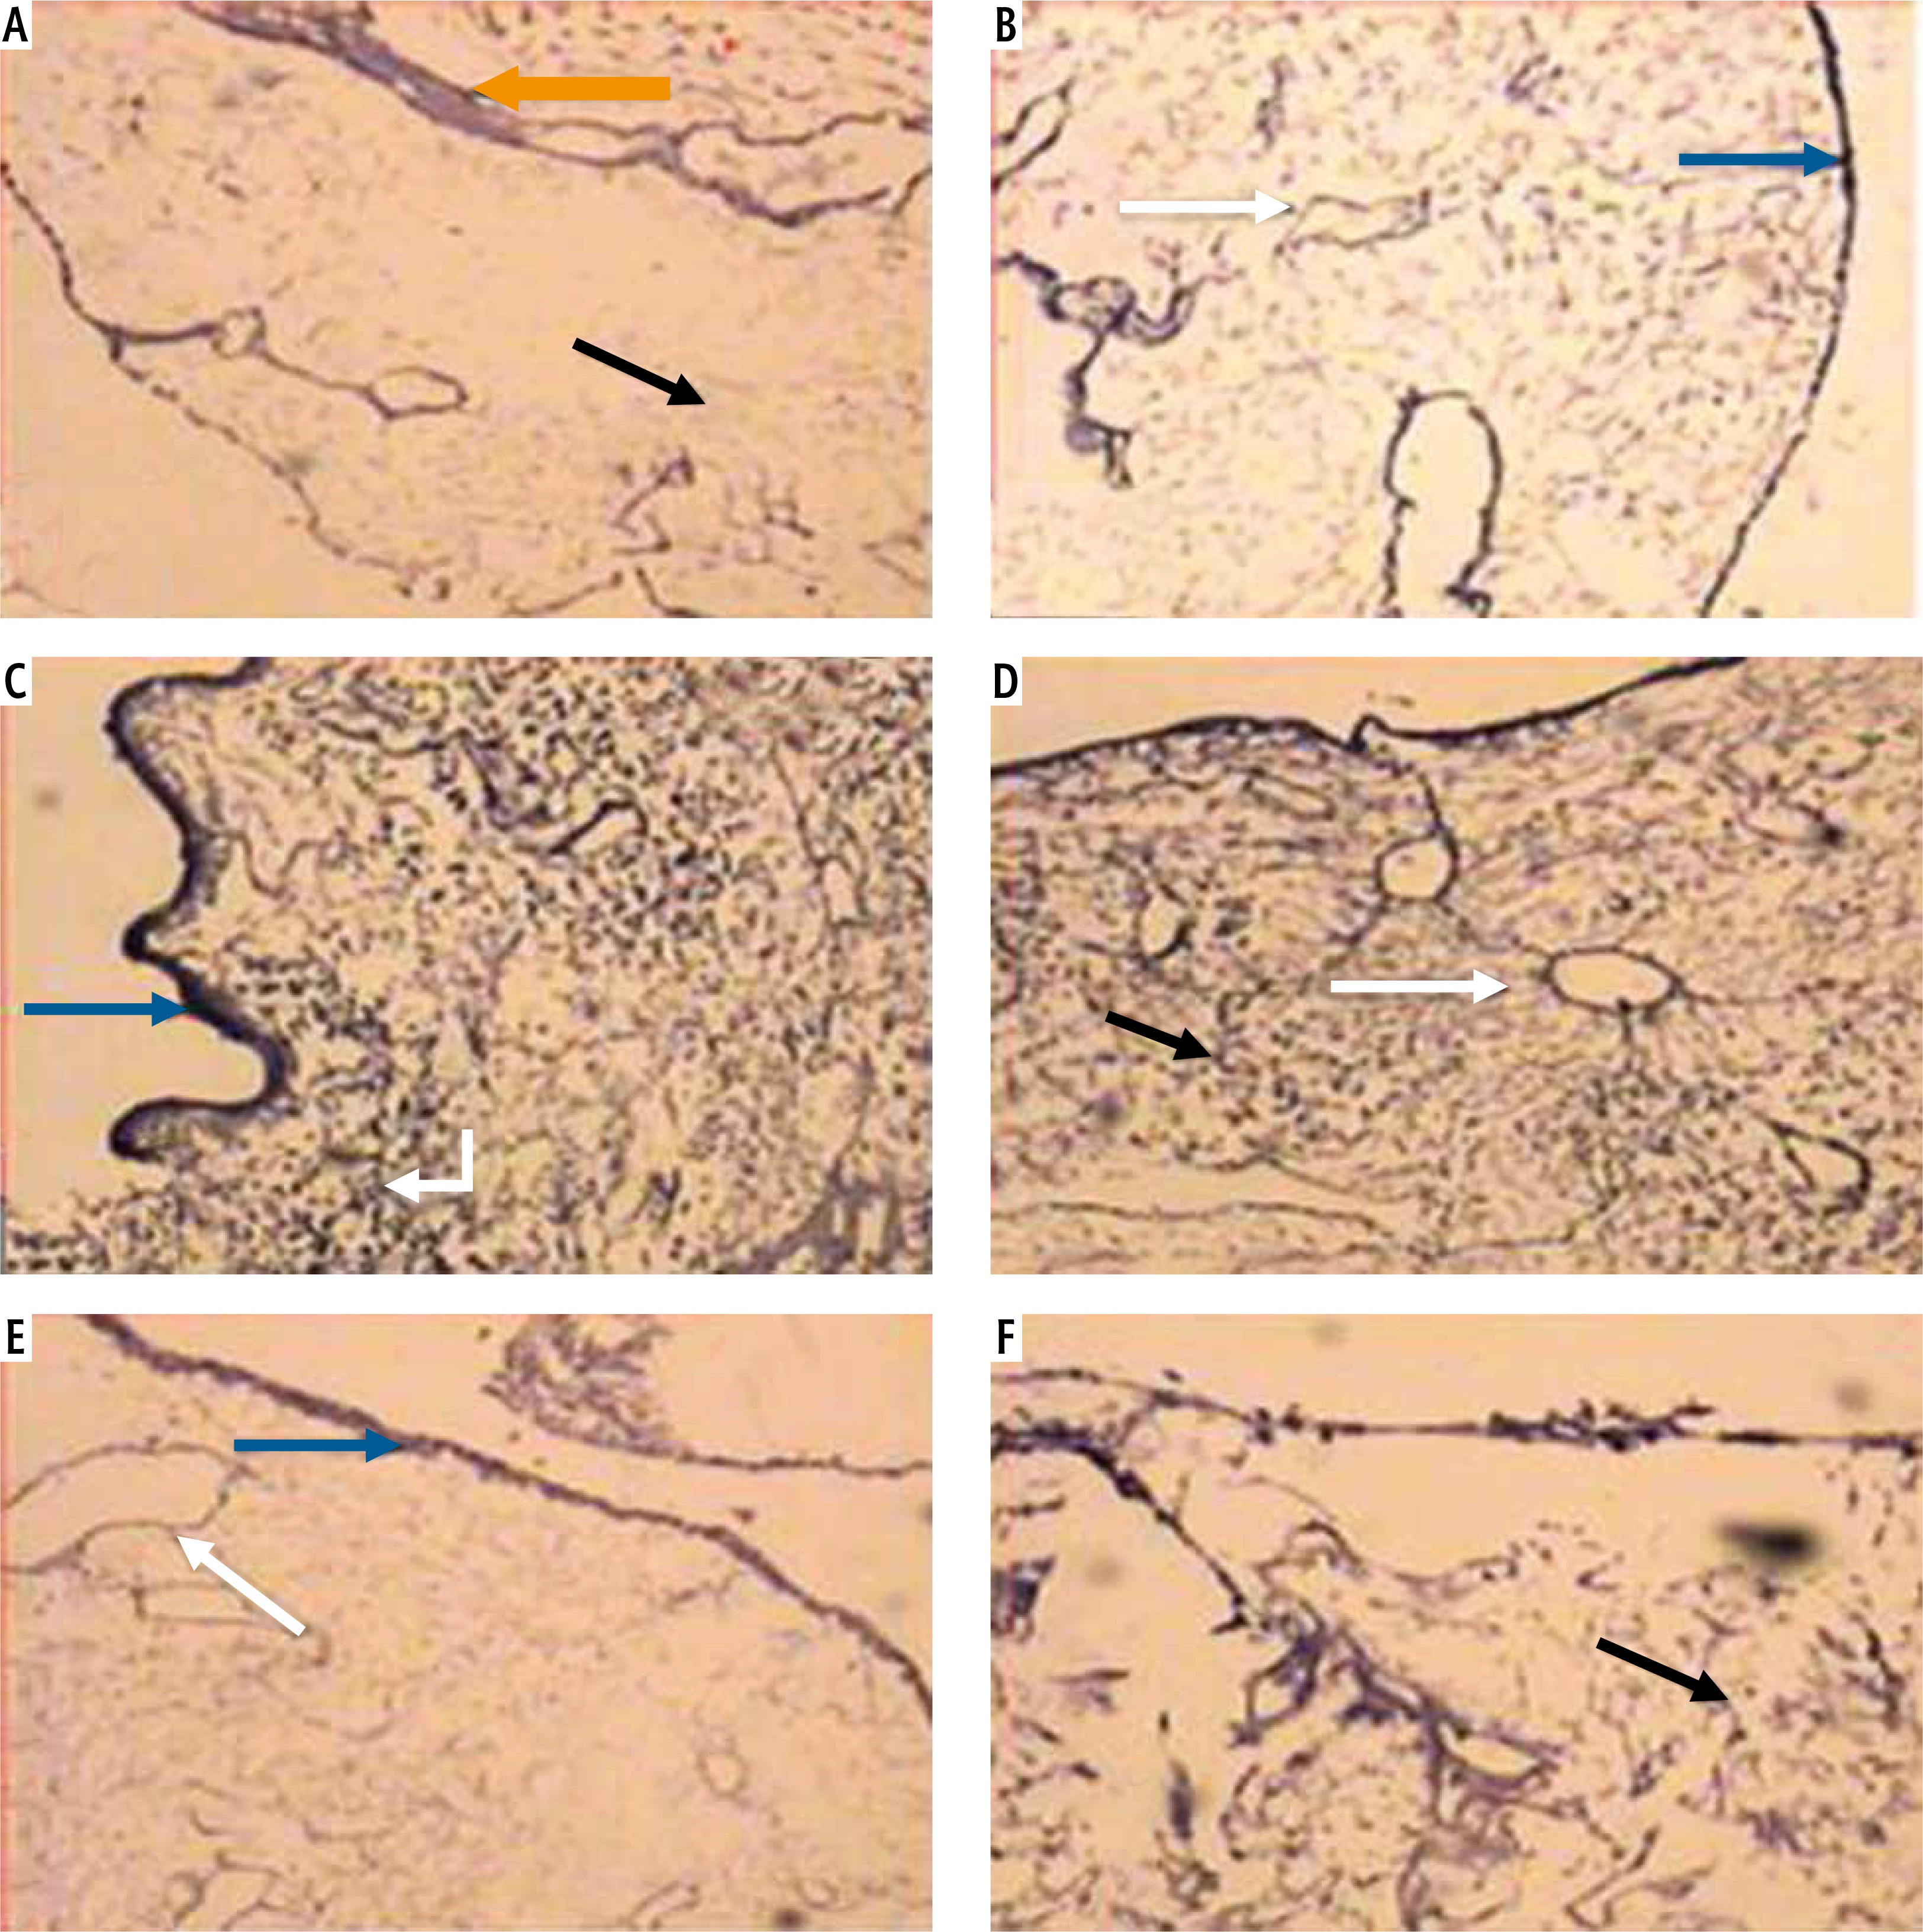
Micrographs of decellularized liver bioscaffold of (A) normal rat model showing complete cellular removal with neither nuclear hematoxylin staining nor cellular cytoplasmic keratins, leaving behind the extracellular matrix (black arrow) and preserved capsule wall (blue arrow) with the septum (orange arrow) extending into the liver and preserved blood vessel (white arrow), B) normal rat model showing complete preserved portal area (red arrow), C) HCC rat model showing the extracellular matrix (black arrow) with a few cell nuclei (bent arrow) and enlarged blood vessel (white arrow), D) HCC rat model showing preservation of complete portal area (red arrow) and capsular wall (blue arrow), E) HF rat model showing complete cellular removal with neither nuclear hematoxylin staining nor cellular cytoplasmic keratins, leaving behind the extracellular matrix (black arrow), normal capsular wall (blue arrow) and the septum (orange arrow), F) HF rat model showing the extracellular matrix (arrow) and central blood vessel (white arrow) surrounded by dense connective tissue (yellow arrow) (H & E, scale bar: 20 μm)
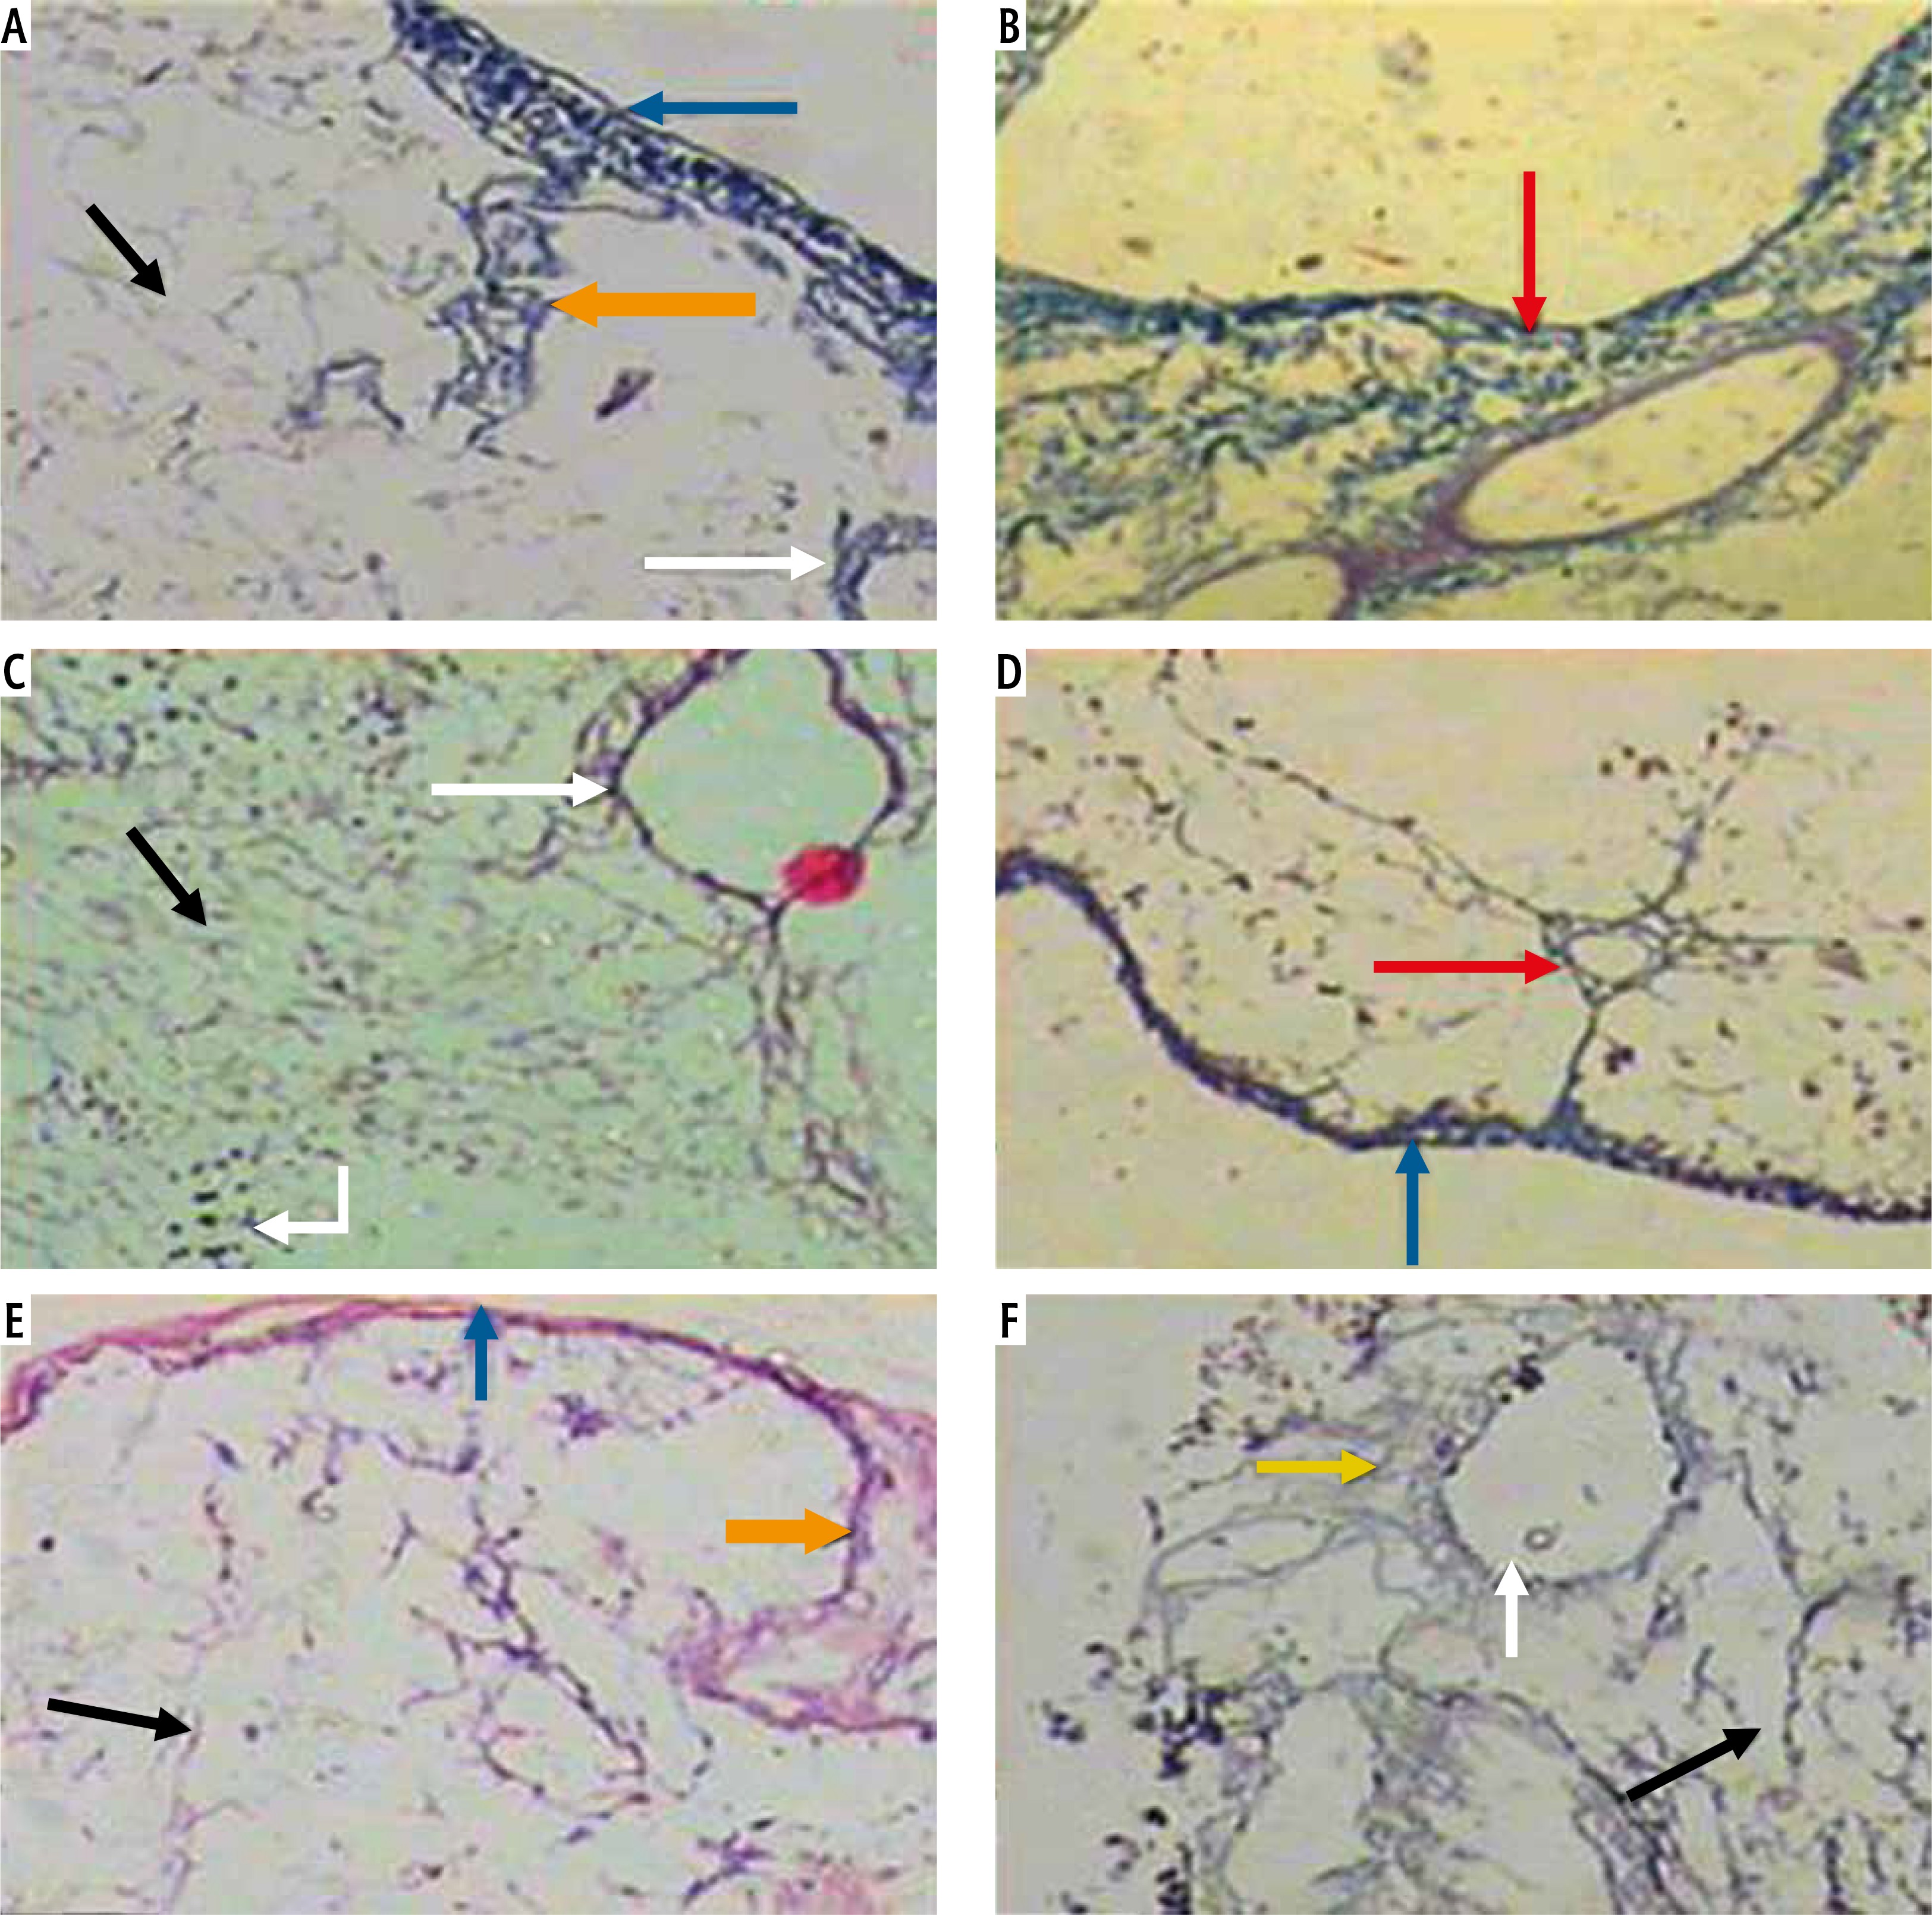
Examination of the decellularized liver bioscaffolds sections of the HCC rat model showed incomplete cellular removal with a little amount of remained cell nuclei but with complete architecture of the liver. The extracellular matrix, portal area, hepatic capsule wall and blood vessels were preserved (Fig. 3C, D).
Examination of the decellularized liver bioscaffold sections of the HF rat model also showed complete cellular removal with neither nuclear hematoxylin staining nor cellular cytoplasmic keratins. The liver architecture was maintained with its entire components including portal area, blood vessels, hepatic capsule wall and blood vessels (Fig. 3E, F).
DNA concentration study
Measurement of DNA concentration in fresh liver, which is considered the control for that in the decellularized liver bioscaffolds of the other rat models, showed a value of 940.17 ±22.65 ng/μl (Fig. 4A).
Fig. 4
Histograms showing (A) comparison between DNA concentration in whole liver (control) and decellularized liver bioscaffolds of normal, HCC and HF rat model, B) percent of residual DNA in decellularized liver bioscaffolds of normal, HCC and HF rat model in comparison with that of whole liver (control), and (C) percent of removed DNA in decellularized liver bioscaffolds of normal, HCC and HF rat model in comparison with that of whole liver (control)
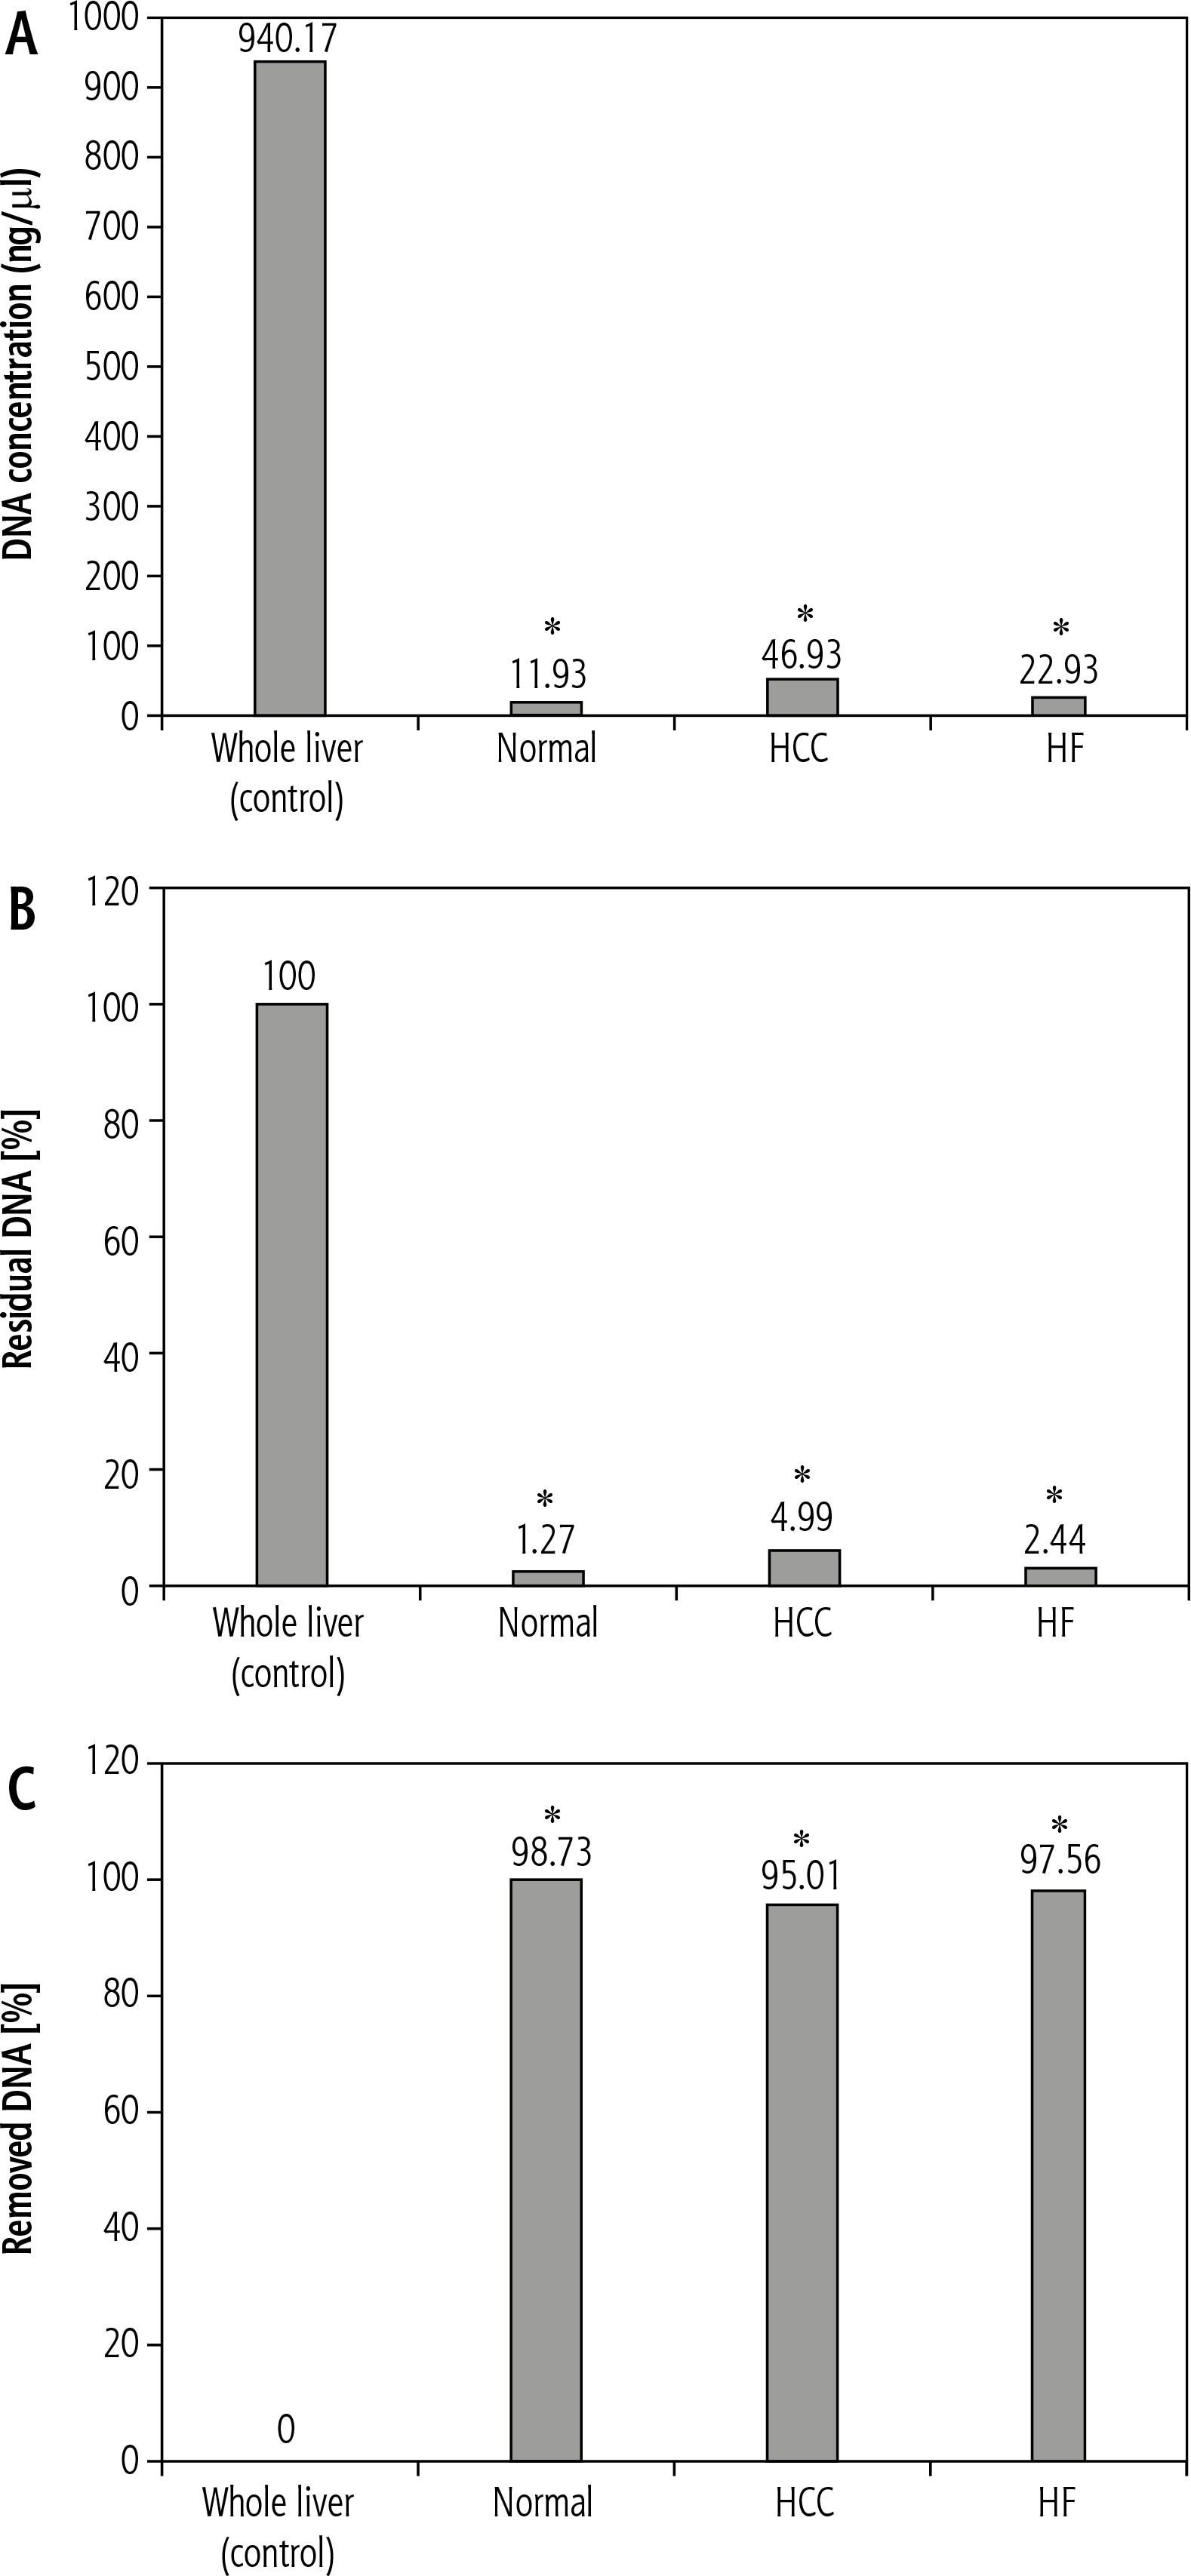
For the decellularized liver bioscaffolds of normal rats, DNA concentration was 11.93 ±1.79 ng/μl, which is equal to 1.27% of the DNA amount that was present in the whole cell liver. This means that the decellularization process succeeded in removing 98.73% of the DNA amount in that sample, which was a significant change (Fig. 4A-C).
In the case of decellularized liver bioscaffolds of the HCC rat model, DNA concentration was 46.93 ±4.77 ng/μl, which is equal to 4.99% of the DNA amount present in the whole cell liver. This means that the decellularization process succeeded in removing 95.01% of the DNA amount in that sample, which was a significant change (Fig. 4A-C).
In the case of decellularized liver bioscaffolds of the HF rat model, DNA concentration was 22.93 ±2.31 ng/μl, which is equal to 2.44% of the DNA amount present in the whole cell liver. This means that the decellularization process succeeded in removing 97.56% of the DNA amount in that sample, which was a significant change (Fig. 4A, B).
These results showed that the decellularization procedure used in this study was successful in removal of most of the DNA in the liver of all models, but the result in the decellularized liver bioscaffolds of the normal rat model was greater than that of the HF model, which was greater than that of the HCC model.
Immunohistochemical and morphometric study
Collagen IV
Light microscopic examination of anticollagen IV immunohistochemical stained decellularized liver bioscaffold sections of normal rats showed collagen IV depositions distributed in the hepatic capsule, wall of blood vessel, hepatic capsule wall and the hepatic septum (Fig. 5A, B); decellularized liver bioscaffold sections of the HCC rat model showed more wide, dense collagen IV depositions distributed in the hepatic capsule, on the hepatic capsule wall and blood vessel wall (Fig. 5C, D); while decellularized liver bioscaffold sections of the HF rat model showed wide, dense collagen IV depositions distributed in the hepatic capsule, on the hepatic capsule wall and blood vessel wall in a greater degree than the normal model but less than the HCC model (Fig. 5E, F).
Fig. 5
Micrograph of decellularized liver bioscaffold section of (A) normal rat model showing collagen deposition distributed in the hepatic capsule (black arrow) and the septum (orange arrow), B) normal rat model showing collagen deposition in the hepatic capsule wall (blue arrow) and blood vessel wall (white arrow), C) HCC rat model showing increased collagen deposition in the hepatic capsule wall (blue arrow) and some cellular nuclei (bent arrow), D) HCC rat model showing increased collagen deposition distributed in the hepatic capsule (black arrow) and in the blood vessel wall (white arrow) which is surrounded by connective tissue, E) HF rat model showing dense collagen deposition in the hepatic capsule wall (blue arrow) and blood vessel wall (white arrow), F) HF rat model showing dense collagen deposition distributed in the hepatic capsule (black arrow) (anti-collagen IV immunohistochemical stain, scale bar: 20 μm)
The recorded mean values of collagen IV deposition intensity in decellularized liver bioscaffolds of normal rats, the HCC model and the HF model were 87.86 ±2.01, 100.00 ±5.72 and 95.20 ±3.23, respectively (Fig. 6A).
Fig. 6
Histograms showing (A) collagen, laminin and fibronectin deposition intensity in comparison between decellularized liver bioscaffolds of normal, HF and HCC rat model, B) collagen, laminin and fibronectin deposition areas in comparison between decellularized liver bioscaffolds of normal, HF and HCC rat model, C) collagen, laminin and fibronectin deposition thickness in the hepatic capsule wall in comparison between decellularized liver bioscaffolds of normal, HF and HCC rat model, and D) collagen, laminin and fibronectin deposition thickness in blood vessel wall in comparison between decellularized liver bioscaffolds of normal, HF and HCC rat model
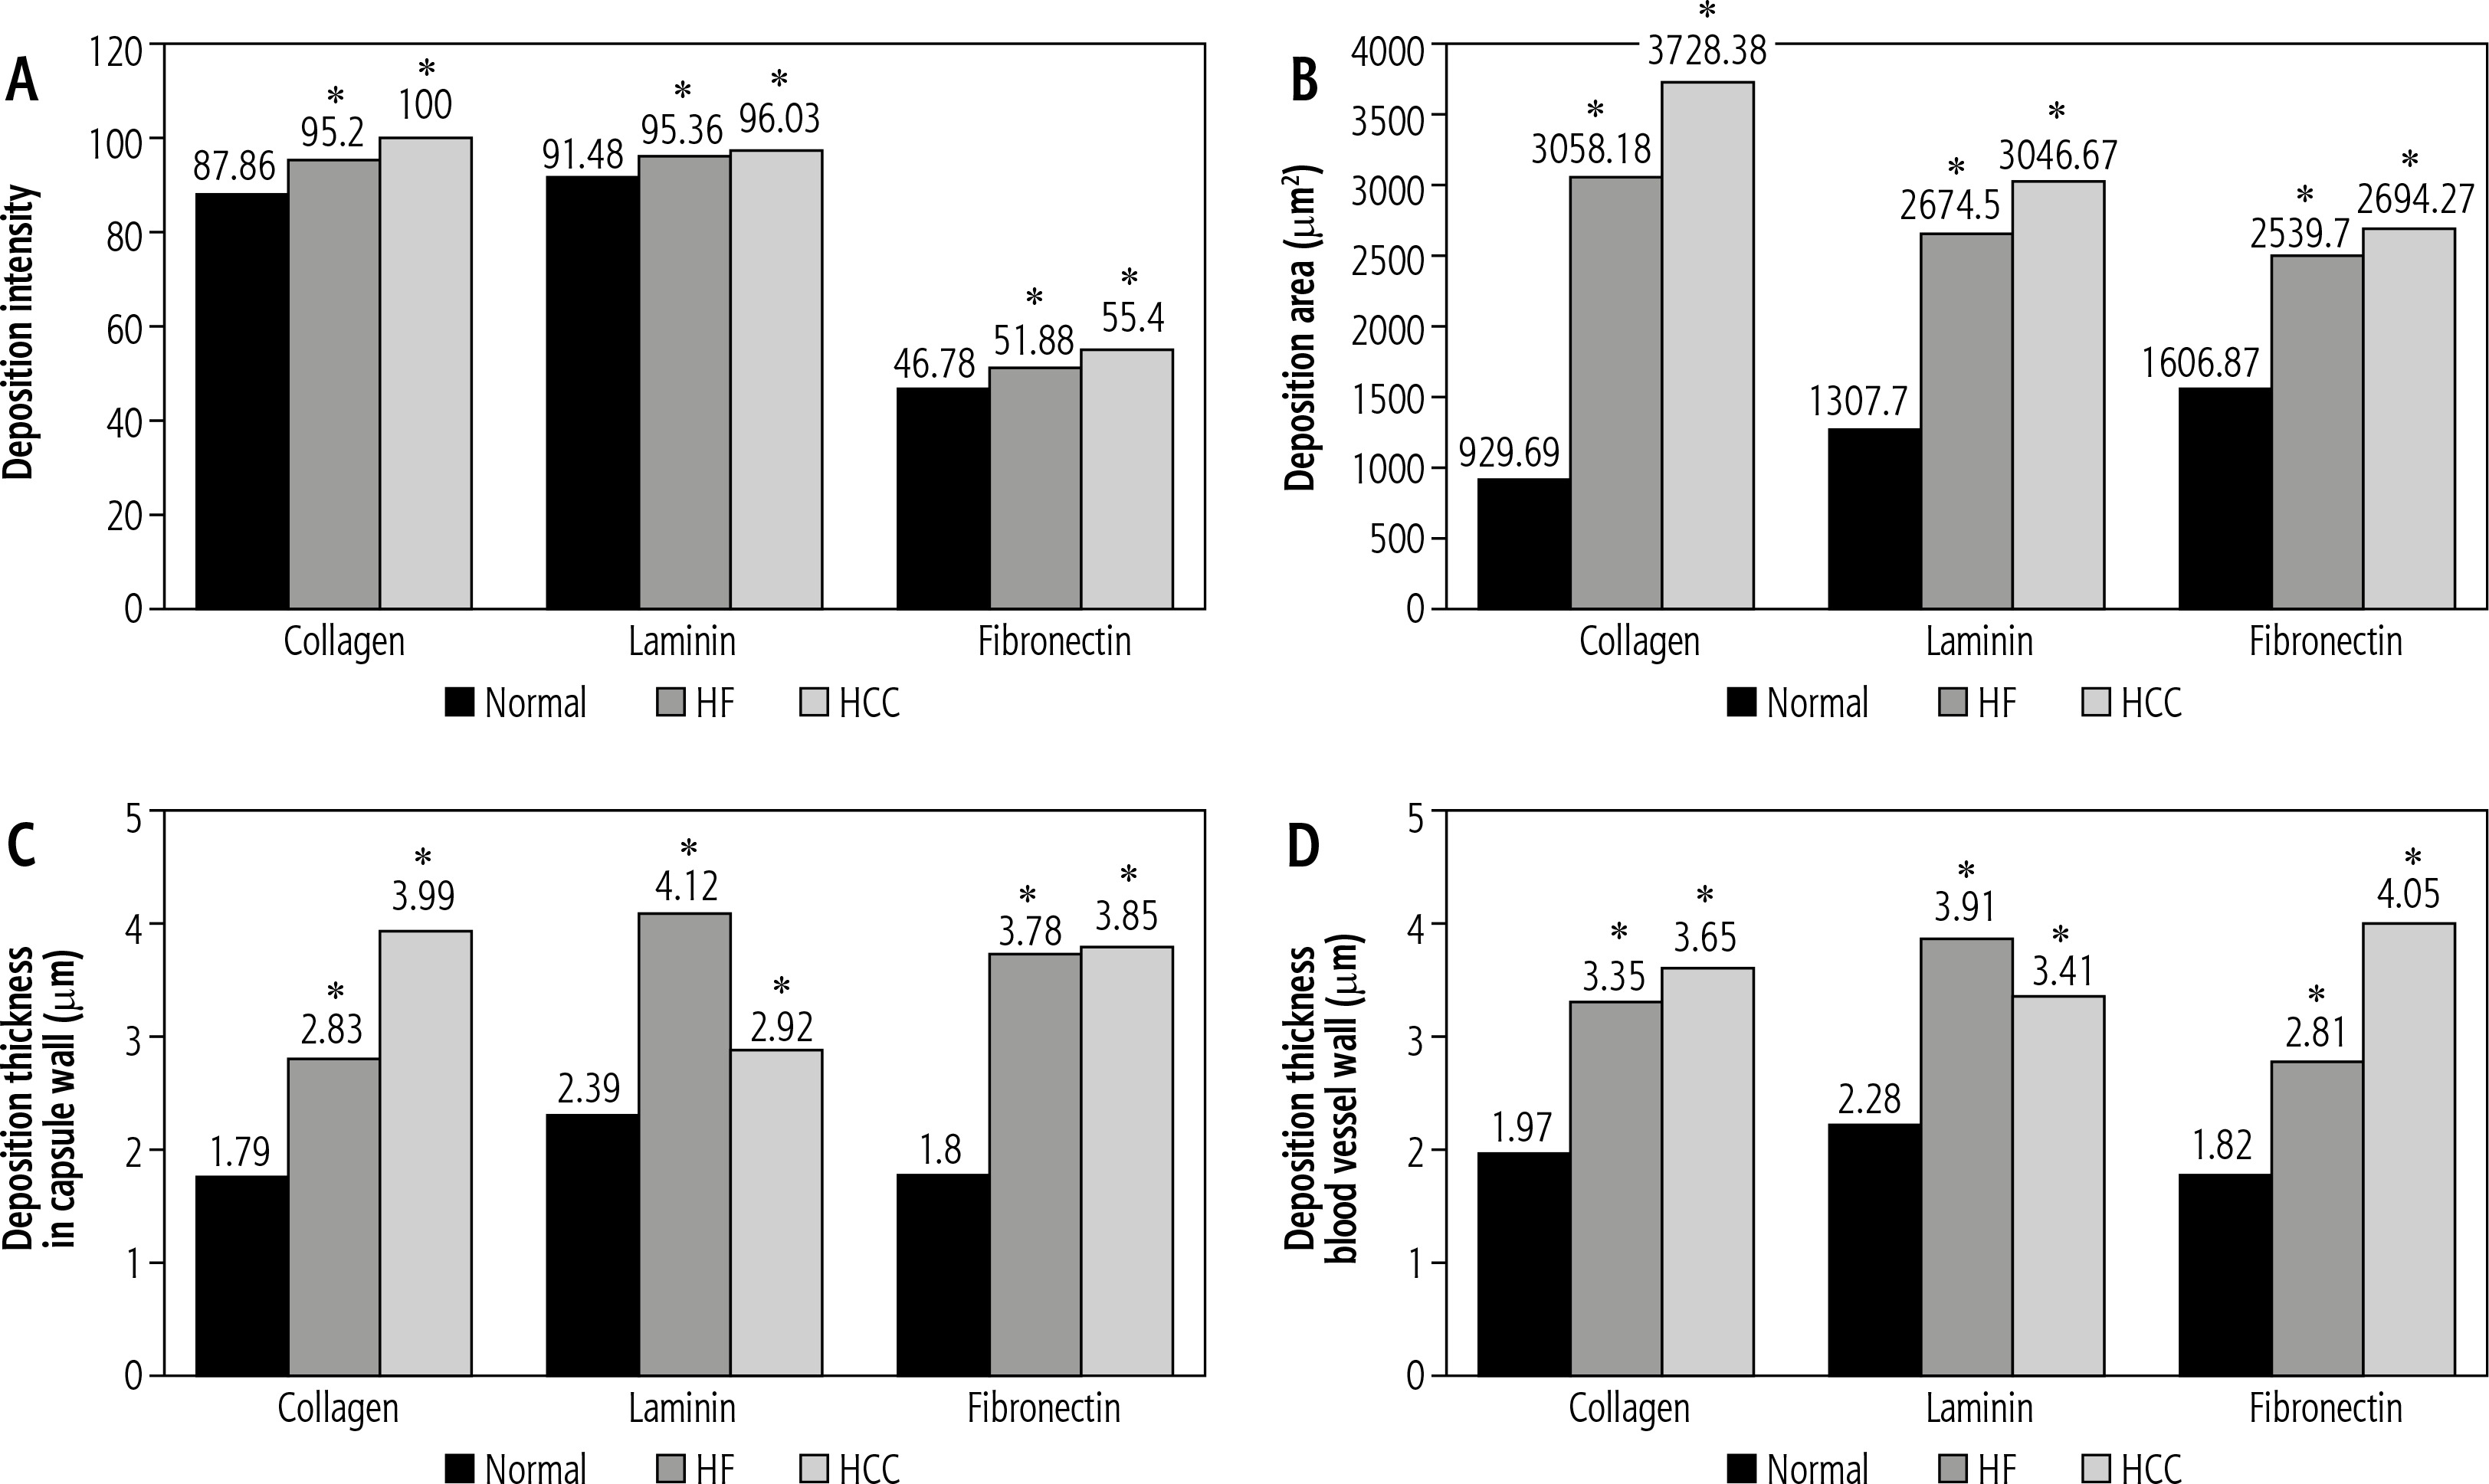
Concerning the mean values of collagen IV deposition areas in decellularized liver bioscaffolds of normal rats, the HCC model and the HF model, these were 929.69 ±591.94 mm2, 3728.38 ±1144.70 mm2 and 3058.18 ±871.63 mm2, respectively, with a significant increase in HCC and HF models as compared with normal liver (Fig. 6B).
Data of collagen IV deposition thickness on the hepatic capsule walls showed a mean value of 1.79 ±0.66 mm in normal rat decellularized liver bioscaffolds, 3.99 ±2.63 mm in the HCC model, and 2.83 ±1.19 mm in the HF model (Fig. 6C).
Measurement of the collagen IV deposition thickness on the blood vessel wall showed a mean value of 1.97 ±0.83 mm in normal, 3.65 ±0.42 mm in HCC and 3.35 ±1.43 mm in HF decellularized liver bioscaffolds (Fig. 6D). The results of this study showed an increase in the collagen IV deposition area, concentration, and thickness on the hepatic capsule wall and thickness on the wall of the blood vessel in the biological scaffolds resulting from decellularization of the HCC rat liver compared to the HF model and to the normal model.
The above-mentioned results showed that the HCC model and the HF model revealed a significant difference at p < 0.05 when compared with the normal model (control).
Laminin
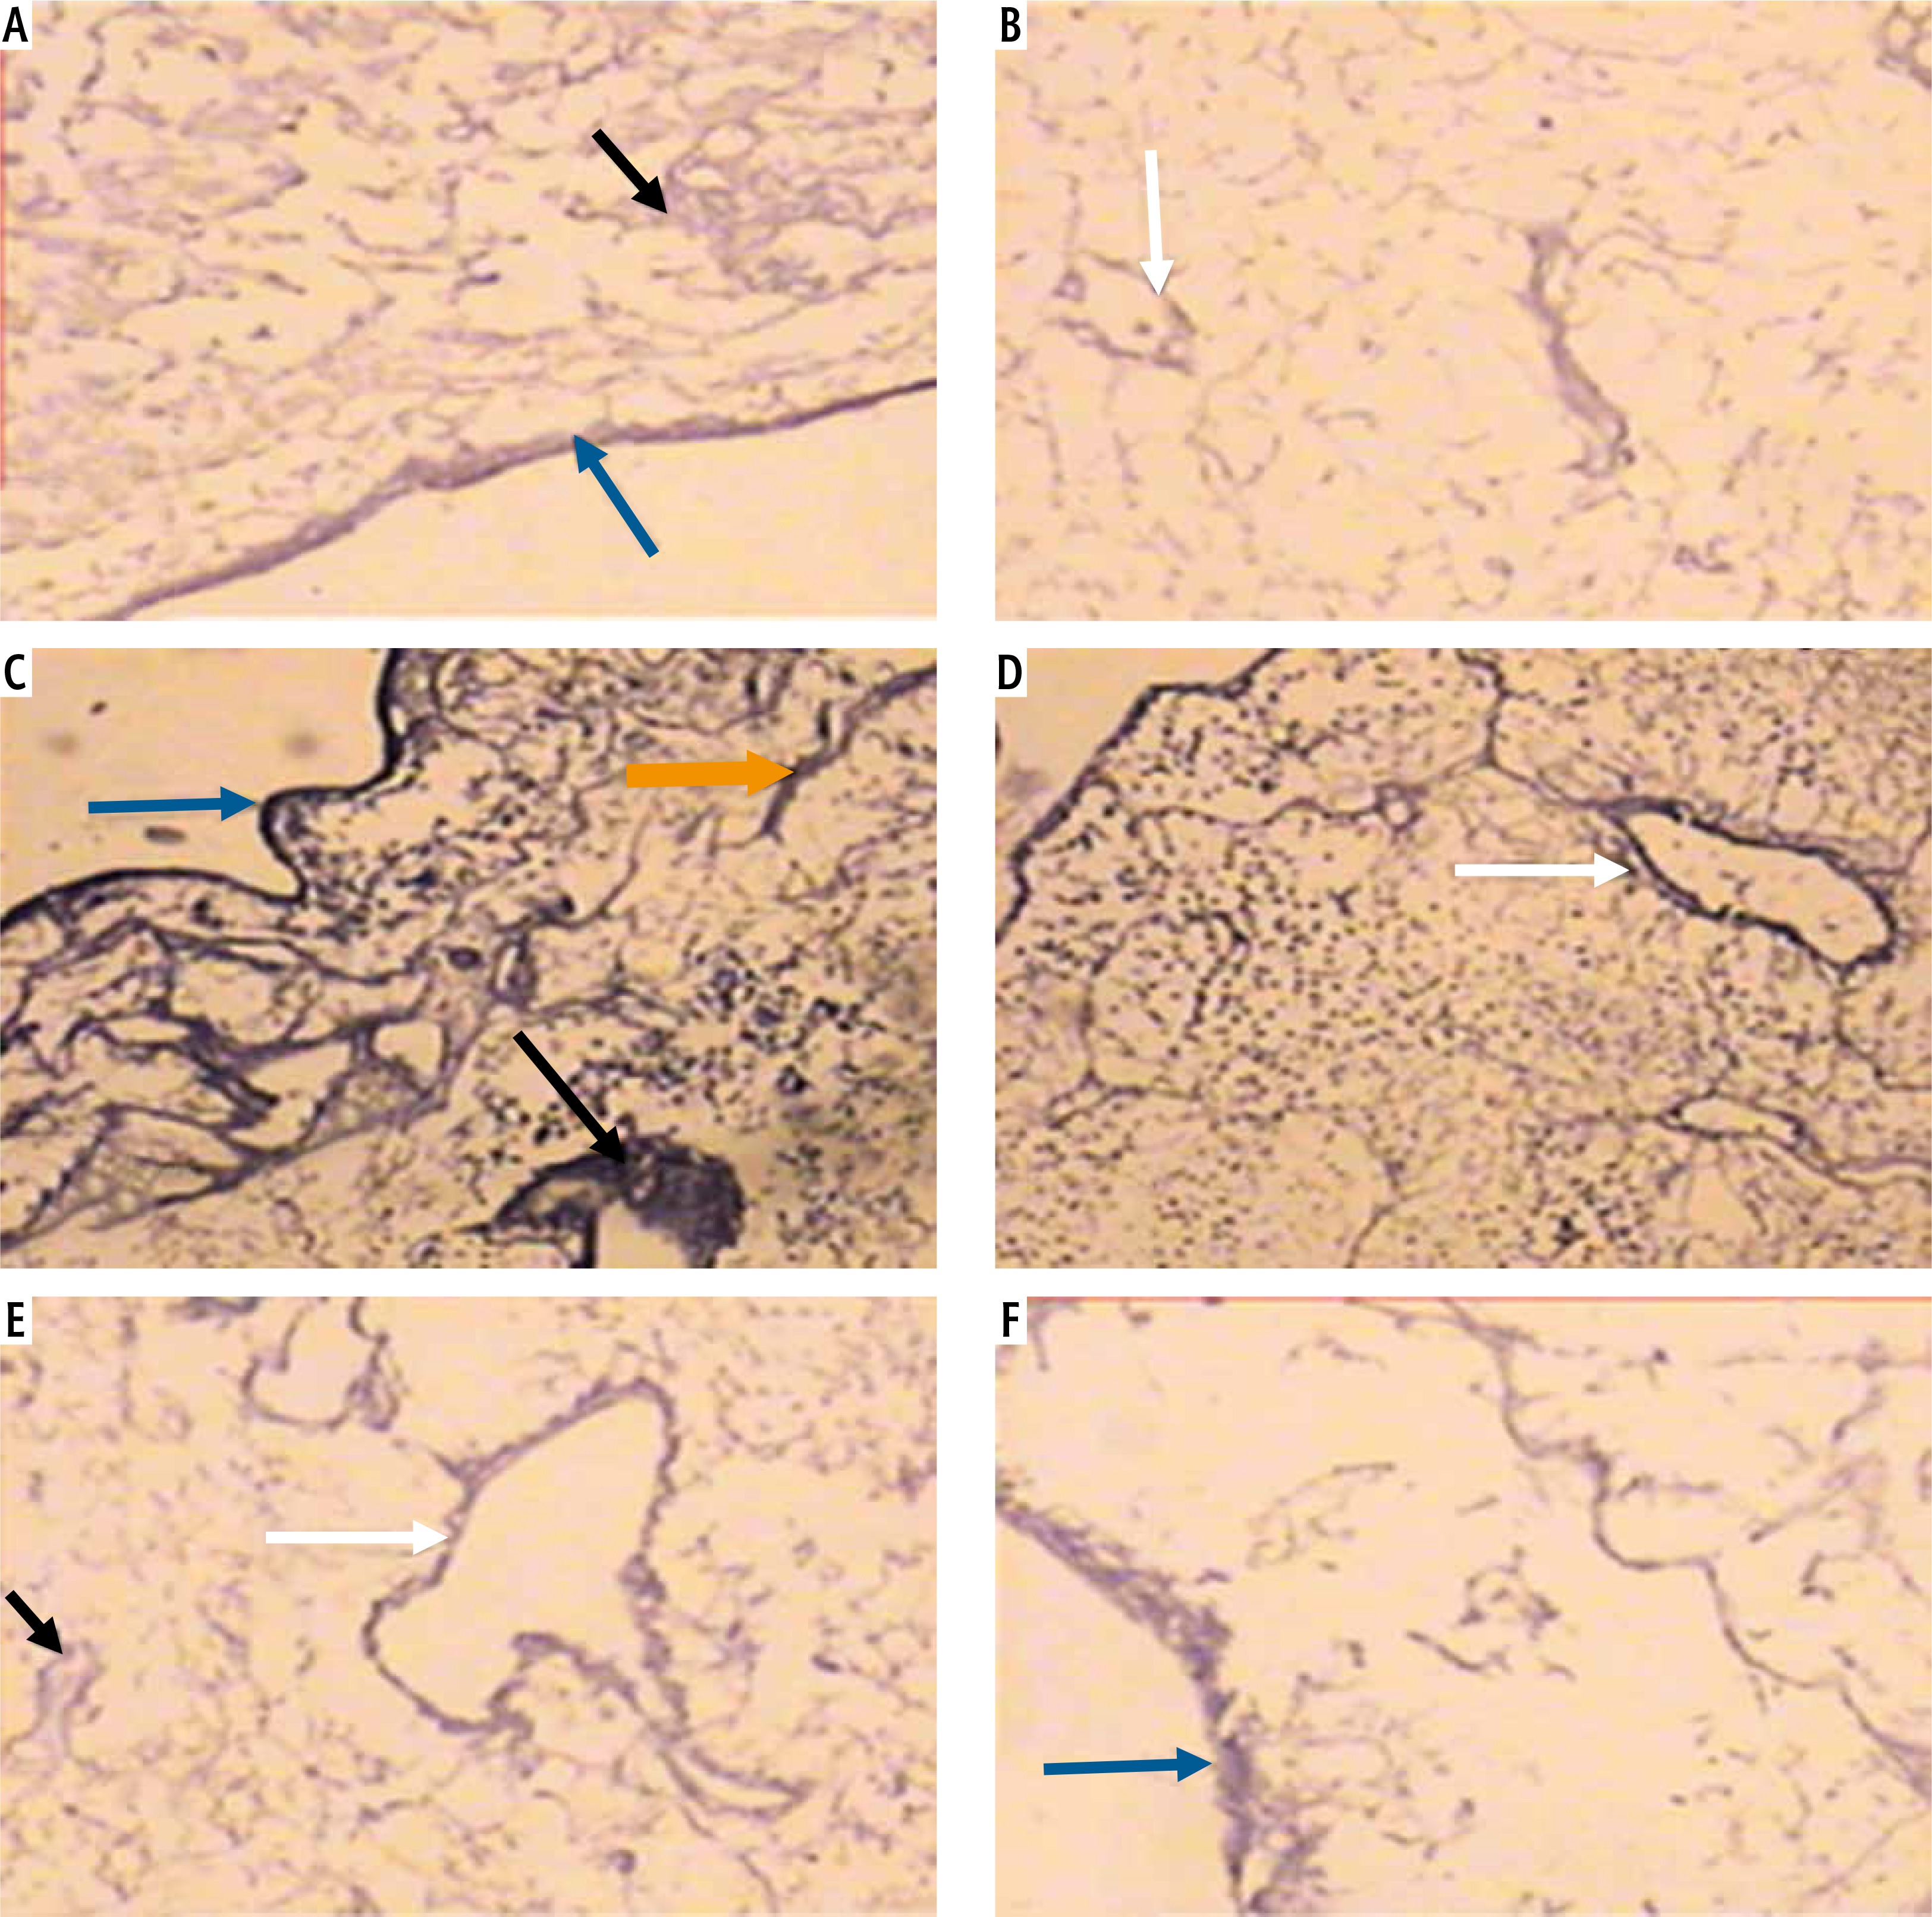
Light microscopic examination of anti-laminin immunohistochemical stained decellularized liver bioscaffold sections of normal rats showed laminin depositions distributed in the hepatic capsule, the capsular wall and the blood vessel wall (Fig. 7A, B). Decellularized liver bioscaffold sections of the HCC rat model showed dense laminin deposition in the hepatic capsule and hepatic septum but less dense deposition in the capsular wall and blood vessel wall (Fig. 7C, D). Decellularized liver bioscaffold sections of the HF rat model showed more dense laminin deposition in the hepatic capsule, blood vessel wall and hepatic capsular wall (Fig. 7E, F).
Fig. 7
Micrograph of decellularized liver bioscaffold section of (A) normal rat model showing laminin deposition distributed in the hepatic capsule (black arrow) and the capsular wall (blue arrow), B) normal rat model showing laminin deposition in the blood vessel wall (white arrow), C) HCC rat model showing more dense laminin deposition in the hepatic capsule (black arrow), hepatic septum (orange arrow) and dense deposition in the capsular wall (blue arrow), D) HCC rat model showing dense laminin deposition in the blood vessel wall (white arrow), E) HF rat model showing increased laminin deposition in the hepatic capsule (black arrow) and blood vessel wall (white arrow), and (F) HF rat model showing more dense laminin deposition in the hepatic capsular wall (blue arrow) (anti-laminin immunohistochemical stain, scale bar: 20 μm)
Measurement of the laminin depositions intensity in normal decellularized liver bioscaffolds showed a mean value of 91.48 ±2.56, while in HCC it showed a significant increase both in HCC with a mean value of 96.03 ±3.65 and in HF with a mean value of 95.36 ±4.23 (Fig. 6A).
Measurement of the laminin deposition area in examined samples showed a mean of 1307.70 ±713.52 mm2 in normal livers, with a significant increase in both HCC with a mean value 3046.67 ±903.36 mm2 and HF with a mean value of 2674.50 ±1458.84 mm2 (Fig. 6B).
Measurement of the laminin deposition thickness on the hepatic capsule wall showed a mean value of 2.39 ±0.61 mm in normal decellularized liver bioscaffolds, with increased thickness in HCC with a mean of 2.92 ±0.79 mm, and a more significant increase in HF with a mean value of 4.12 ±1.56 mm (Fig. 6C).
Measurement of the thickness of laminin depositions in the blood vessel wall showed a mean value of 2.28 ±0.94 mm in normal decellularized liver bioscaffolds, with a significant increase in both HCC with a mean value of 3.41 ±1.38 mm and HF with a mean value of 3.91 ±1.62 mm (Fig. 6D).
Laminin immunohistochemical staining showed increased area and concentration in the hepatic capsule and blood vessel wall in both HCC and HF compared to normal decellularized liver bioscaffolds samples, with a more marked increase in HF.
The above-mentioned results showed that the HCC model and the HF model revealed a significant difference at p < 0.05 when compared with the normal model (control).
Fibronectin
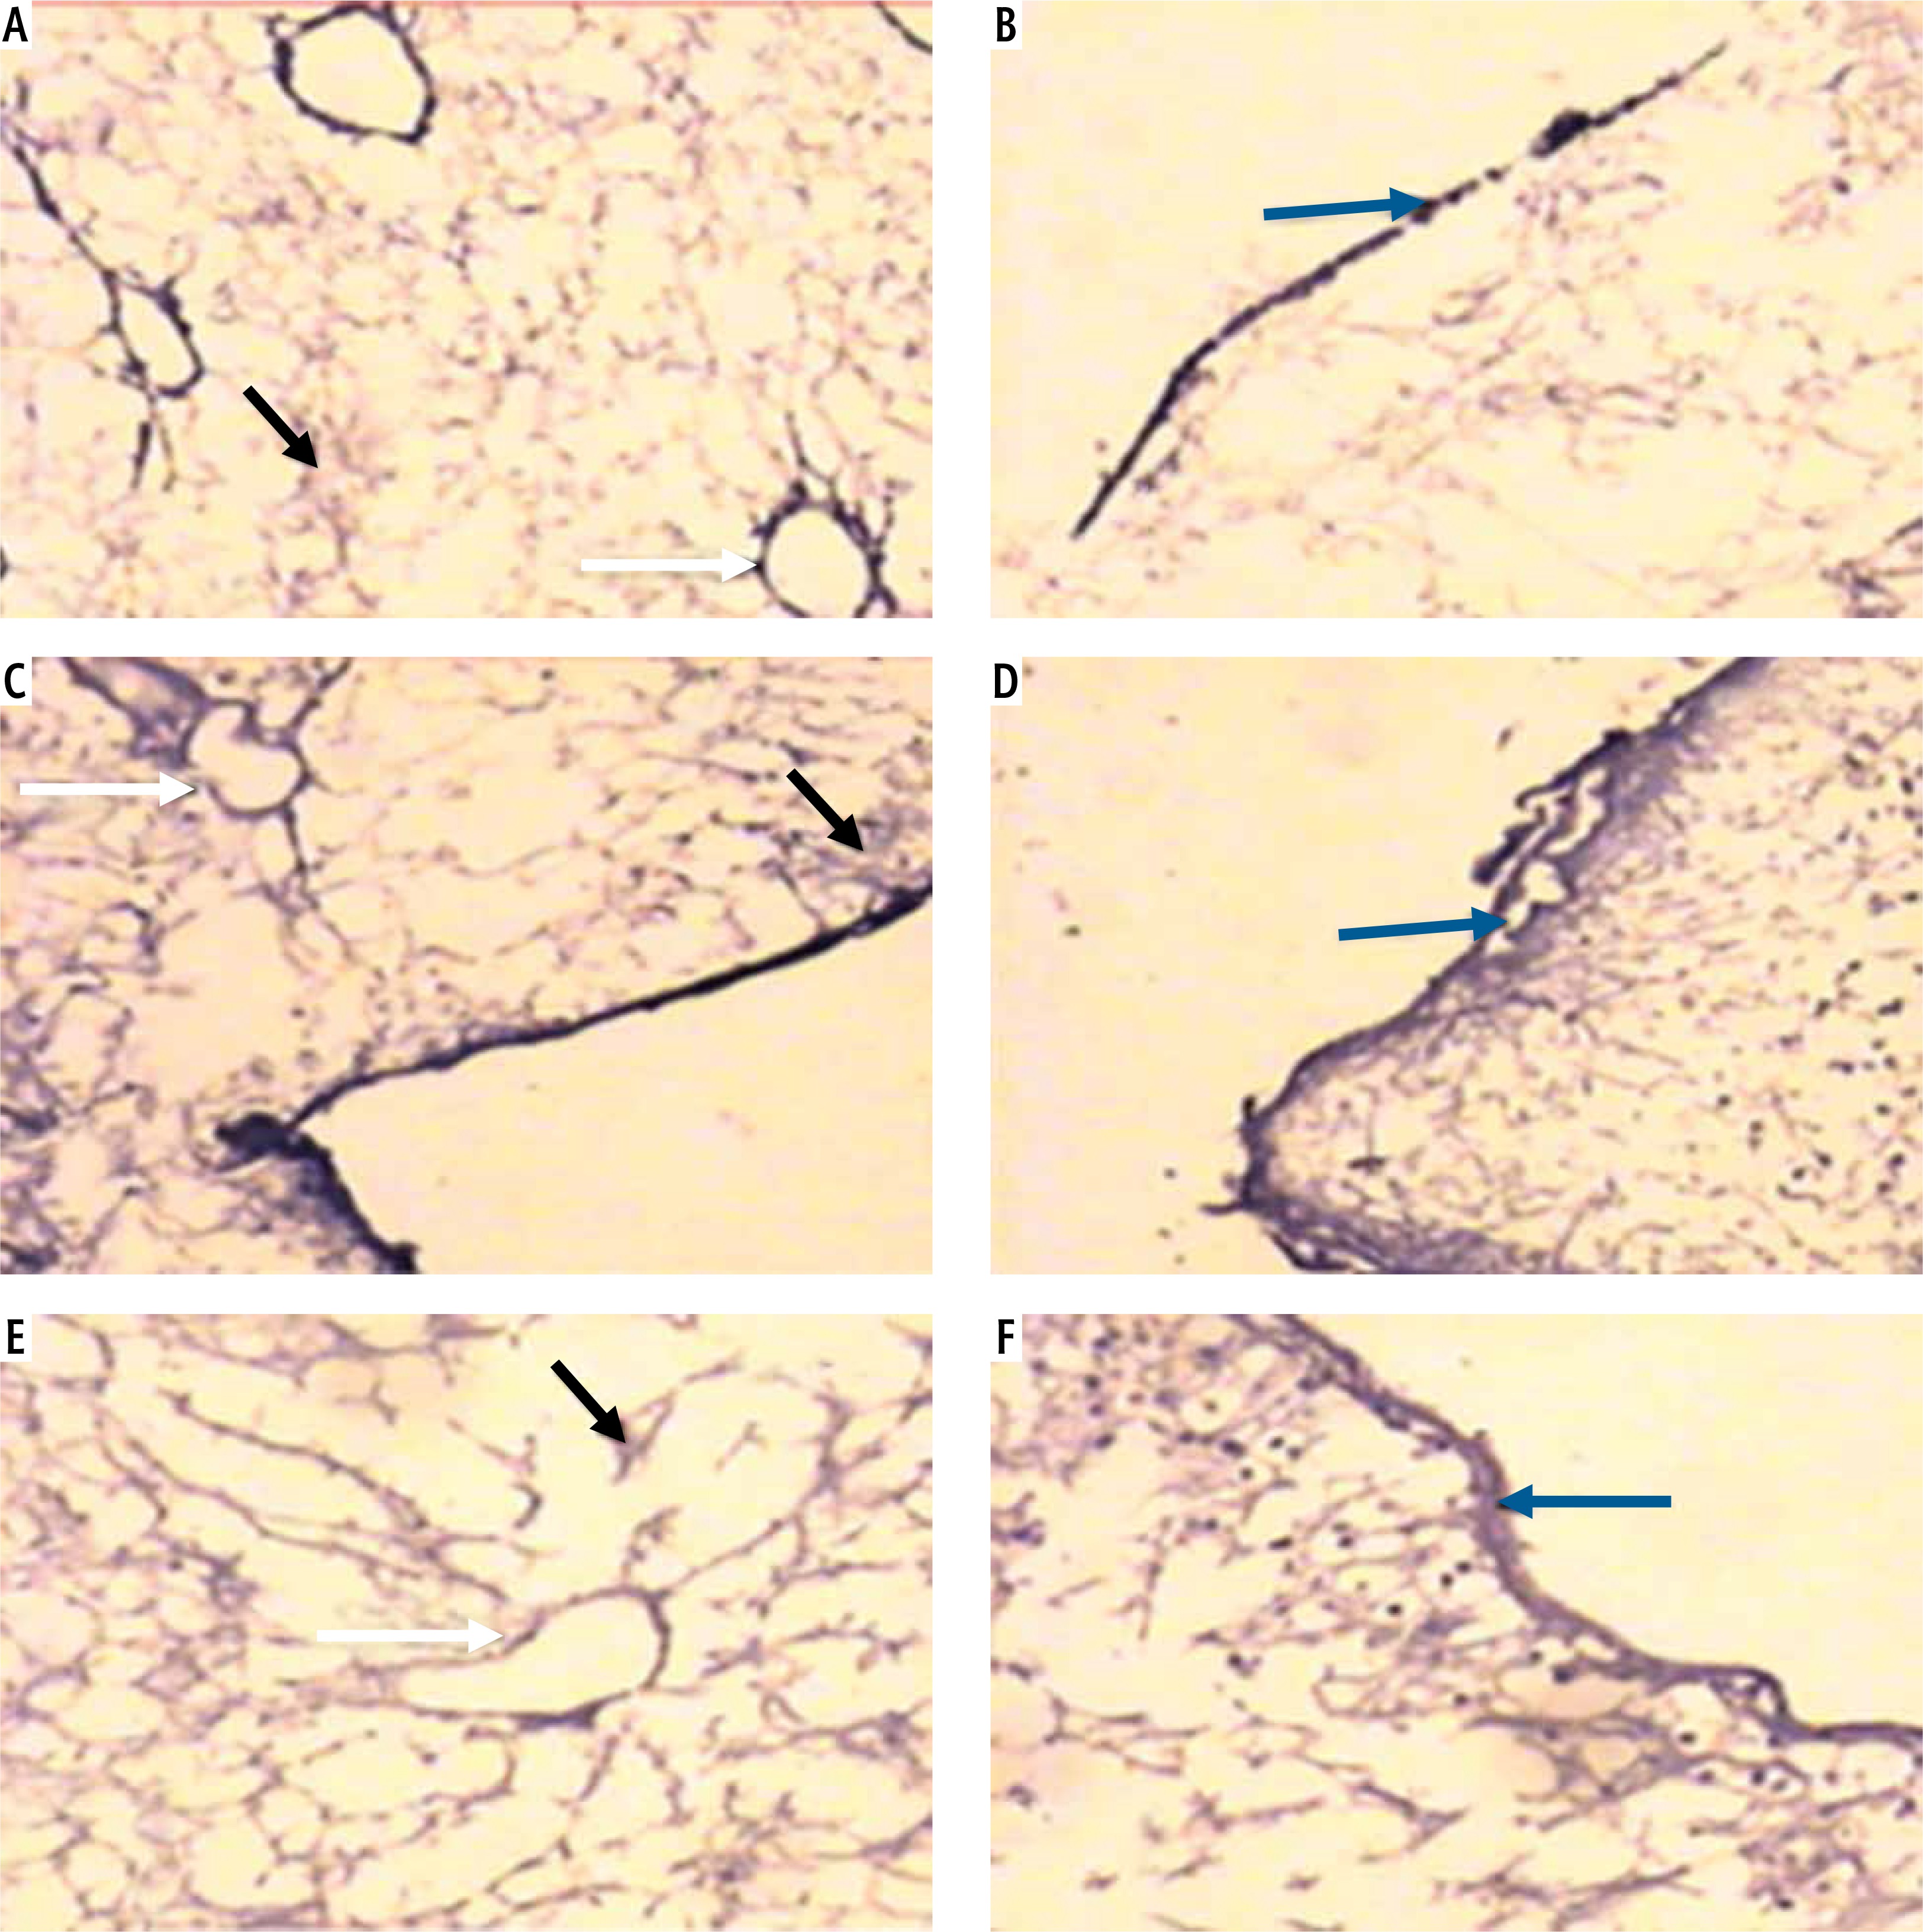
Light microscopic examination of anti-fibronectin immunohistochemical stained decellularized liver bioscaffold sections of normal rats showed fibronectin deposition distributed in the hepatic capsule, on the blood vessel wall and on the hepatic capsule wall (Fig. 8A, B). The examination of decellularized liver bioscaffold sections of the HCC rat model showed more dense fibronectin deposition distributed in the hepatic capsule, on the blood vessel wall and on the hepatic capsule wall (Fig. 8C, D). The examination of decellularized liver bioscaffold sections of the HF rat model showed dense fibronectin deposition distributed in the hepatic capsule, on the blood vessel wall and on the hepatic capsule wall (Fig. 8E, F).
Fig. 8
Micrograph of decellularized liver bioscaffold section of (A) normal rat model showing fibronectin deposition distributed in the hepatic capsule (black arrow) and the blood vessel wall (white arrow), B) normal rat model showing fibronectin deposition on the hepatic capsule wall (blue arrow), C) HCC rat model showing increased fibronectin deposition distributed in the hepatic capsule (black arrow) and the blood vessel wall (white arrow), D) HCC rat model showing increased fibronectin deposition in the hepatic capsule wall (blue arrow), E) HF rat model showing dense fibronectin deposition distributed in the hepatic capsule (black arrow) and on the blood vessel wall (white arrow), and F) HF rat model showing dense fibronectin deposition in the hepatic capsule wall (blue arrow) (antifibronectin immunohistochemical stain, scale bar: 20 μm)
Measurement of the fibronectin deposition intensity in the examined samples showed a mean value of 46.78 ±4.06 in normal liver, with significant increase in HF with a mean value of 51.88 ±4.92, and a more significant increase in HCC with a mean value of 55.40 ±4.87 (Fig. 6A).
Measurement of the fibronectin deposition area in the decellularized liver bioscaffolds of normal rat liver showed a mean value 1606.87 ±734.07 mm2. In the HCC model, there was a significant increase in the deposition area with a mean value of 2694.27 ±986.60 mm2, while HF showed an increase but less than HCC with a mean of 2539.70 ±636.08 mm2 (Fig. 6B).
Measurement of the fibronectin deposition thickness on the hepatic capsule wall showed a mean value of 1.80 ±0.62 mm in normal decellularized liver bioscaffolds, with a significant increase both in HF and HCC with a higher value in HCC; mean value in HCC was 3.85 ±0.56 mm while in HF it was 3.78 ±1.31 mm (Fig. 6C).
Measurement of the fibronectin deposition thickness in the blood vessel wall showed a mean of 1.82 ±0.61 mm in normal liver, with significant increase in HF of 2.81 ±0.89 mm and an even more significant increase in HCC of 4.05 ±1.16 mm (Fig. 6D).
The results of this study showed an increase in the fibronectin deposition intensity, area, thickness in the hepatic capsule wall and thickness on the wall of the blood vessel in the decellularized liver bioscaffolds of the HCC model, and to a lesser extent in the HF model, than that of the normal model.
The above-mentioned results showed that the HCC model and the HF model revealed a significant difference at P < 0.05 when compared with the normal model (control).
Alpha-fetoprotein
Light microscopic examination of alpha-fetoprotein immunohistochemical stained decellularized liver bioscaffold specimens showed no stained cells between the remaining cells in both normal and HF models (Fig. 9A, C), while the HCC model showed many alpha-fetoprotein stained cells (Fig. 9B). The recorded number of positive cells had a mean value of 5 ±0.99 (Table 2).
Table 2
Number of alpha-fetoprotein stained cells of the decellularized liver bioscaffolds of normal, hepatocellular carcinoma (HCC) and hepatic fibrosis (HF) rat models
| Groups | Number of alpha-fetoprotein stained cells |
|---|---|
| Normal | 0 |
| HCC | 5 ±0.99* |
| HF | 0 |
Discussion
The great discrepancy between the growing numbers of patients with end-stage liver failure and available organs for transplantation necessitate the emergence of novel therapeutic modalities. Decellularized liver bioscaffolds can expand the repertoire of donor organs to include livers with some pathologic changes, since recellularization can be done from a number of cell sources. Needless to say, this requires in-depth knowledge of the differences between the compositions of decellularized livers in the case of pathology. This study was designed to compare the differences between the two common liver pathologies HF and HCC and normal liver bioscaffolds.
It is also important to emphasize the complete removal of DNA from the bioscaffold so that the possible use of xenogenic samples can be safe and to reduce immunogenicity [18-20]. Meanwhile, the rigorous removal of cells and cellular debris should not affect the structure of the scaffold or its mechanical integrity [21]. Furthermore, decellularized scaffolds should retain important bioactive molecules and proteins facilitating normal physiologic and biochemical behaviors after transplantation [22-25].
In the present study, decellularization was performed using standard protocols described by Baptista et al. [14]. Efficiency of decellularization was determined by the estimation of residual DNA in samples. Both HF and HCC samples showed decellularization efficiency comparable to normal livers.
Hematoxylin and eosin stained biopsies from decellularized livers in the three groups showed a comparable histologic picture with no major differences.
Regarding the composition of residual tissue, we compared the intensity and distribution of collagen, laminin and fibronectin in both capsule and blood vessels as regards staining area and intensity. Collagen deposition showed the greatest area, intensity and thickness in both capsule and blood vessel staining in HCC samples, followed by HF, with normal livers having significantly lower values in both area and intensity. This is in accordance with the results of Yasui et al., who documented increased collagen deposition in HCC [26].
Laminin staining showed the greatest area and intensity in both capsule and blood vessel staining in HCC samples, followed by HF, with normal livers having significantly lower values in both area and intensity. However, the thickness of laminin deposition was greater in HF than HCC followed by normal livers in both capsule and blood vessels. This is in accordance with the findings of Torimura et al., who found an increased and altered pattern of laminin deposition in HCC biopsy specimens [27].
Fibronectin staining showed the greatest area, intensity and thickness in both capsule and blood vessel staining in HCC samples, followed by HF, with normal livers having significantly lower values in both area and intensity. The results of Liu et al. indicated that increased fibronectin expression is consistently found in cases of HF [28], while Kim et al. documented increased fibronectin expression in HCC [29].
Alphafetoprotein positive cells were found in minimal numbers only in HCC samples and were absent in both normal and HF samples.
In conclusion, HF and HCC livers could be decellularized as efficiently as normal livers. However, they show a distinct increase in extracellular matrix deposition in all studied proteins: collagen, laminin and fibronectin. The possible effect of this difference must be studied in recellularization experiments.


