
Introduction
The liver’s dual blood supply exposes it to multiple circulating pathogen-associated toxins and antigens. This exposure makes the liver an exceptional organ in immune surveillance and regulation of the inflammatory response [1]. Cirrhosis disrupts this balance between the pro-and anti-inflammatory cell milieu of the liver. This disruption can be reflected in the complete blood picture and be assessed by simple markers such as neutrophil-lymphocyte and platelet-lymphocyte ratios [2, 3]. These inflammatory indices are considered simple, readily affordable markers that have been recently used in clinical practice as predictors and prognostic markers in a number of diseases and cancers [4].
Several hypotheses have been proposed linking the cirrhosis-related inflammatory state to hepatocellular carcinoma (HCC) progression. They suggested that tumor-associated macrophages and interleukin (IL)-17 result in tumor micro-environment neutrophilia. This neutrophilia is suggested to be linked to angiogenesis and HCC progression through increased release of vascular endothelial growth factors into the circulation [5].
Another complication of liver cirrhosis is acute-on-chronic liver failure (ACLF). ACLF is found to be associated with dysfunction of innate immunity and an exaggerated pro-inflammatory state that is reflected as a systemic inflammatory response (SIR) ending in multi-organ failure in such patients [6].
Our study aimed to evaluate the diagnostic performance of neutrophil-lymphocyte ratio (NLR), platelet-lymphocyte ratio (PLR), albumin-bilirubin ratio (ABR) and albumin-bilirubin score (ALBI) in different outcomes of liver cirrhosis, including decompensated liver cirrhosis (DLC), ACLF, HCC, and spontaneous bacterial peritonitis (SBP). A second objective was to find their cut-off values. Finally, we aimed to correlate these indices with the severity of liver cirrhosis.
Material and methods
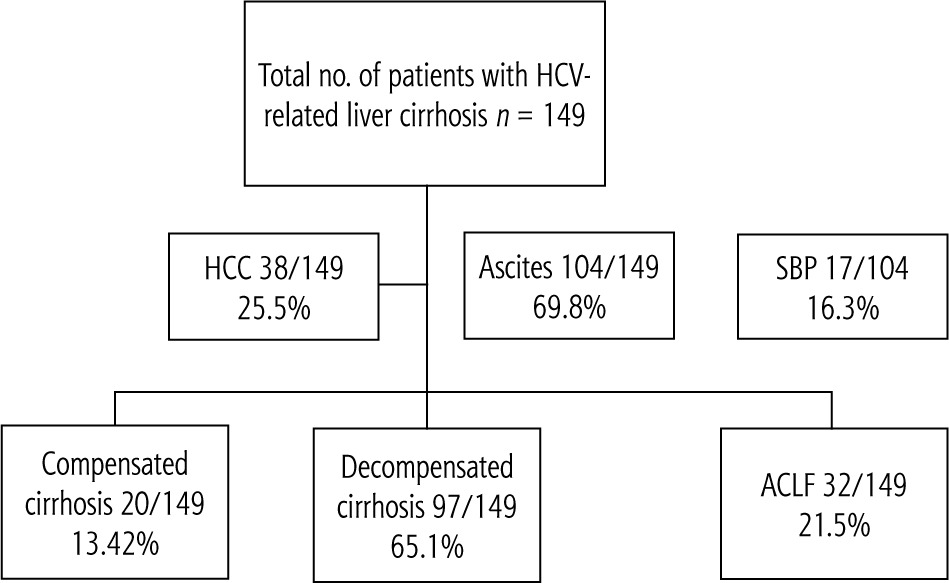
A total of 149 patients admitted to Alexandria main university hospital in the period between September and December 2020 were included in the study. Inclusion criteria included all patients with hepatitis C virus (HCV)-related liver cirrhosis aged above 18 years (Fig. 1). Exclusion criteria included hepatitis B virus (HBV) infection, human immunodeficiency virus (HIV) infection, extrahepatic malignancy, diabetes mellitus, cardiovascular disease, autoimmune diseases, and patients on immunosuppressive therapy. All patients provided written informed consent before the beginning of the study, in accordance with the principles of the Declaration of Helsinki (revision of Edinburgh, 2000).
All patients had a complete blood picture with differential white blood cell count, complete liver profile including liver enzymes, serum albumin, total, and direct bilirubin, and prothrombin activity. All patients with ascites had a diagnostic ascitic tap to diagnose SBP. SBP was diagnosed based on the presence of ≥ 250/cc polymorpho-nuclear cells or positive culture.
Abdominal ultrasound was performed in all patients to assess liver echogenicity, presence of focal liver lesion, and ascites. All patients with a proven focal lesion on ultrasound had triphasic CT to confirm the diagnosis of HCC.
Child-Turcotte-Pugh (CTP), and model of end-stage liver disease (MELD-Na) scores were calculated for all patients. We calculated the Chronic Liver Failure Consortium (CLIF-C) ACLF score for patients with chronic liver disease fulfilling the European criteria for liver failure. Neutrophil to lymphocyte, PLR, and ABR ratios were obtained for all patients. The albumin bilirubin index score (ALBI) was calculated using an online calculator.
Patients were categorized into compensated, decompensated cirrhosis (DLC), and ACLF. Decompensated cirrhosis was diagnosed based on Child-Pugh class B or C presenting with upper gastrointestinal bleeding, hepatic encephalopathy, or ascites. ACLF included patients with manifestations of acute decompensation together with organ failure (kidney, coagulation, brain, and circulatory). ACLF included any patient with acute decompensation within the prior 2 weeks. Patients were further categorized according to the presence of ascites, SBP, and HCC (Fig. 1).
Neutrophil-lymphocyte ratio, PLR, ABR, and ALBI were compared in (a) compensated vs. decompensated cirrhosis vs. ACLF, (b) SBP vs. non-SBP ascites, and (c) HCC vs. non-HCC group. NLR, PLR, ABR and ALBI were correlated with CTP and MELD scores, and their diagnostic performances in different presentations of liver cirrhosis were calculated.
Results
Statistical analysis of the data
Data were fed to the computer and analyzed using IBM SPSS software package version 20.0. (Armonk, NY: IBM Corp.). Qualitative data were described using numbers and percent. The Kolmogorov-Smirnov test was used to verify the normality of distribution. Quantitative data were described using range (minimum, and maximum), mean, standard deviation, and median. The significance of the obtained results was judged at the 5% level.
Assessment of severity of liver cirrhosis using different indices
The mean age of the included cohort was 59.47 ±8.33, and 69.1% of patients were male. There was a statistically significant difference between the three groups, compensated, DLC, and ACLF as regards CTP, and MELD-Na scores, p < 0.001. There was also a significant difference between the 3 groups as regards NLR, ALBI and ABR, p < 0.001 (Table 1).
Table 1
Comparison between the three studied groups according to different scores
All ratios showed positive correlations with MELD-Na and CTP scores, p < 0.001, except PLR, which correlated with MELD-Na score only (Table 2).
Diagnostic performance of NLR, PLR, ALBI, ABR
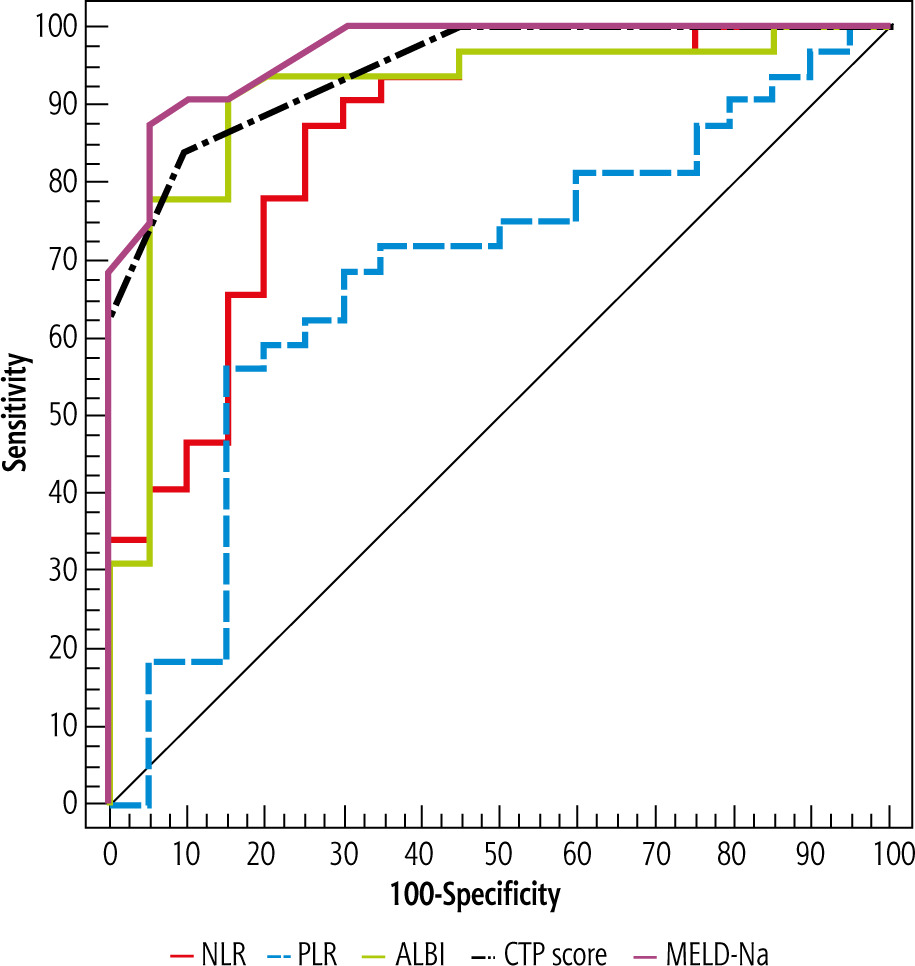
Neutrophil-lymphocyte ratio ≥ 1.94 discriminated compensated cirrhosis from DLC with 82.47% sensitivity and 90.9% predictive value (PPV), at ≥ 3.39 it discriminated compensated cirrhosis from ACLF with 87.8% sensitivity and 84.5% PPV. A cut-off value of NLR ≥ 5.26 had a negative predictive value (NPV) of 88.7% and 5.56 OR (95% CI) to discriminate ACLF from DLC (Tables 3 and 4, Figs. 2 and 3).
Table 3
Validity (AUC, sensitivity, specificity) for NLR, PLR, ALBI, CTP, MELD-Na, and ABR to discriminate the 3 groups
Table 4
Univariate logistic regression analysis for parameters affecting ALF patients (n = 32 vs. 97)
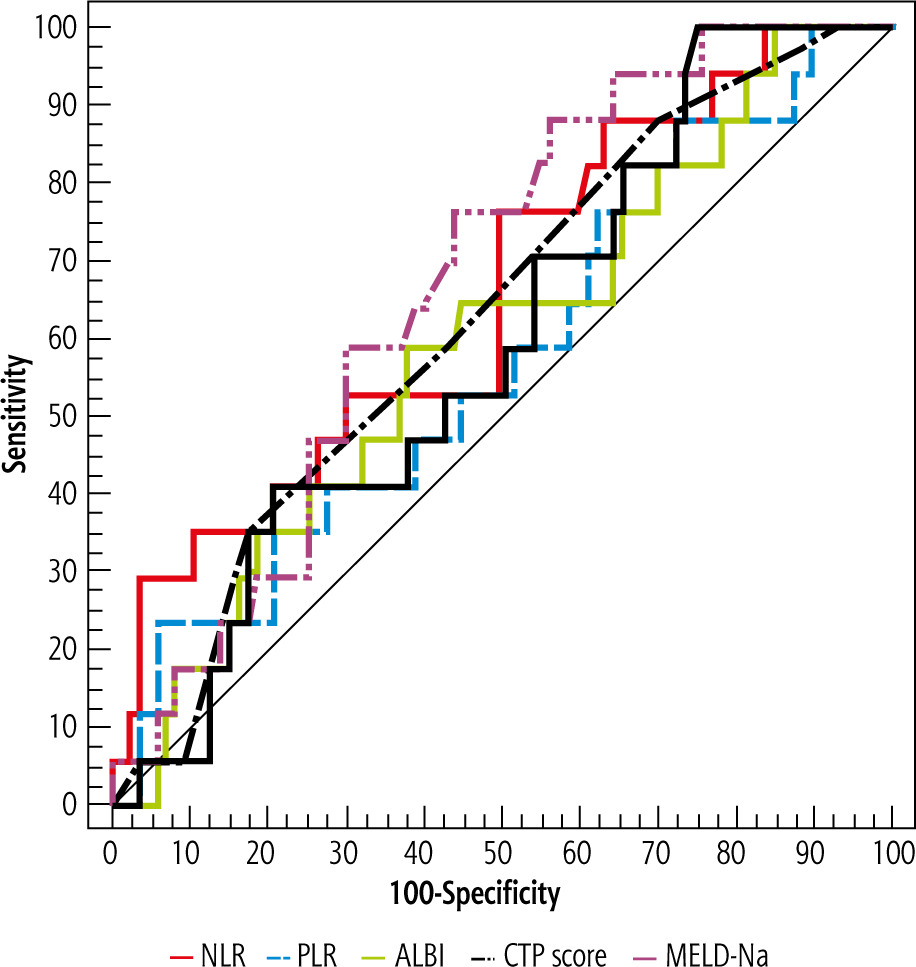
Fig. 2
ROC curve for NLR, PLR, ALBI, CTP, and MELD-Na to discriminate DLD patients (n = 97) from compensated cirrhosis patients (n = 20)
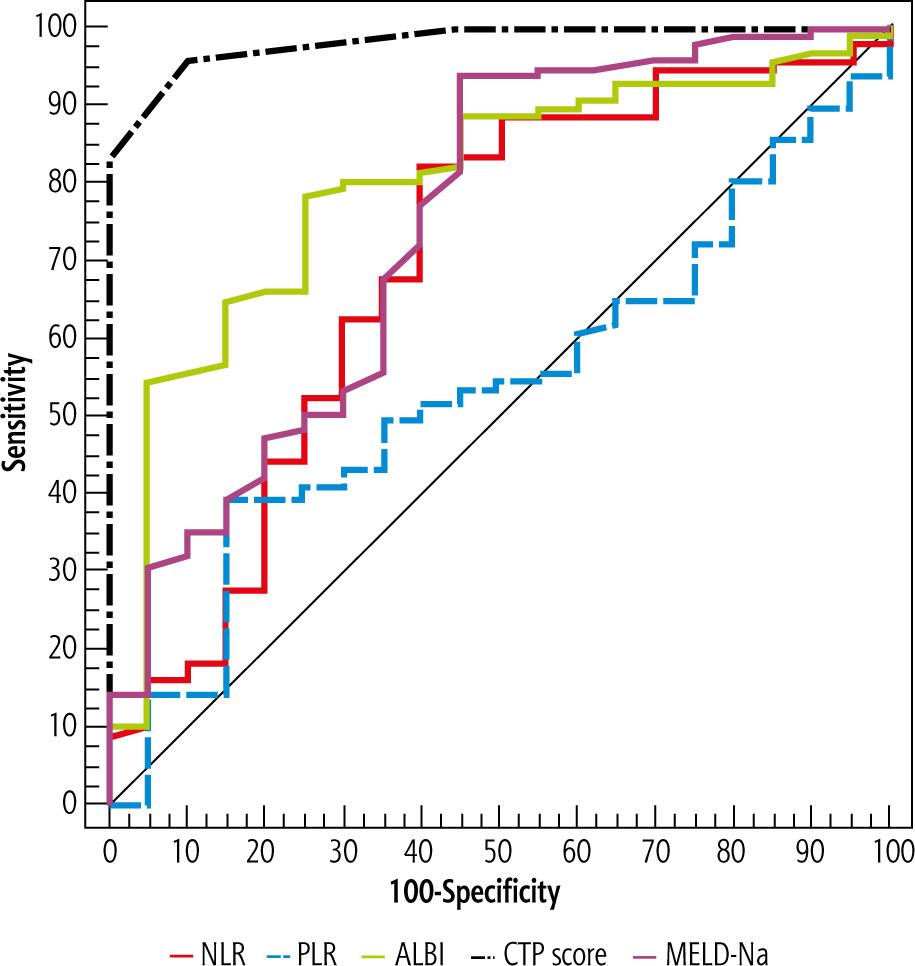
Fig. 3
ROC curve for NLR, PLR, ALB, CTP, and MELD-Na to discriminate ACLF patients (n = 32) from compensated cirrhosis patients (n = 20)
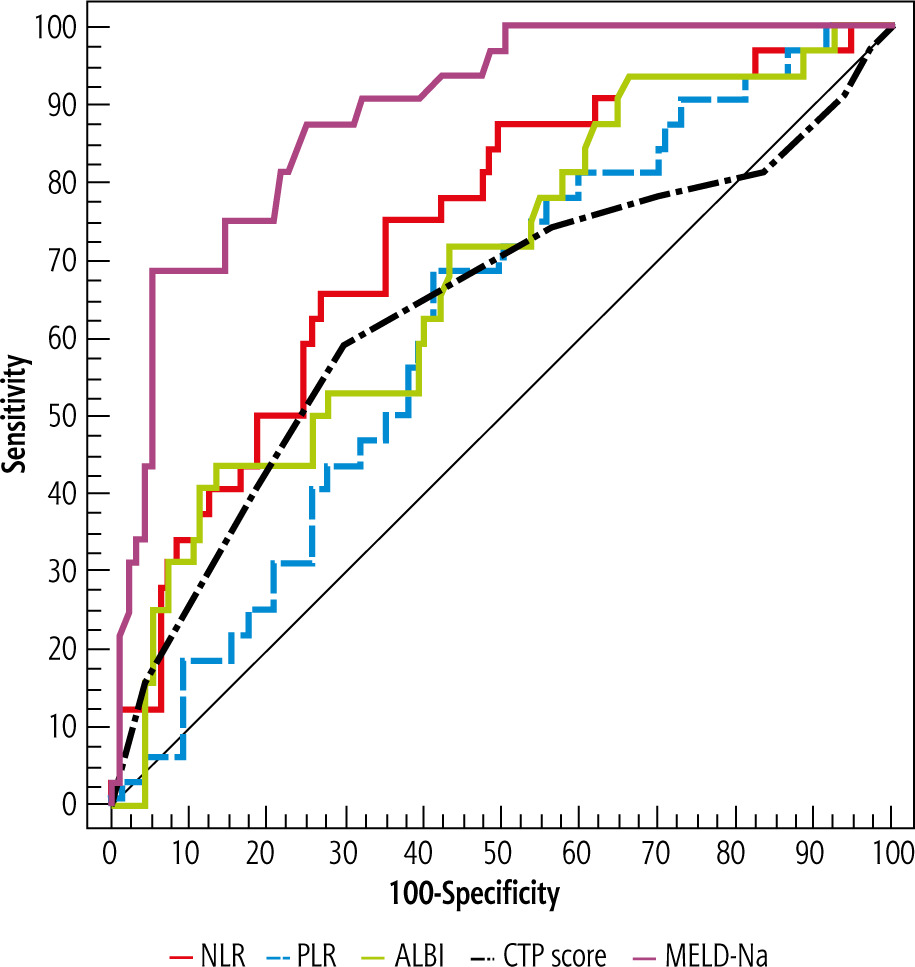
Simple ABR (≥ 0.94) was superior to ALBI score (≥ –0.31) in discriminating ACLF from DLC, NPV was 82.4% vs. 77.8% respectively (Table 3, Fig. 4).
Diagnostic perfirmance of indices in SBP
Neutrophil-lymphocyte ratio was higher in the SBP group with p = 0.022, while PLR, ABR and, ALBI did not show any significant difference between SBP and non-SBP. At cut-off value ≥ 3.61, NLR had 91.7% PPV and OR (95% CI) = 3.33. There was a significant difference between the 2 groups regarding CTP, and MELD-Na scores, p = 0.014 and 0.028 respectively. NLR > 3.61, had OR 3.33 at 95% CI while, MELD-Na > 19.5 had OR of 4.191 at 95% CI (Tables 5-7, Fig. 5).
Table 5
Comparison between studied groups according to different scores
Table 6
Validity (AUC, sensitivity, specificity) for NLR, PLR, ALBI, CTP, MELD-NA and ABR to discriminate SBP patients (n = 17 vs. 87)
Diagnostic perfirmance of indices in HCC
There was no significant difference between HCC and non HCC groups regarding NLR, PLR, and ALBI, ABR, CTP, and MELD-Na scores, p-value 0.083, 0.155, 0.607, 0.876, and 0.838 respectively (Table 5).
Discussion
Categorization of the severity of liver cirrhosis and its related complications is vital for prediction of prognosis and tailoring the proper management for each patient. Simple rapid diagnostic tools can be used in association with established scoring systems for rapid assessment of severity of liver cirrhosis.
Advanced liver cirrhosis is assumed to be linked to an exaggerated inflammatory response in the absence of infection. This is hypothesized to be related to amplified bacterial translocation as evidenced by circulating bacterial DNA, endotoxins, and inflammatory cytokines in patients with cirrhosis [7]. This exaggerated systemic inflammatory response is mirrored in the complete blood picture [8]. Several studies with contradictory results have also studied the link between bacterial translocation and sarcopenia with its deleterious effect in cirrhotic patients [9, 10].
Neutrophil-lymphocyte ratio and PLR are readily available, simple and affordable inflammatory markers. They are used in clinical practice as both prognostic markers in a number of cancers as well as markers of systemic inflammation. Therefore, they could be used to expect some diseases or predict complications in diseases [4]. Consequently, NLR and PLR can be used to aid in the categorization of liver cirrhosis according to disease severity as well as identifying some of the cirrhosis-related complications. ALBI is another simple objective validated grading system that can be used to assess liver function omitting the subjective parameters of CTP [11].
The aim of our study was to use the simple inflammatory indices NLR and PLR together with ALBI and ABR to assess the severity of liver cirrhosis and related complications. Another objective was to calculate cut-off values of these indices.
NLR level positively correlated with the severity of liver cirrhosis. It showed a positive correlation with both CTP (p < 0.012) and MELD-Na (p < 0.001) scores. The cut-off value of NLR was higher in DLC and ACLF when compared to CLC, ≥ 1.94 and ≥ 3.94 respectively. ACLF was discriminated from DLC at a cut-off value ≥ 5.26, and OR 5.56 at 95% CI. Our findings matched the results published by Leithead et al. [7], and Moreau et al. [12] results that demonstrated a positive correlation between NLR, MELD score, and severity of ACLF. Similar results were also reported by Moreau et al. [13; the study reported higher NLR in ACLF than DLC, and correlated with 90-day mortality in ICU admitted patients]. In contrast to our results, Moreau et al. [13] found that NLR did not correlate with the MELD score in patients with ACLF, suggesting that infection as a precipitating factor may be contributing to the raised NLR.
Furthermore, the cut-off value of NLR was found higher in SBP = 6.27 vs. 4 in non-SBP ascites, p < 0.022. The OR at 95% CI to diagnose SBP was 3.33. On the other hand, NLR did not show any statistical significance in the HCC group, p = 0.83.
Both ABR and ALBI showed a positive correlation with the severity of liver cirrhosis as assessed by CTP and MELD-Na scores, p < 0.001. Their levels were lowest in ACLF as compared to DLC, and compensated cirrhosis, p < 0.001. This could be explained by the preserved secretory and synthetic function of the liver in cases with compensated cirrhosis when compared to DLC. A study by Lei et al. carried on HBV related cirrhosis showed that ALBI score correlated with the severity of cirrhosis as assessed by CTP and MELD scores [14].
Although PLR correlated with each of the CTP and MELD-Na scores, p < 0.001, it did not show a statistically significant difference between the studied groups of patients, p = 0.069. PLR did not show any difference between HCC and non-HCC groups, p = 0.433, or between SBP and non-SBP groups, p = 0.336.
The limitation of our study is the lack of prognostic performance of these markers, which can be assessed in future research work. Also, the trends of levels of these scores could be combined with other inflammatory cytokines to study the role of inflammation in the pathogenesis of liver cirrhosis-related complications in the absence of infection. Another limitation is the absence of assessment of sarcopenia in our patients. We did not do computed topography at L3 to measure muscle mass and we could not rely on body mass index as 69% of the patients had ascites.
In conclusion, the simple inflammatory scores NLR and PLR together with simple ABR and ALBI scores can be used as quick tools to assess liver cirrhosis severity. NLR ≥ 6.27 can be used to predict SBP in patients with ascites. NLR cut-off value ≥ 3.61 and ≥ 5.26 can be used used to predict DLC and ACLF respectively in liver cirrhosis.


