
Summary
In the paper, we present the method for diffusion tensor imaging (DTI) of the human heart in vivo based on the commonly available spin-echo echo-planar imaging (SE-EPI) sequence. We show the possibility to non-invasively detect infarct zones with different severity corresponding to T1-weighted images with late gadolinium enhancement (LGE). By application of the B-matrix spatial distribution (BSD) calibration method it was possible to quantitatively analyze DTI metrics and approach the values reported for the myocardium.
Introduction
Diffusion-weighted magnetic resonance imaging (dMRI) provides unique information on the structure, organization and integrity of tissue without the need for exogenous contrast agents. In clinical medicine dMRI is widely used in static tissue imaging (such as the brain) to diagnose injury not visible with other techniques and thus to guide clinical decision-making. However, dMRI of the heart, in comparison to the brain, has proven to be technically challenging [1]; dMRI images of the heart applicable in routine clinical management have not yet been systematically obtained. One fundamental difference between the heart and the brain is deformation and displacement of the myocardium during the cardiac cycle. Another challenge arises from the significantly shorter transverse relaxation time of the myocardium, T2 (~40 ms in the myocardium at 3 T, which is approximately half of the brain white matter value). This results in a low signal-to-noise ratio (SNR) and leads to echo time (TE) shortening. Besides the short T2 values, dMRI of the myocardium in vivo is also restricted by the main magnetic field inhomogeneity within the thorax, which results in more susceptibility-related distortions in echo planar imaging (EPI) of the heart [2].
Recently developed B-matrix spatial distribution (BSD) in dMRI may enable minimization of systematic errors due to an inhomogeneous gradient field [3]. BSD is a calibration technique which delivers the actual distribution of the B-matrix in space. It has been suggested that taking into account the spatial variability of the B-matrix may improve the accuracy of diffusion tensor imaging (DTI) [3–5]. Recent data indicate that changes in the diffusivity of water in myocardium correlate with areas of risk [2]. Another important advantage of advancing dMRI imaging of the human heart arises from the fact that DWI and DTI can potentially be applied instead of imaging with the application of gadolinium-based contrast agents [6]. Furthermore, DTI description of the diffusion signal may depict changes in the local cardiac myofiber orientation, a fundamental aspect of cardiac function [7].
Aim
The aim of our study was to apply DTI for the human heart in vivo using the spin echo-echo planar imaging (SE-EPI) pulse sequence. SE-EPI was possible by manipulating essential acquisition parameters, including TE, repetition time (TR) and ECG trigger delay. Furthermore, BSD calibration was performed using in-house developed software that was used for image analysis. Then, pilot evaluation of the applicability of the method developed to obtain dMRI myocardial images was performed in a series of healthy volunteers and patients with acute myocardial infarction (AMI). The method and patients’ condition were additionally evaluated based on the follow-up examination.
Material and methods
Model of the heart
The orientation of the heart obeys specific semantics, where three planes are defined: the short axis view, the 2-chamber and the 4-chamber views (also called vertical and horizontal long axis views, respectively). The heart can be divided into three sections along its long axis – basal, mid and apical cavity. In the short axis view, the left ventricle wall can be divided into six segments according to the 17 AHA segment model [8].
At the anatomical level, the heart is a muscular organ acting as a mechanical pump. The cardiomyocytes are tightly coupled within the same laminar sheet, but sparsely coupled between adjacent laminar sheets. This structure makes the cardiac muscle an orthotropic tissue. Due to its anisotropy, the spatial variation of the fiber and laminar sheet orientations in the myocardium plays an important role in the realization of the cardiac function [9].
Study subjects
Clinical and dMRI imaging data were obtained in a group of 6 healthy subjects and 12 consecutive patients with a large [10] anterior AMI. The patients were treated according to current guidelines, including state-of-the-art interventional (primary PCI, pPCI, of the infarct-related artery, IRA) and pharmacologic therapy [11]. Care was taken to apply the existing measures to minimize myocardial tissue injury associated with ischemia and reperfusion, including, when applicable, thrombus aspiration [11–14]. In the AMI patients conventional MRI imaging was also performed to enable comparisons between DWI and conventional (late gadolinium-enhanced, LGE) images (for methods see ref. [10]). MRI was conducted several days after pPCI (first examination, hereinafter called E1) and 6 months later in the follow-up (second examination, hereinafter called E2). Research work and imaging were performed within the CIRCULATE Project of the National Centre for Research and Development (Poland) – STRATEGMED2. The study was approved by the Ethical Committee and all subjects provided written consent to participate.
In vivo cardiac DTI acquisition
Cardiac DTI was performed on a 3 T clinical MR scanner (Siemens MAGNETOM Skyra) equipped with an anterior cardiac 18-element matrix coil and a standard 45 mT/m gradient set with a slew rate of 200 T/m/s. All sequences were ECG-triggered. ECG trigger delay was acquired depending on the individual heart rate. Initially, the delay was set to be a half of an RR interval and then it was increased or decreased depending on the quality of a registered signal. Our pilot analysis showed that control of the signal quality in each slice was fundamental. DWIs were acquired during a single breath hold. DTI acquisitions were planned for the short axis view of the heart and 4 parallel slices were acquired along the long axis of the left ventricle.
Imaging was performed using a multi-shot SE-EPI readout (64 echoes per shot). Our pilot work on manipulating acquisition parameters to obtain highest-quality cardiac DWI led to the following protocol: TE = 64 (patient)/47 (control) ms, TR = 850 ms, field of view, FOV = 249 × 319 mm2, voxel size: 0.83 × 0.83 × 8 (patient)/1.22 × 1.22 × 8 (control) mm3, bandwidth, BW = 1630 Hz/Px, number of DW directions, N = 6, b-value, b = 350 s/mm2, 1 scan. Modulation of these parameters was then used for imaging in study subjects.
Results and discussion
The present study enrolled 6 healthy volunteers and 12 consecutive patients with anterior AMI. Demographic and clinical data of study subjects are shown in Table I. Cardiac DWI imaging according to our algorithm was performed in all 18 cases, and consistent image patterns were obtained for (i) the healthy heart and (ii) the infarcted heart. Typical raw data are shown in Figure 1; average diffusivity values (± standard deviation lines) are displayed in Figure 2.
Table I
Clinical characteristics of healthy controls and study patients that provided initial clinical data from the AMI trial
Figure 1
Typical examples of diffusion-weighted images of the human heart in vivo using the methodology we have developed. Images are from a patient (PATIENT) with acute anterior myocardial infarction (day 6 after pPCI) and from a healthy control (CONTROL). A – Raw multi-directional DWI images used for diffusion tensor calculation; B – use of an increased image contrast to enhance visualization of the hyperintense spots (infarct area according to classic gadolinium imaging). In (A) and (B) from top to bottom – diffusion-weighted images for b = 0 s×mm–2 (DWI 0) and six DWIs (DWI 1-6; from top to bottom) obtained for different non-collinear directions (hot color scale, left side, and gray scale, right side of each panel) (A). Images obtained using an increasing gradient of auto-contrasting (from top to bottom) (B). Typical T1-weighted images with late gadolinium enhancement of the same patient heart (infarct areas indicated by white arrows; reference images). C, D – White arrows indicate infarct areas, blue arrowheads indicate vascular scaffold and fatty signal, while white arrowheads indicate microvascular obstruction zone. Note: (i) feasibility to obtain the human heart DWI images using the algorithm that we have developed, and (ii) increased DWI signal intensity in the infarcted areas, particularly visible on image contrast enhancement (B), allowing one to achieve improved visualization that is independent of the DWI direction and may be useful clinically, particularly as subtle damage areas are identified that are only in part amenable to conventional gadolinium contrast-based cardiac MRI imaging (see text for details)
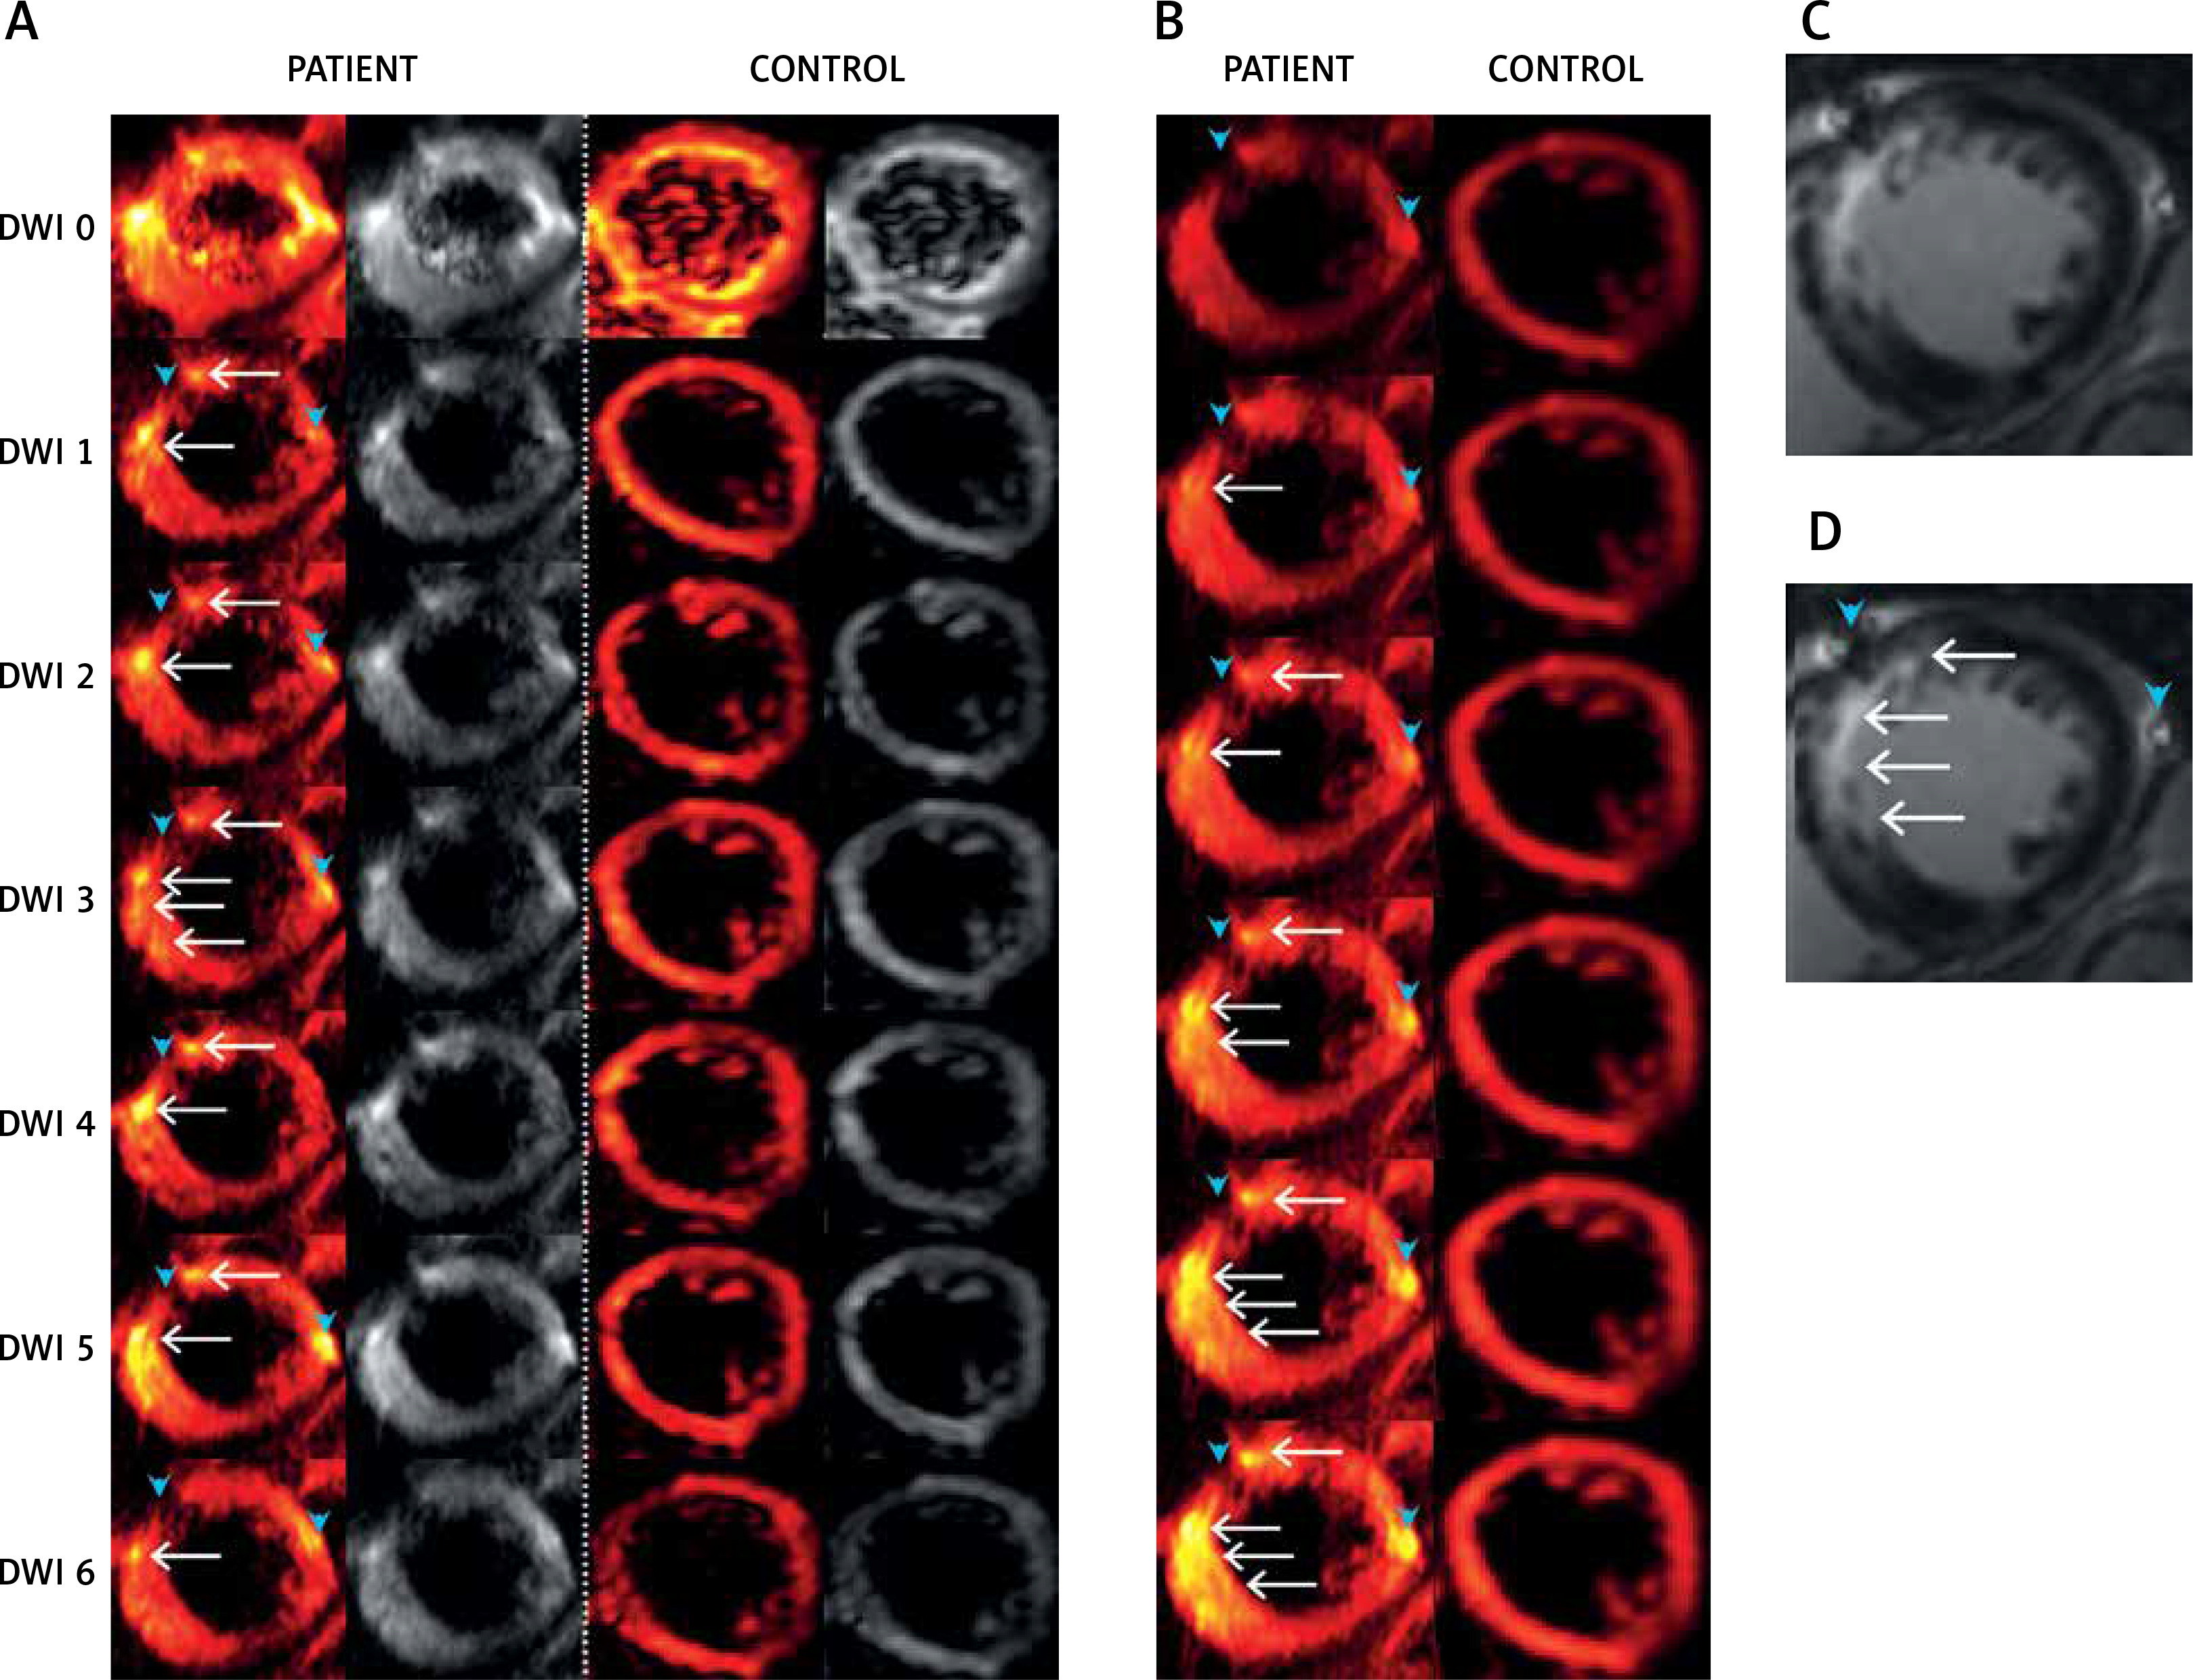
Figure 2
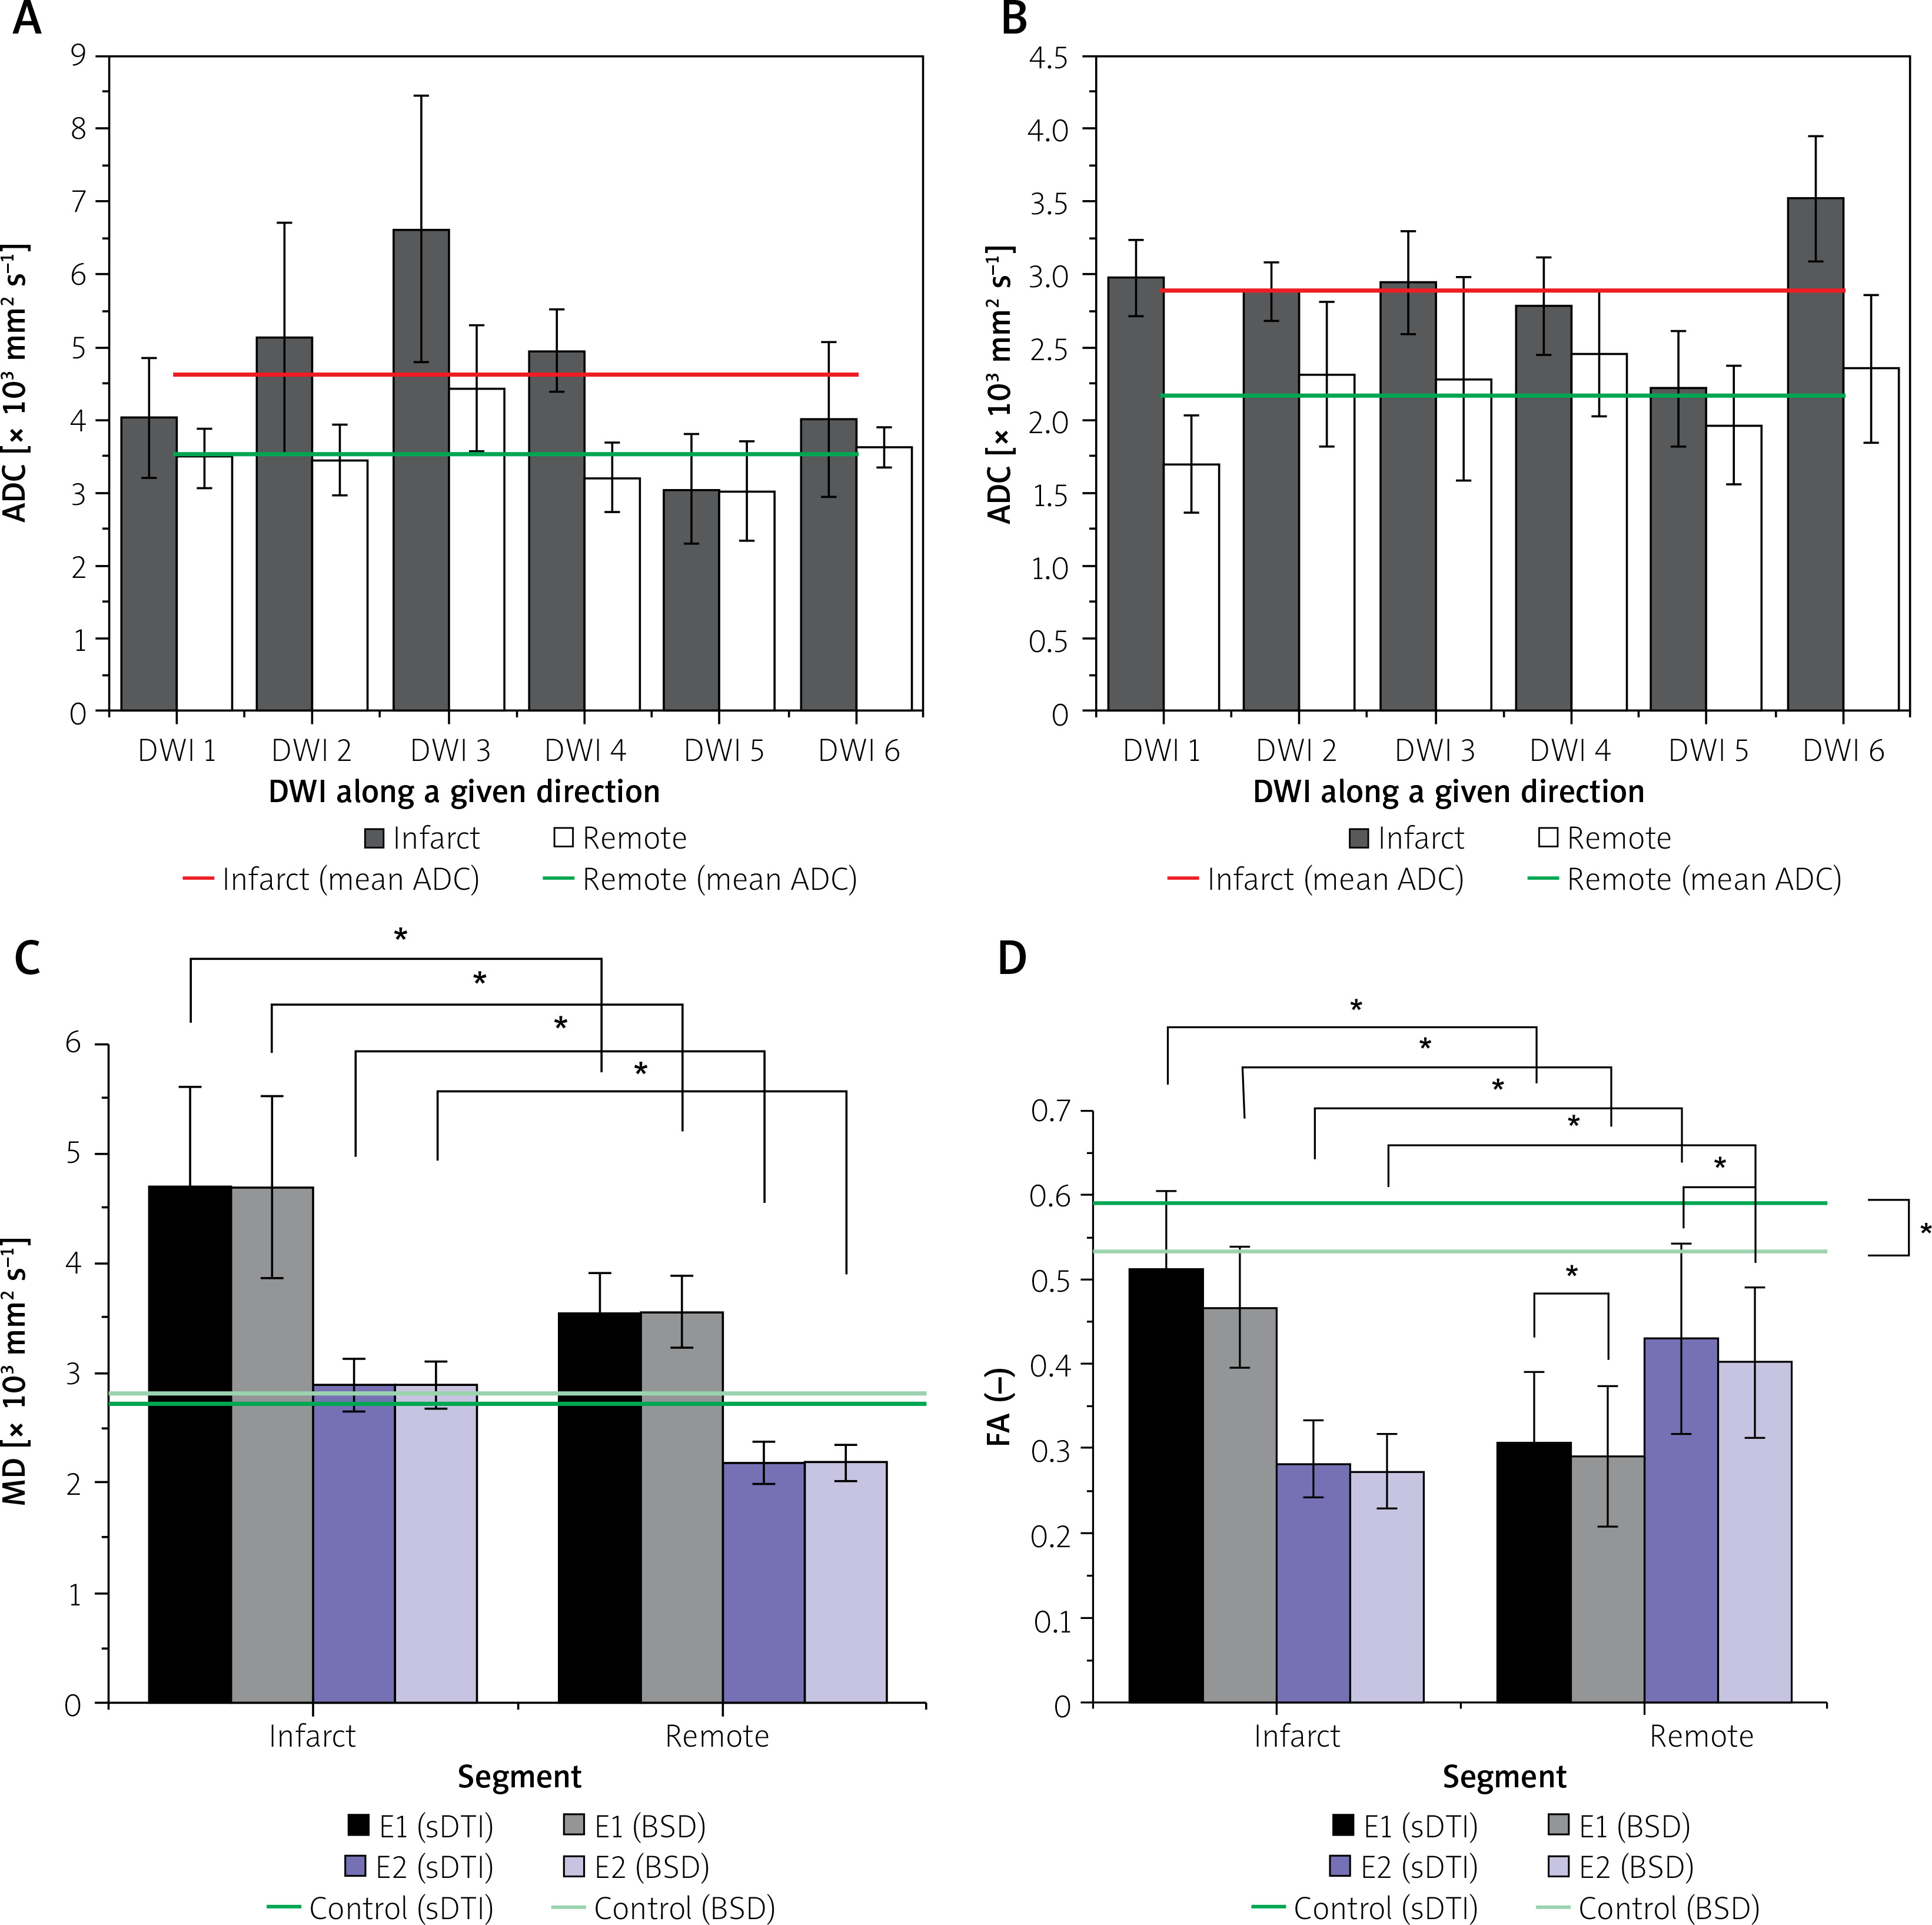
Average values (plotted with standard deviations) of the obtained DTI parameters: apparent diffusion coefficients (ADCs) for each of the non-collinear directions of DWI signal acquisition modes (DWI 1-6) according to our algorithm in infarct segment A2 and in remote tissue in E1 – 6 days after pPCI (A) and in the follow-up examination E2 (B). Mean diffusivity (MD) is shown in (C), whereas (D) shows fractional anisotropy (FA). In the plots statistically significant differences are designated (with 0.05 significance level)
Our application of an SE-EPI sequence with cardiac gating allowed registration of a reasonable signal coming from the heart muscle (Figure 1). With our algorithm, this was achieved despite the reduced number of scans, lower b-value and increased resolution with lower attainable TE in comparison to the previous attempts [2, 10–17]. Considerably shorter TE in cardiac DTI can be indeed found in the literature, but for the stimulated-echo (STE) based sequences, which enable dMRI with the same b-value, but lower SNR [18]. However, due to lower SNR, STE is usually applied with multiple scans. This, for a moving object like the heart, can lead to erroneous averaging. MD and different tensor metrics can also be more accurately determined by using SE sequences [16]. We hypothesize, similarly to Mekkaoui et al. [2], that in the near future a major move from STE to SE-based imaging will occur in cardiac DTI. This move is anticipated to be facilitated by the increasing availability of clinical scanning at higher magnetic field gradients [2].
Our work indicates that the A1 and A2 segments may be highly discernible on DW images obtained according to our algorithm. This is particularly relevant for the myocardial infarction zone in these segments (note DWI signal hyperintensity in Figure 1 A, DWI 1-6, white arrows). No hyperintense spots were visible for the healthy control.
There were some important features in the DWI images, interesting for dMRI of AMI patients. Patient had an implanted stent (Figures 1 A, B, D, blue arrowhead on the left), which in DWI images is visible as a diffusion signal loss. Moreover, adjacent fatty accumulation (Figures 2, B, D blue arrowhead on the right) caused an effect similar to the infarction. Therefore, referential MRI (e.g. T1 , T2 ) or additional clinical data are required for a proper interpretation of dMRI. Multi-shot SE-EPI with our algorithm enabled the application of a high resolution, which greatly helped to capture the details of the infarction areas – strong hyperintense spot, uniform across the myocardial wall. As shown by Mazur et al. [1], using the same algorithm for the patient shortly after the myocardial infarction incident it was also possible to distinguish a hypointense area reflecting microvascular obstruction between hyperintense strand-like areas associated with infarction [1]. This shows that with a carefully chosen SE-EPI DTI sequence protocol, details of the damaged zones can be almost as visible as in LGE images (Figures 1 C, D).
Figure 1 B shows the method for distinguishing damaged myocardial zones. We propose to average all DWIs (from Figure 1 A), rescale all subjects to the same intensity range to enable inter-patient comparison and then increase the contrast by changing the display range. In this way, consecutive display shows more hyperintense spots, while the most severe damage appears first and the most benign last (Figure 2 B from top to bottom images). This is an important area for further research as DWI of the heart might depict areas with subtle damage that may be particularly amenable to myocardial reparation and regeneration using cell-based and other agents [10, 19]. In contrast, the post-infarction scar (classically viewed as “irreversible” injury that may be less amenable to cellular reparation in absence of simultaneous scaffold use [19, 20]) might be better distinguished using typical contrast-enhanced MRI imaging (cf., Figure 1 B). Our findings are consistent with the concept that cardiac DWI might make it possible to reveal (and potentially quantify) less severely damaged regions of the heart and that this imaging modality might play an important role in monitoring the effect of therapies aimed at myocardial reparation and regeneration [4, 20, 21].
Quantitative dMRI was performed by determination of the apparent diffusion coefficient (ADC) along 6 different directions and diffusion tensor parameters. ADCs for the patient obtained in E1 (6 days after pPCI) are overestimated for both infarcted and normal (or remote) tissue (Figure 2 A), and even exceed D0 = 3.04 × 10⁻³ mm2 s–1, which is the value for free water at 37°C. Six months later in the follow-up examination (E2, Figure 2 B), ADCs are below D0, but still slightly exceed the values of 0.73–2.4 × 10⁻³ mm2 s–1 and 0.6–1.65 × 10⁻³ mm2 s–1 reported for diseased and healthy/remote myocardium, respectively [22–27]. Values as high as ~1.7–9 × 10⁻³ mm2 s–1 are indeed encountered in the literature, but we would like to highlight again, after Stoeck et al. [28], that they result from motion-induced signal losses and cannot be connected with any physiological condition. Thus, we can recognize the influence of uncompensated motion on the ADCs from our study. Recent findings on the left ventricle motion dyssynchrony in infarct patients based on apical rocking suggest that dyssynchrony is the lowest and not statistically different from the healthy control for infarctions located in A1 and A2 segments [29], which is in accordance with patients in our study. This may explain lower overestimation than that pointed out by Stoeck et al. [28]. Slightly overestimated ADCs in E2 may indicate a more regular heart rate and breathing that enabled the diffusion encoding in the more quiescent cardiac phase unattainable shortly after AMI. Even though out of range, ADC can reflect the quality of dMRI by using multi-shot SE-EPI unrecognizable visually or motion extent despite the most quiescent cardiac phase chosen. The comparison between E1 and E2 results suggests that single heartbeat sequence design enabling free breathing is desirable for AMI patients. More reliable results in E2 indicate improved capacity for breath-holding and correspondingly overall health status.
Diffusion tensor was calculated from 7 DWIs obtained for all study subjects applying the standard (sDTI) and calibration (BSD) approach. Either sDTI or BSD delivered elevated mean diffusivity (MD, Figure 2 C) similarly to ADCs, while MD in E2 is again closer to the reported diffusivities for both infarct and remote areas. Even though motion can be recognized based on ADCs and MD, its influence can be assumed higher in remote than in the infarct area, where cardiomyocytes are affected and generate reduced force. Although higher overestimation is expected in the remote zone, the obtained diffusivities are still smaller than in the infarct area. Therefore, increased diffusivity in infarcted areas in comparison to remote tissues can also be expected in motion-compensated dMRI, similarly to the results presented by Moulin et al. [24] and Nguyen et al. [27].
Based on ADCs it can be seen that one direction where motion dominates cannot be recognized in E1’s remote area and E2. Considering this and the fact that myocardial motion is complex in terms of type (strain, rotations, etc.) and direction, its approximately even influence on DWI 1-6 can be assumed. Then, fractional anisotropy (FA) should be close to the real values for E2 and remote in E1. The FA value obtained in E2 was FA = 0.282 ±0.052/0.272 ±0.044 (sDTI/BSD) for the infarct area, FA = 0.43 ±0.11/0.402 ±0.090 (sDTI/BSD) for remote tissues and FA = 0.59 ±0.15/0.53 ±0.13 (sDTI/BSD) for the control. These values are within the reported ranges: 0.26 for AMI [23], 0.36 for remote area and 0.54–0.55 for healthy control in diastole phase [26]. The elimination of systematic errors showed no influence on MD, but visibly improved FA.
Conclusions
The DWI image acquisition algorithm that we have developed enabled registration of adequate quality myocardial DWI images that showed differences between healthy subjects and AMI patients. The algorithm involves applying tailored SE-EPI sequences that take into consideration the subject’s health status in relation to the breath-holding capability. This was achieved by our application of a small b-value, short TE, increased resolution and individually adjusted triggering. The differences between MD and FA obtained for the AMI patients’ infarct vs. remote areas suggest that diffusion as a natural contrast can be a potential marker for subtle, early myocardial ischemic damage detection, similar to the role played by DWI imaging in basic research, clinical decision-making and evaluating the efficacy of novel therapies in cerebral ischemic injury [30]. Further progress in cardiac DWI imaging is anticipated to occur with triggering improvements and TE reduction to enable the standard SE-EPI sequence to be used in clinical practice.


