
Introduction
A typical symptom of neonatal hepatobiliary and metabolic failure is cholestatic jaundice. Conjugated hyperbilirubinaemia is never normal or physiological [1–3]. A methodical approach based on the initial history and physical examination is helpful in quickly determining the underlying aetiology of cholestasis because the differential diagnosis is broad. Biliary atresia (BA; 25-35%), genetic disorders (25%), and metabolic diseases (20%) are the most often identified conditions among the several causes of neonatal cholestasis [4–6].
Biliary atresia is a complex liver condition with many facets. If left untreated, it can quickly progress to end-stage cirrhosis, which can have disastrous effects on a child’s health [7]. The fibrosis and inflammation of the extrahepatic bile ducts cause BA [8, 9]. In addition to the broad category of “neonatal hepatitis”, BA is a major cause of neonatal cholestasis; when considered as a separate condition, it is the most common indication for paediatric liver transplantation globally [10, 11].
The extrahepatic bile channels are totally blocked by the time of diagnosis. There is widespread fibrosis and sporadic sites of inflammation, together with segmental or complete loss of the extrahepatic bile ducts’ epithelial lining at the tissue level [9, 12]. Intrahepatic bile ducts, on the other hand, are usually hyperplastic, entrenched in portal tracts with varying degrees of fibrosis and inflammation, and encircled by lobules that exhibit cholestasis-like characteristics and enormous multinucleated hepatocyte content [13, 14].
The degree and severity of the obstruction determine the classification of BA based on anatomical principles. Anglo-Saxon and Japanese classifications, which are more often used, distinguish three primary categories. Based on the degree and severity of the obstruction, BA is categorized anatomically. Three primary categories are described under the more widely used Japanese and Anglo-Saxon taxonomy. In type I, the gallbladder and hepatic ducts are patent (also known as “distal” BA), and atresia is restricted to the common bile duct. The hepatic duct is affected by atresia in type II, but the proximal intrahepatic ducts (also known as “proximal” BA) are patent. There are two subgroups of type II: type IIa, which has a patent gallbladder and patent common bile duct (occasionally with a hilum cyst, or “cystic BA”); and type IIb, which also has the gallbladder, cystic duct, and common bile duct obliterated [15, 16]. Type III is characterized by discontinuity of the entire extrahepatic biliary tree (sometimes known as “complete” BA), in addition to the right and left intrahepatic hepatic ducts. There are four categories in all when the types IIa and IIb are designated as types 2 and 3; however, the French classification is comparable [17]. According to Chardot et al. [18], BA is typically either complete (Japanese/Anglo-Saxon type III, 73%) or subcomplete (18%), with “cystic” and “distal” BA being less common (types IIa and I, 6% and 3%, respectively). BA is the most common indication for paediatric liver transplantation and typically results in biliary cirrhosis, even with the Kasai portoenterostomy performed at the time of diagnosis [19].
Chronic liver illnesses have been linked to circumstances that indicate poor thyroid hormone metabolism, according to studies [20–22]. The goal of this study was to evaluate thyroid function in neonatal cholestasis patients in the Pediatric Hepatology, Gastroenterology, and Nutrition Department at the National Liver Institute, Menoufia University, and Al-Azhar University hospitals.
Material and methods
This was a prospective study that included 100 infants with neonatal cholestasis of various sources: 50 had biliary atresia, and 50 had neonatal cholestasis from other causes. Nineteen infants with inspissated bile syndrome, eight with progressive familial intrahepatic cholestasis, seven with sepsis-induced cholestasis, five with idiopathic neonatal hepatitis, five with choledochal cysts, four with galactosaemia, and two with tyrosinaemia were among the patients who visited the National Liver Institute, Menoufia University, and Al-Azhar University hospitals between July 2024 and January 2025.
Patients’ criteria selection
We included neonates with cholestasis in the current study if they were diagnosed between 8 and 120 days of age, as indicated by elevated total bilirubin levels (> 2 mg/dl) and/or direct bilirubin levels (> 1 mg/dl), or by other supporting clinical evidence such as pruritus and pale stools. The parents or legal guardians of the newborns also gave their informed consent. Infants with congenital hypothyroidism diagnosed postnatally, those receiving active thyroid treatment before enrolment, infants with incomplete medical records, and infants lost to follow-up were excluded. Other clear causes of liver disease, such as genetic syndromes or structural abnormalities unrelated to thyroid dysfunction, were also excluded.
Ethical considerations
The authors affirm that the study presented was conducted following the 2013 revision of the World Medical Association’s Declaration of Helsinki regarding human experimentation. The National LiverInstitute’s local committee at Menoufia University (NLI IRB:00014014/FWA00034015/00701/2025) and the Faculty of Medicine’s Ethical Committee at Al-Azhar University (RESERACH/AZ.AST./PHY003/9/239/1/2025) approved all study procedures. Every participant signed a written informed consent form before enrolment in the study after being fully educated about its benefits, potential dangers, and each step of the process.
Infant assessment
All infants included in the study were assessed as follows:
Demographic and clinical data included gestational age, birth weight, and clinical symptoms (e.g., start of jaundice, stool colour, and pruritus). The Sysmex XT automated haematology analyser (Sysmex Corporation, Japan) was used to examine the differential leucocyte count and complete blood count (CBC). This instrument makes use of hydrodynamic focusing and fluorescent flow cytometry technology.
All liver profile measures, including ALT, AST, serum albumin, total and direct bilirubin, and kidney function tests, including serum urea and creatinine levels, were performed on a Roche Diagnostics, Germany, *Integra 400 auto-analyser (COBAS INTEGRA 400 plus, 2009).
Screening for cytomegalovirus (CMV).
Abdominal ultrasonography: Every infant in the study underwent abdominal ultrasound to evaluate the biliary and hepatic systems.
Infants suspected of having biliary atresia had their livers biopsied to check for fibrosis, bile duct paucity, or other histological characteristics suggestive of BA if the diagnosis was not obvious from imaging examinations. To corroborate the diagnosis, liver samples were also taken from patients with idiopathic neonatal hepatitis, galactosaemia, tyrosinaemia, and progressive familial intrahepatic cholestasis.
Thyroid function tests: Serum-free T3, free T4, and thyroid-stimulating hormone (TSH) were measured by electrochemiluminescence reaction using a Cobas 6000 (e 601 module) from Roche Diagnostics GmbH, D-68305 Mannheim, Germany, to assess thyroid function in all neonates.
Statistical analysis method
The data were collected, tabulated, and statistically analysed using IBM SPSS Statistics version 23 (Armonk, NY: IBM Corp.) on a personal computer. Quantitative data were summarized using descriptive statistics, presented as median and range. To examine the association between qualitative characteristics, the study employed the chi-squared test (χ2). If more than 20% of the cells had an anticipated count of less than 5, the Monte Carlo correction for the χ2 test or Fisher’s exact test was used. When comparing two normally distributed data sets, Student’s t-test was used to assess quantitative factors. To compare quantitative variables between two non-normally distributed data groups, the Mann-Whitney U test (U) was used. The correlation coefficient (r) was used to evaluate the relationship between all variables in the study.
Results
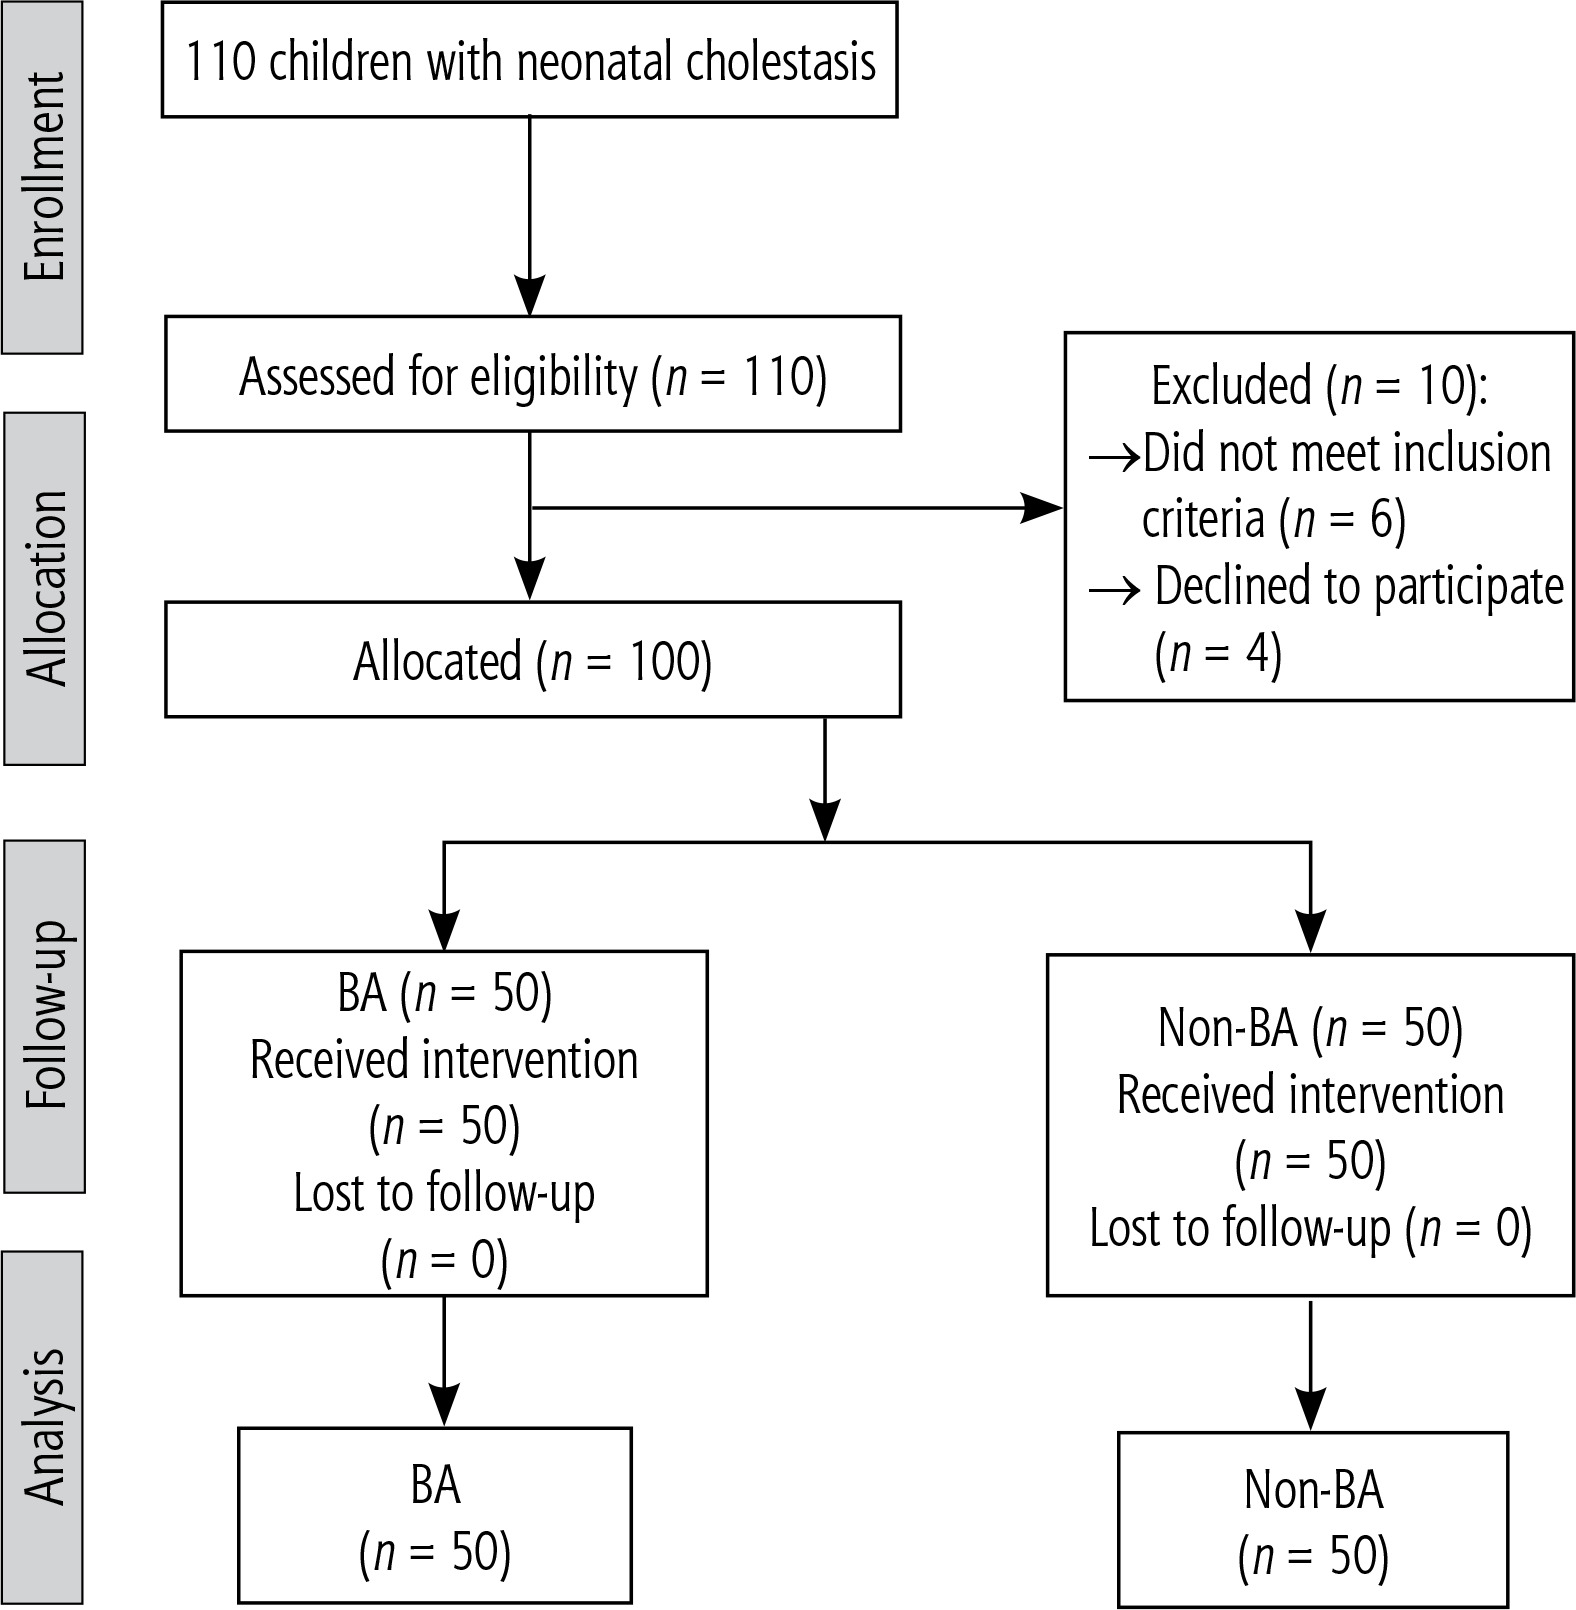
A population flowchart of 110 neonatal cholestasis patients was created at the National Liver Institute’s Pediatric Hepatology, Gastroenterology, and Nutrition Department at Menoufia University and Al-Azhar University Hospitals. Of the 100 newborns who took part in the trial, 50 had BA, while the remaining 50 had neonatal cholestasis from causes other than biliary atresia. Ten patients were eliminated from the study (four patients refused to participate, and six did not fit the inclusion criteria) (Fig. 1). In comparison to the non-BA group, the BA group had considerably higher rates of clay stool, splenomegaly, and hepatomegaly by examination (100%, 26%, and 76%, respectively). In terms of age, the two groups under study were matched (p = 0.067) (Table 1).
Table 1
Demographic and full examination data of the studied infants
| Variable | Groups | Test significance | ||
|---|---|---|---|---|
| BA (n = 50) | Non-BA (n = 50) | χ2 | p-value | |
| Age (day) | ||||
| Mean ±SD | 57.11 ±37.82 | 60.82 ±36.50 | t = 1.09 | 0.067 |
| Median (range) | 55 (9-114) | 64 (8-120) | ||
| Gender, n (%) | ||||
| Male | 38 (76) | 28 (56) | 4.45 | 0.030* |
| Female | 12 (24) | 22 (44) | ||
| Colour of stool, n (%) | ||||
| Clay | 50 (100) | 18 (36) | FE = 47.05 | < 0.0001* |
| Coloured | 0 (0) | 32 (64) | ||
| Average size spleen, n (%) | 37 (74) | 44 (88) | 8.69 | 0.030* |
| Splenomegaly, n (%) | 13 (26) | 6 (12) | ||
| Average size liver, n (%) | 12 (24) | 18 (36) | 33.31 | 0.002* |
| Hepatomegaly, n (%) | 38 (76) | 32 (64) | ||
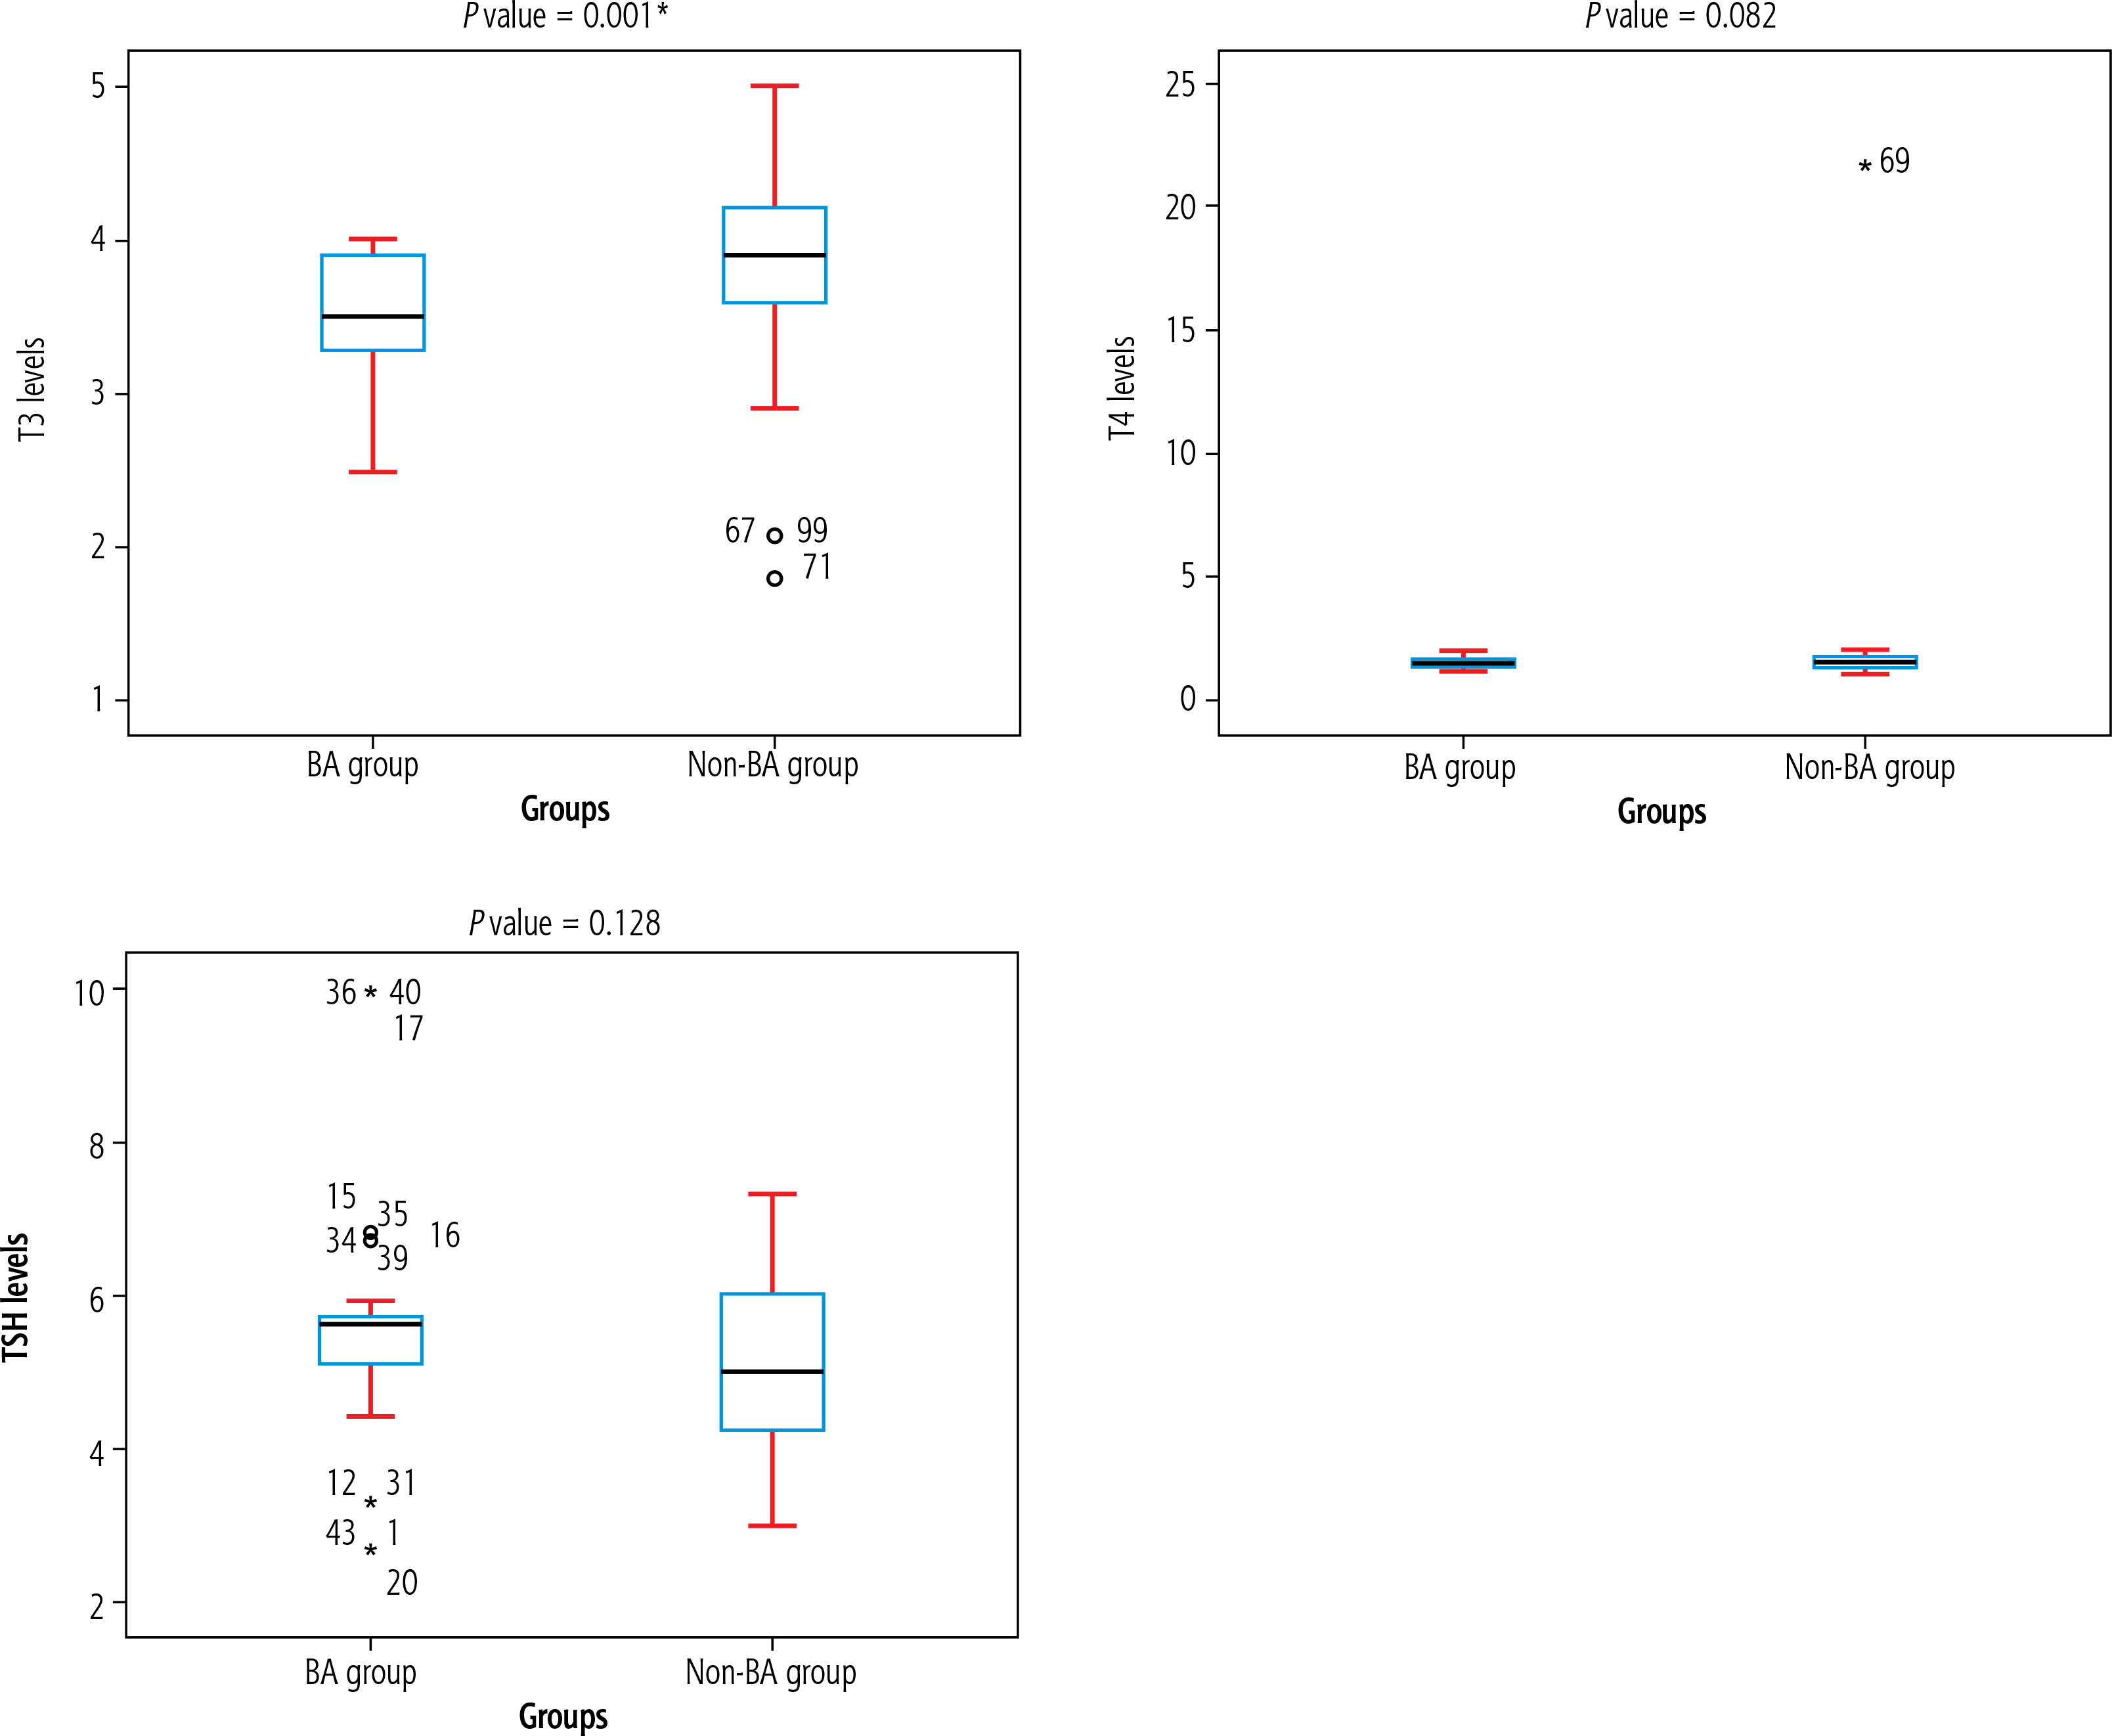
In our investigation, the BA group’s Hb, lymphocyte, PC, and albumin levels were substantially higher than those of the non-BA group by 11.56 ±2.70, 62.26 ±15.74, 0.79 ±0.14, and 3.88 ±0.27, respectively. However, the BA group had significantly fewer neutrophils (26.15 ±12.76) than the non-BA group (30.17 ±6.37), p = 0.02. In contrast, the levels of WBCs, eosinophils, platelets, reticulocytes, PT, INR, PTT, bilirubin, AST, ALT, ALP, GGT, and total protein did not differ significantly among the groups under study (p > 0.05) (Table 2). Furthermore, the BA group had a substantially lower T3 level (3.72 ±0.53) than the non-BA group (3.97 ±0.45) (p < 0.0001). Figure 2 shows that TSH and T4 levels did not differ significantly among the patients under study (p ≥ 0.05).
Table 2
Laboratory investigations among the studied infants
| Variable | Groups | Test significance | ||
|---|---|---|---|---|
| BA (n = 50) | Non-BA (n = 50) | t | p-value | |
| Hb (gm/dl) | ||||
| Mean ±SD | 11.56 ±2.70 | 9.47 ±2.14 | 3.20 | 0.002* |
| Median (range) | 10.7 (8.20-17.10) | 8.80 (7.10-13.80) | ||
| WBCs (*103/µl) | ||||
| Mean ±SD | 12.76 ±3.73 | 11.63 ±3.63 | Z = 0.72 | 0.46 |
| Median (range) | 12.50 (6.90-22) | 12.80 (4-16.70) | ||
| Lymphocytes (*103/µl) | ||||
| Mean ±SD | 62.26 ±15.74 | 52.78 ±8.26 | Z = 2.64 | 0.008* |
| Median (range) | 65 (33-85) | 51 (39-69) | ||
| Neutrophils (*103/µl) | ||||
| Mean ±SD | 26.15 ±12.76 | 30.17 ±6.37 | ||
| Median (range) | 23 (8-50) | 27 (21-39) | Z = 2.27 | 0.02* |
| Eosinophils (*103/µl) | ||||
| Mean ±SD | 3.84 ±2.09 | 3.95 ±2.78 | Z = 0.79 | 0.42 |
| Median (range) | 3 (2-7) | 4 (1-14) | ||
| Platelets (*103/µl) | ||||
| Mean ±SD | 389.69 ±252.15 | 353.34 ±112.6 | Z = 0.72 | 0.47 |
| Median (range) | 306 (107-907) | 314 (192-560) | ||
| Retics% | ||||
| Mean ±SD | 2.48 ±1.85 | 3.65 ±1.94 | Z = 0.98 | 0.32 |
| Median (range) | 2.10 (0.80-7) | 4.20 (1.20-7.80) | ||
| PT (s) | ||||
| Mean ±SD | 12.85 ±1.20 | 13.16 ±1.41 | ||
| Median (range) | 12.40 (11.1-15.1) | 12.70 (11.40-15.90) | –0.70 | 0.48 |
| PC% | ||||
| Mean ±SD | 0.79 ±0.014 | 0.75 ±0.14 | 2.22 | 0.02* |
| Median (range) | 0.83 (0.56-1.02) | 0.78 (0.52-0.97) | ||
| INR | ||||
| Mean ±SD | 1.14 ±0.11 | 1.19 ±0.12 | Z = 1.37 | 0.16 |
| Median (range) | 1.11 (0.99-1.37) | 1.17 (1.02-1.44) | ||
| PTT (s) | ||||
| Mean ±SD | 44.55 ±14.45 | 40.82 ±4.32 | 0.55 | 0.58 |
| Median (range) | 39 (34.40-77.20) | 41 (35-51) | ||
| Total bilirubin (mg/dl) | ||||
| Mean ±SD | 10.16 ±3.25 | 10.55 ±4.78 | 0.75 | 0.45 |
| Median (range) | 8.99 (6.62-18.87) | 8.30 (5.20-18.04) | ||
| Direct bilirubin (mg/dl) | ||||
| Mean ±SD | 6.47 ±1.39 | 7.17 ±2.83 | 0.66 | 0.50 |
| Median (range) | 6.64 (4.36-9.61) | 5.89 (4.68-12.87) | ||
| AST (IU/l) | ||||
| Mean ±SD | 161.30 ±108.11 | 307.56 ±454.52 | –0.10 | 0.91 |
| Median (range) | 168 (29-396) | 103 (28-1681) | ||
| ALT (IU/l) | ||||
| Mean ±SD | 86.96 ±66.96 | 240.13 ±433.74 | –0.75 | 0.45 |
| Median (range) | 73 (14-219) | 91 (18-1591) | ||
| ALP (IU/l) | ||||
| Mean ±SD | 423.73 ±277.90 | 1029.95 ±1733.91 | –0.74 | 0.45 |
| Median (range) | 315 (162-1064) | 438 (35-6431) | ||
| GGT (IU/l) | ||||
| Mean ±SD | 854 ±907.01 | 440.11 ±246.69 | –0.24 | 0.80 |
| Median (range) | 638 (40-3091) | 451 (85-893) | ||
| Total protein (gm/dl) | ||||
| Mean ±SD | 5.33 ±0.60 | 5.60 ±0.40 | –0.77 | 0.43 |
| Median (range) | 5.20 (4.60-6.40) | 5.60 (4.90-6.10) | ||
| Albumin (gm/dl) | ||||
| Mean ±SD | 3.88 ±0.27 | 3.61 ±0.44 | 3.62 | < 0.0001* |
| Median (range) | 3.95 (3.50-4.20) | 3.60 (2.70-4.10) | ||
* Significant. Hb – haemoglobin, WBCs – white blood cells, PT – prothrombin time, PC% – prothrombin concentration, INR – international normalized ratio, PTT – partial thromboplastin time, AST – aspartate aminotransferase, ALT – alanine aminotransferase, ALP – alkaline phosphatase, GGT – γ-glutamyl transferase
Fig. 2
Thyroid function tests were conducted on the studied infants. Data were analysed using the Mann-Whitney U test
In the current investigation, ultrasonography of triangle cord and subcapsular flow were more common in patients with BA by 28% and 52%, respectively, while CMV IgG was considerably lower in the non-BA group (78%) compared to the BA group (96%) (p = 0.007). Additionally, the gallbladder ratio before and after feedings differed significantly between the two groups (p < 0.05), with patients with BA having 50% non-contractile, 50% non-visualized, and 0% contractile gallbladders, respectively (Table 3).
Table 3
Screen for cytomegalovirus and abdominal ultrasonography among the studied infants
| Variable | Groups | Test significance | ||
|---|---|---|---|---|
| BA n (%) | Non-BA n (%) | χ2 | p-value | |
| CMV IgM | 24 (48) | 17 (34) | 2.02 | 0.15 |
| CMV IgG | 48 (96) | 39 (78) | 7.16 | 0.007* |
| US/hepatomegaly | 42 (84) | 46 (92) | 1.51 | 0.21 |
| US/splenomegaly | 46 (92) | 49 (98) | 1.89 | 0.16 |
| US/triangle cord | 14 (28) | 4 (8) | FE = 6.77 | 0.009* |
| Subcapsular flow | 26 (52) | 0 (0) | FE = 35.13 | < 0.0001* |
| Ratio of gallbladder before and after feedings | ||||
| Non-contractile | 25 (50) | 4 (8) | 91.11 | < 0.0001* |
| Non-visualized | 25 (50) | 0 (0) | ||
| Contractile | 0 (0) | 46 (92) | ||
TIn the BA group, T3 levels were significantly negatively correlated with total bilirubin and CMV IgG (r = –0.447, p = 0.001; r = –0.412, p = 0.003, respectively) and positively with platelets and gallbladder ratio before and after feedings (r = 0.529, p = 0.001; r = 0.537, p < 0.0001, respectively). Additionally, there was a significant negative correlation between T4 levels and AST, ALT, ALP, GGT, total protein, PT, and INR (r = –0.641, p < 0.0001; r = –0.599, p < 0.0001; r = –0.466, p = 0.001; r = –0.324, p = 0.022; r = –0.325, p = 0.021; r = –0.421, p = 0.002; r = –0.409, p = 0.003). Conversely, TSH levels were significantly correlated negatively with GGT and lymphocytes (r = –0.702, p < 0.0001) and negatively with Hb, neutrophils, and the gallbladder ratio before and after feedings (r = 0.310, p = 0.029; r = 0.427, p = 0.002; r = 0.375, p = 0.007, respectively) (Table 4).
Table 4
Correlations between T3, T4, and TSH levels and studied variables in the BA group
| Variable | T3 r (p-value) | T4 r (p-value) | TSH r (p-value) |
|---|---|---|---|
| T3 (pg/ml) | – | –0.002 (0.989) | 0.097 (0.503) |
| T4 (ng/dl) | –0.002 (0.989) | – | (0.014) |
| TSH (µIU/l) | 0.097 (0.503) | 0.345* (0.014) | – |
| Total bilirubin (mg/dl) | –0.447* (0.001) | 0.425* (0.002) | 0.212 (0.140) |
| Direct bilirubin (mg/dl) | –0.247 (0.084) | 0.199 (0.165) | 0.078 (0.589) |
| AST (IU/l) | –0.117 (0.416) | –0.641* (0.000) | –0.139 (0.337) |
| ALT (IU/l) | –0.014 (0.922) | –0.599* (0.000) | –0.119 (0.410) |
| ALP (IU/l) | –0.097 (0.501) | –0.466* (0.001) | –0.218 (0.128) |
| GGT (IU/l) | 0.103 (0.476) | –0.324* (0.022) | –0.702* (0.000) |
| Total protein (gm/dl) | 0.190 (0.186) | -0.325 (0.021) | –0.261 (0.067) |
| Albumin (gm/dl) | 0.082 (0.569) | 0.517* (0.000) | –0.138 (0.341) |
| PT (s) | –0.108 (0.454) | –0.421* (0.002) | –0.111 (0.444) |
| PC (%) | –0.086 (0.553) | 0.198 (0.167) | –0.012 (0.935) |
| INR | –0.135 (0.348) | –0.409* (0.003) | –0.138 (0.341) |
| PTT (s) | –0.240 (0.094) | –0.007 (0.961) | 0.137 (0.343) |
| Hb (gm/dl) | 0.003 (0.982) | 0.416* (0.003) | 0.310* (0.029) |
| WBCs (*103/µl) | 0.123 (0.396) | 0.122 (0.400) | –0.201 (0.162) |
| Lymphocyte (*103/µl) | –0.050 (0.729) | –0.174 (0.228) | –0.442* (0.001) |
| Neutrophils (*103/µl) | –0.004 (0.976) | 0.143 (0.322) | 0.427* (0.002) |
| Eosinophils (*103/µl) | 0.080 (0.580) | –0.239 (0.095) | –0.187 (0.193) |
| Platelets (*103/µl) | 0.529* (0.001) | 0.166 (0.249) | –0.188 (0.192) |
| Retics (%) | –0.163 (0.259) | –0.061 (0.671) | 0.075 (0.606) |
| CMVIgG | –0.412 (0.003) | 0.286 (0.044) | –0.271 (0.057) |
| US/hepatomegaly | 0.101 (0.484) | 0.208* (0.146) | 0.030 (0.834) |
| US/splenomegaly | 0.188 (0.190) | 0.013 (0.929) | –0.072 (0.620) |
| US/triangle cord | 0.274 (0.054) | 0.078 (0.590) | 0.559* (0.000) |
| Subcapsular flow | –0.269 (0.059) | 0.029 (0.839) | 0.102 (0.482) |
| Ratio of gallbladder before and after feedings | 0.537* (0.000) | 0.507* (0.000) | 0.375* (0.007) |
Hb – haemoglobin, WBCs – white blood cells, PT – prothrombin time, PC% – prothrombin concentration, INR – international normalized ratio, PTT – partial thromboplastin time, AST – aspartate aminotransferase, ALT – alanine aminotransferase, ALP – alkaline phosphatase, GGT – γ -glutamyl transferase, TSH – thyroid stimulating hormone, T3 – triiodothyronine, T4 – tetraiodothyronine, r – correlation coefficient.
In the non-BA group, T3 levels were significantly positively correlated with TSH (r = 0.323, p = 0.022), total bilirubin (r = 0.393, p = 0.005), direct bilirubin (r = 0.457, p = 0.001), and AST (r = 0.324, p = 0.022), among other variables. T4 levels were also significantly positively correlated with TSH (r = 0.310, p = 0.029), but negatively correlated with AST and ALT (r = –0.439, p = 0.001; r = –0.393, p = 0.005, respectively). Furthermore, TSH levels were significantly positively correlated with T3, T4, and GGT (r = 0.323, p = 0.022; r = 0.310, p = 0.029; r = 0.425, p = 0.002, respectively) (Table 5).
Table 5
Correlations between T3, T4, TSH levels, and studied variables among the non-BA group
| Variable | T3 r (p-value) | T4 r (p-value) | TSH r (p-value) |
|---|---|---|---|
| T3 (pg/ml) | 1.000 | 0.136 (0.345) | 0.323* (0.022) |
| T4 (ng/dl) | 0.136 (0.345) | 1.00 | 0.310* (0.029) |
| TSH (µIU/l) | 0.323* (0.022) | 0.310* (0.029) | 1.000 |
| Total bilirubin (mg/dl) | 0.393* (0.005) | 0.206 (0.152) | 0.245 (0.086) |
| Direct bilirubin (mg/dl) | 0.457* (0.001) | –0.088 (0.543) | 0.198 (0.167) |
| AST (IU/l) | 0.324* (0.022) | –0.439* (0.001) | 0.142 (0.326) |
| ALT (IU/l) | 0.063 (0.663) | –0.393* (0.005) | –0.158 (0.274) |
| ALP (IU/l) | –0.009 (0.949) | –0.104 (0.472) | 0.262 (0.066) |
| GGT (IU/l) | 0.105 (0.468) | 0.041 (0.778) | 0.425* (0.002) |
Discussion
Although not typically thought of as the main cause of neonatal cholestasis, thyroid function problems have been linked to the pathophysiology of liver disease in newborns. De Bruyne et al. state that neonatal cholestasis is a complicated illness with several possible causes, such as metabolic, viral, and obstructive factors [23]. The development or aggravation of cholestasis may be attributed to thyroid malfunction, specifically hyperthyroidism and subclinical hypothyroidism, according to recent research. According to reports, hyperthyroidism can result in liver problems such cholestasis and hepatomegaly, particularly when it is linked to maternal Graves’ disease [24, 25]. Further supporting the possible connection between thyroid dysfunction and liver abnormalities is the phenomenon known as euthyroid sick syndrome, which is seen in chronic liver illness [26]. This raises the question of whether thyroid conditions are more important than previously thought in the pathophysiology of neonatal cholestasis, suggesting that their possible participation merits greater research. Thyroid function tests in newborns with neonatal cholestasis were hence the focus of this investigation.
The results of our study showed that there was a substantial difference between the two groups, with the BA group having 100% of the stool colour being clay-coloured, compared to just 36% of the non-BA group. This supports the suggestion that stool colour may serve as a useful clinical indicator for distinguishing between conditions that are BA and those that are not. In line with our results, Robie et al., also underlined the acholic nature of stools in BA, which is consistent with our observation of clay-coloured stools in BA patients [27]. The appearance of green stools in infancy may be a direct indication of bile excretion. However, although stool colour has clinical significance, Robie et al. also pointed out that doctors often underreport or incorrectly document stool colour, which has proven problematic in clinical practice. The notion that stool colour may not always be adequately identified or documented is supported by this, which could result in postponed diagnoses or needless diagnostic tests such as the hepatobiliary iminodiacetic (HIDA) scan. In contrast, according to Lee and Chai’s study, stool colour exhibited low specificity (51%) but high sensitivity (83%) for detecting BA [28]. This suggests that although stool colour can be a good signal in many situations, it is not always accurate and can lead to false positives, especially when the condition is not BA. The colour of the stool may change from green to acholic in BA patients, they added. Our observations of certain infants with initially pigmented faeces who subsequently displayed acholic stools may represent the dynamic nature of the disease, and they parallel this trend in BA patients.
This was also observed by Lee and Chai, who documented that in a larger series of 146 infants, two BA patients began with pigmented faeces, but as the illness worsened, they had acholic stools. The results from Taiwan, where a universal stool colour screening programme was implemented as a crucial tool for the early detection and treatment of BA, also concur with our findings. Studies by Lien et al. and Hsiao et al. demonstrated the programme’s efficacy in early detection, highlighting the use of stool colour cards as a straightforward, non-invasive technique to assist in the identification of BA in newborns [29, 30]. Such screening programmes are widely used, which supports the results of our study and highlights the significance of stool colour in the early management of the illness.
As the current study showed, hepatomegaly was detected in 76% of the BA group compared to 64% of the non-BA group, while splenomegaly was observed in 26% of the BA group and 12% of the non-BA group. These results are in line with earlier research on the diagnostic use of physical examination in BA diagnosis, demonstrating the clinical significance of liver and spleen evaluation in identifying this illness.
In a study by Robie et al., with 80% of BA patients exhibiting hepatomegaly compared to 30% of non-BA patients, hepatomegaly did not reach statistical significance [27]. Similarly, 50% of BA patients had a palpably “hard” liver, compared to 30% of non-BA patients; however, this difference was not statistically significant. Although not always conclusive, these results are consistent with ours, which showed that BA patients had a higher prevalence of hepatomegaly and a hard liver edge. These physical characteristics are not necessarily accurate for diagnosing BA on their own, even though they can offer clinical insight. Lee and Chai found that the sensitivity and specificity for diagnosing BA were 77% and 51%, respectively, for liver spans larger than 4 cm, and 80% and 65%, respectively, for firm livers [28]. Despite certain limitations in terms of specificity and sensitivity, these results support our conclusion that liver testing is still a useful technique. Furthermore, with an 87% accuracy rate in their sample, Gupta et al. noted that one of the five clinical characteristics indicative of BA was a hard, sharp liver edge as opposed to a soft, smooth edge [31]. This demonstrates the liver examination’s potential use as a clinical tool, especially when paired with other clinical indicators and testing. On the radiological front, Robie et al. noted that HIDA scans and ultrasonography (US) are crucial for assessing neonates with cholestatic jaundice (CJ) [27]. Our research also revealed that, in line with other findings, US could identify a non-contractile and non-visualized gallbladder in BA patients. Aziz et al., Sun et al., and Mittal et al. (2011) have further detailed US findings that help diagnose BA; among them, the “triangular cord” sign is one of the most discussed [32–34]. Nine BA patients had this symptom, according to Choi et al., but nine non-BA patients did not [35]. This suggests high specificity (97%) but low sensitivity (23%). While acknowledging the usefulness of these indicators in assisting with diagnosis, our research concurs with these conclusions, acknowledging their low sensitivity.
The non-BA group in the current study had considerably higher T3 levels than the BA group, but there were no significant differences between the two groups in T4 or TSH. Although it is still unknown what processes underlie this difference, this discovery points to a possible thyroid-related difference between the two groups. We also found that TSH, total bilirubin, Hb, CMV IgG, and the gallbladder ratio before and after feedings all significantly positively correlated with T4 levels in the BA group. Before and following feedings, TSH levels were significantly positively correlated with Hb, neutrophils, US/triangle cord, and the gallbladder ratio. TSH, total bilirubin, direct bilirubin, and AST all significantly increased in the non-BA group.
Although hyperthyroidism is not usually thought of as the primary cause of neonatal conjugated hyperbilirubinaemia, several case reports have highlighted hepatic manifestations of neonatal thyrotoxicosis. Loomba-Albrecht et al. [24] reported a neonate with cholestasis associated with hyperthyroidism due to maternal Graves’ disease, and Almadhoun et al. [25] reported cases of cholestatic jaundice with hepatosplenomegaly and hepatitis in infants with neonatal Graves’ disease. Other reports, including those by Dryden et al. [36] and Beroukhim et al. [37], describe hyperthyroid infants born to mothers with Graves’ disease who developed coagulopathy and conjugated hyperbilirubinaemia. However, these studies did not mention liver failure in these neonates. Additionally, in a more recent case report, Attia et al. [38] reported a case of neonatal liver failure linked to hyperthyroidism as a result of maternal Graves’ disease. According to Hasosah et al., neonatal thyrotoxicosis may produce cholestasis by disrupting the hepatic architecture or by causing other systemic consequences [39]. They also postulated that hyperthyroidism should be regarded as a potential cause of cholestasis and liver dysfunction in newborns. It is still unknown how precisely neonatal hyperthyroidism causes cholestasis and liver failure. The reticuloendothelial system’s expansion in neonatal Graves’ disease may cause cholestasis by disrupting the hepatic architecture [40]. Alternatively, Hasosah et al. suggested that hepatic dysfunction and hepatosplenomegaly may be exacerbated by thyrotoxicosis-induced high-output congestive heart failure, which would further complicate the affected neonates’ clinical picture [39]. The anomalies associated with the liver that we observed in the non-BA group may be explained by these putative mechanisms.
Regarding the thyroid function in chronic liver disease, Ön et al. found that in 89.7% of children and adolescents with chronic liver disease, thyroid function tests were normal [26]. However, 6.5% of these patients had subclinical hypothyroidism (SH), and 3.7% had euthyroid sick syndrome (ESS). It is not entirely clear how thyroid dysfunction and liver disease are related. 18.7% of patients with acute and chronic liver illness had thyroid dysfunction, according to Kharb et al., and 8% of these patients had euthyroid sick syndrome [41]. Additionally, Caregaro et al. found that ESS was present in 30.6% of cirrhosis patients, supporting the connection between liver disease and thyroid dysfunction [42]. Thyroid dysfunction in liver disease most likely has a pathophysiological basis linked to increased proinflammatory cytokines. De Vries et al. demonstrated that in addition to decreasing TSH receptor expression, cytokines such as interleukin 1β can hinder the conversion of T4 to T3 and raise reverse T3 (rT3) concentrations by lowering deiodinase type 1 activity [43]. Deiodinase type 1 is essential for converting T4 to the active form of T3, and a decrease in its activity can lead to the biochemical profile of ESS, which is characterized by high rT3 and low or normal levels of free T4 (fT4) and free T3 (fT3). Thyroid dysfunction in chronic liver illnesses may be explained by this mechanism, especially when systemic inflammation is present. Despite the inflammatory milieu, certain cytokines may cause a shift toward SH in this situation, which would supply enough active thyroid hormone for metabolic processes [26]. Interestingly, Ön et al. also observed that thyroid problems and biliary atresia (BA) may be related, as one out of seven patients with SH had BA [26]. Uncertainty surrounds the association between both disorders, and further investigation is required to determine whether thyroid dysfunction, specifically, subclinical hypothyroidism, may play a role in the onset of non-BA. Although this link has not been shown yet, it merits more research, because our findings indicate that thyroid-related anomalies, including those involving T3 levels, may contribute to the pathophysiology of neonatal cholestasis.
Conclusions
In conclusion, significant differences were found in T3 levels, with the non-BA group exhibiting higher levels. However, there were no significant differences in T4 or TSH levels between the two groups. These results raise the possibility that thyroid dysfunction, especially in circumstances other than biliary atresia, is linked to neonatal cholestasis. Thyroid abnormalities, such as euthyroid sick syndrome and subclinical hypothyroidism, have been documented in patients with liver illness, although the precise processes are yet unknown. More extensive research is needed to better understand the connection between thyroid function and neonatal cholestasis, as well as to find out whether routine thyroid screening could help with the identification and treatment of affected infants.
This manuscript draws attention to the need to assess thyroid function in the diagnosis of infantile cholestasis other than biliary atresia. Although such cases are undoubtedly rare, it should be emphasized that there is a possibility of causal treatment, and for this reason it is worth bringing them to the attention of paediatricians.


