
Summary
High premature ventricular contraction (PVC) burden is known to cause atrial remodeling, and abnormal P wave indices were associated with adverse atrial remodeling. P wave duration-to-amplitude ratio (PWDAR) is a new P wave index that includes both P wave duration and P wave voltage, which can be considered to effectively evaluate atrial cardiomyopathy. 3D speckle tracking echocardiography is beneficial for the early detection of left atrium (LA) mechanical dysfunction. This is the first study to assess both mechanical (with 3D-STE) and electrical (with PWDAR) left atrial function in patients with a high PVC burden. Our results suggest that patients with a high PVC burden, despite being apparently healthy, may have subclinical LA myocardial mechanical and electrical dysfunction.
Introduction
Premature extra-systole or premature ventricular contractions (PVCs) occur in a wide range of individuals, from apparently healthy individuals to patients with advanced heart failure [1, 2]. Although PVCs are known to be associated with poor outcomes in patients with cardiovascular pathology, their prognosis in patients without known cardiac disease is still unclear [3, 4].
Frequent PVCs that cause left ventricular (LV) systolic dysfunction can cause left atrial (LA) remodeling and LA enlargement without a decrease in left ventricle ejection fraction (LVEF) [5–7].
While 2D echocardiography can detect overt left ventricular and left atrial pathologies, it may be inadequate in the early stages [8]. 3D speckle-tracking echocardiography is considered a sensitive and effective technique for detecting left ventricular and left atrial involvement at the subclinical stage [9–11].
High PVC burden is known to cause left atrial remodeling. This left atrial remodeling causes prolongation of atrial conduction time and a decrease in voltage values, thus leading to prolongation of P wave duration and a decrease in P wave amplitude [12–14]. Previous studies have shown that abnormal P wave values reflect adverse left atrial remodeling and predict atrial fibrillation (AF) in some cardiovascular diseases or recurrence after AF ablation [15–18]. P wave duration-to-amplitude ratio (PWDAR) is a new P wave index that includes both P wave duration and P wave voltage, which can be considered to effectively evaluate atrial cardiomyopathy [19].
Aim
In this study, we aimed to evaluate PVC-induced atrial cardiomyopathy in patients with a high PVC burden by left atrial strain echocardiography and a new P wave index, PWDAR.
Material and methods
Study population
A total of 150 consecutive patients were enrolled in this cross-sectional observational study between June 2021 and November 2022. In the present study, patients who applied to the outpatient clinic with complaints of palpitations and who had PVC detected on surface ECG were analyzed with a 24-hour Holter ECG device (MEDSET, Germany). High PVC burden was defined as more than 10 000 PVCs/24 h during Holter recording. The PVC+ group included 75 patients with a high PVC burden. The control group consisted of 75 age- and gender-matched patients. The patients underwent 2D and 3D echocardiographic examination.
The exclusion criteria were history of atherosclerotic heart disease (MI, PCI, CABG), severe valvular diseases, atrial fibrillation, atrial flutter, ICD/pacemaker, heart failure, LVEF < 50%, bundle branch block, chronic hepatic and renal insufficiency, uncontrolled hypertension, oncological diseases, and poor 3D image quality. All patients signed an informed consent form. The present study was approved by the local ethics committee. Our study was carried out in compliance with the ethical guidelines of the Declaration of Helsinki.
Echocardiographic examination
All the echocardiographic examinations were carried out by a single experienced cardiologist. Measurements were recorded when PVC was not present. Obtaining 2D and 3D images was performed in accordance with the American Society of Echocardiography (ASE) criteria with one-lead ECG monitoring [20]. Echocardiographic evaluations were performed with an easily accessible echocardiographic system (Vivid E9; GE Healthcare, Horten, Norway) with an appropriate M5S or 6S probe for patient size. LA diameter and volume were measured from standard apical 4-chamber views at end-systole just before mitral valve opening. The left atrial volume index (LAVI) was measured by dividing the LA volume by the body surface area. The analysis was performed off-line with the aid of a commercially available software package (EchoPAC 113 1.0; GE, Horton, Norway). Left ventricular global longitudinal strain (LV GLS), left ventricular global circumferential strain (LV GCS), Left ventricular global area strain (LV GAS), and left ventricular global radial strain (LV GRS) were obtained for the strain analyses.
All 3D LA volumes were displayed in reconstructed apical four-chamber, apical two-chamber, and short-axis views and 3D cineloops were analyzed at 20–30 frames/s. To obtain correct 3D wall motion tracking, the endocardial border was traced with the start point at the level of the mitral annulus in a counterclockwise direction. Pulmonary veins (PV) and the left atrial appendage (LAA) were excluded from tracing. The 3D wall motion tracking was automatically performed using a 3 mm region of interest (ROI), and manual corrections were applied to all the trackings as required during the entire cardiac cycle. LA reservoir function was assessed using the left atrial strain reservoir (LAS-r), and left atrial emptying fraction (LAEF) in 3D. LA contractile function was assessed using LAS-active: LA strain at the onset time of the P wave, and LAEF-active: (LA volume at the onset time of the P wave – LA minimum volume)/LA volume at the onset time of the P wave. LA conduit function was assessed by using LAS-passive: (LAS-r) – (LAS-active), and LAEF-passive: (LA maximum volume – LA volume at the onset time of the P wave)/LA maximum volume [21].
Calculation of P wave indices
Surface 12-lead standard ECGs were recorded from each patient with a 25 mm/s paper speed at 10 mm/mV amplitude (Nihon Kohden Cardiofax M ECG-1350). The onset of the P wave was the point of initial upward or downward deflection from ECG baseline, and the P wave endpoint was determined as the point where the waveform returned to baseline. P wave duration (PWD) was calculated as the difference between the onset and the offset of P wave and was measured in lead II. P wave amplitude (PWA) was measured from the peak of the P wave to the isoelectric line of the T-P interval in lead II. The P wave duration-to-amplitude ratio (PWDAR) was calculated for all patients.
Statistical analysis
The SPSS 25.0 (IBM Corp., Armonk, NY, USA) program was used for statistical analysis. Normally distributed continuous data were expressed as mean ± standard deviation. Continuous variables that are not normally distributed were expressed as median, and categorical variables were expressed as numbers (n) and percentages. Pearson χ2 and Fisher exact tests were used to compare categorical variables. Student’s t test was used to compare parametric continuous variables. The Mann-Whitney U test was used to compare nonparametric continuous variables. Multivariate logistic regression analysis was used to identify independent predictors of a high PVC burden. Receiver operating characteristics (ROC) curves were performed to determine the cut-off values of PWDAR and LAS-r to predict high PVC burden. Variables were examined at the 95% confidence level. A p-value < 0.05 was considered as statistically significant.
Results
The most common PVC site of origin was found to be the right ventricular outflow tract (RVOT) septum (34.6%) in the current study (Table I). The mean age of the patients was 44 ±10.6 years. Both groups were similar in regard to clinical and laboratory results (Table II).
Table I
Distribution of PVC patients according to site of origin
| Parameter | N = 75 n (%) |
|---|---|
| RVOT septum | 26 (34.6) |
| RVOT free wall | 14 (18.6) |
| LCC | 6 (8) |
| L-RCC | 8 (10.6) |
| R-NCC | 3 (4) |
| LV summit | 10 (13.3) |
| AMC | 4 (5.3) |
| Parahisian | 4 (5.3) |
Table II
Clinical and laboratory data of the study population
While PWD (130 ±18.5 vs. 115 ±16.5 ms, p = 0.001), PWDAR (1075.5 ±560 vs. 632 ±355 ms/mV, p < 0.001), P wave peak time (PWPT) (65 ±15 vs. 52 ±10 ms, p = 0.001) and P wave dispersion (PWdisp) (44 ±14 vs. 27 ±15 ms, p = 0.013) values were significantly higher in the PVC+ group; the PWA (0.12 ±0.05 vs. 0.2 ±0.05 mV, p = 0.008) value was found to be lower (Table III).
Table III
Two-dimensional echocardiographic and electrocardiographic results
[i] LVEF – left ventricular ejection fraction, LAVI – left atrial volume index, LVSWT – left ventricular septal wall thickness, PWT – posterior wall thickness, LVEDD – left ventricular end-diastolic diameter, LVESD – left ventricular end-systolic diameter, PWD – P wave duration, PWA – P wave amplitude, PWDAR – P wave duration to amplitude ratio, PWPT – P wave peak time, PWdisp – P wave dispersion.
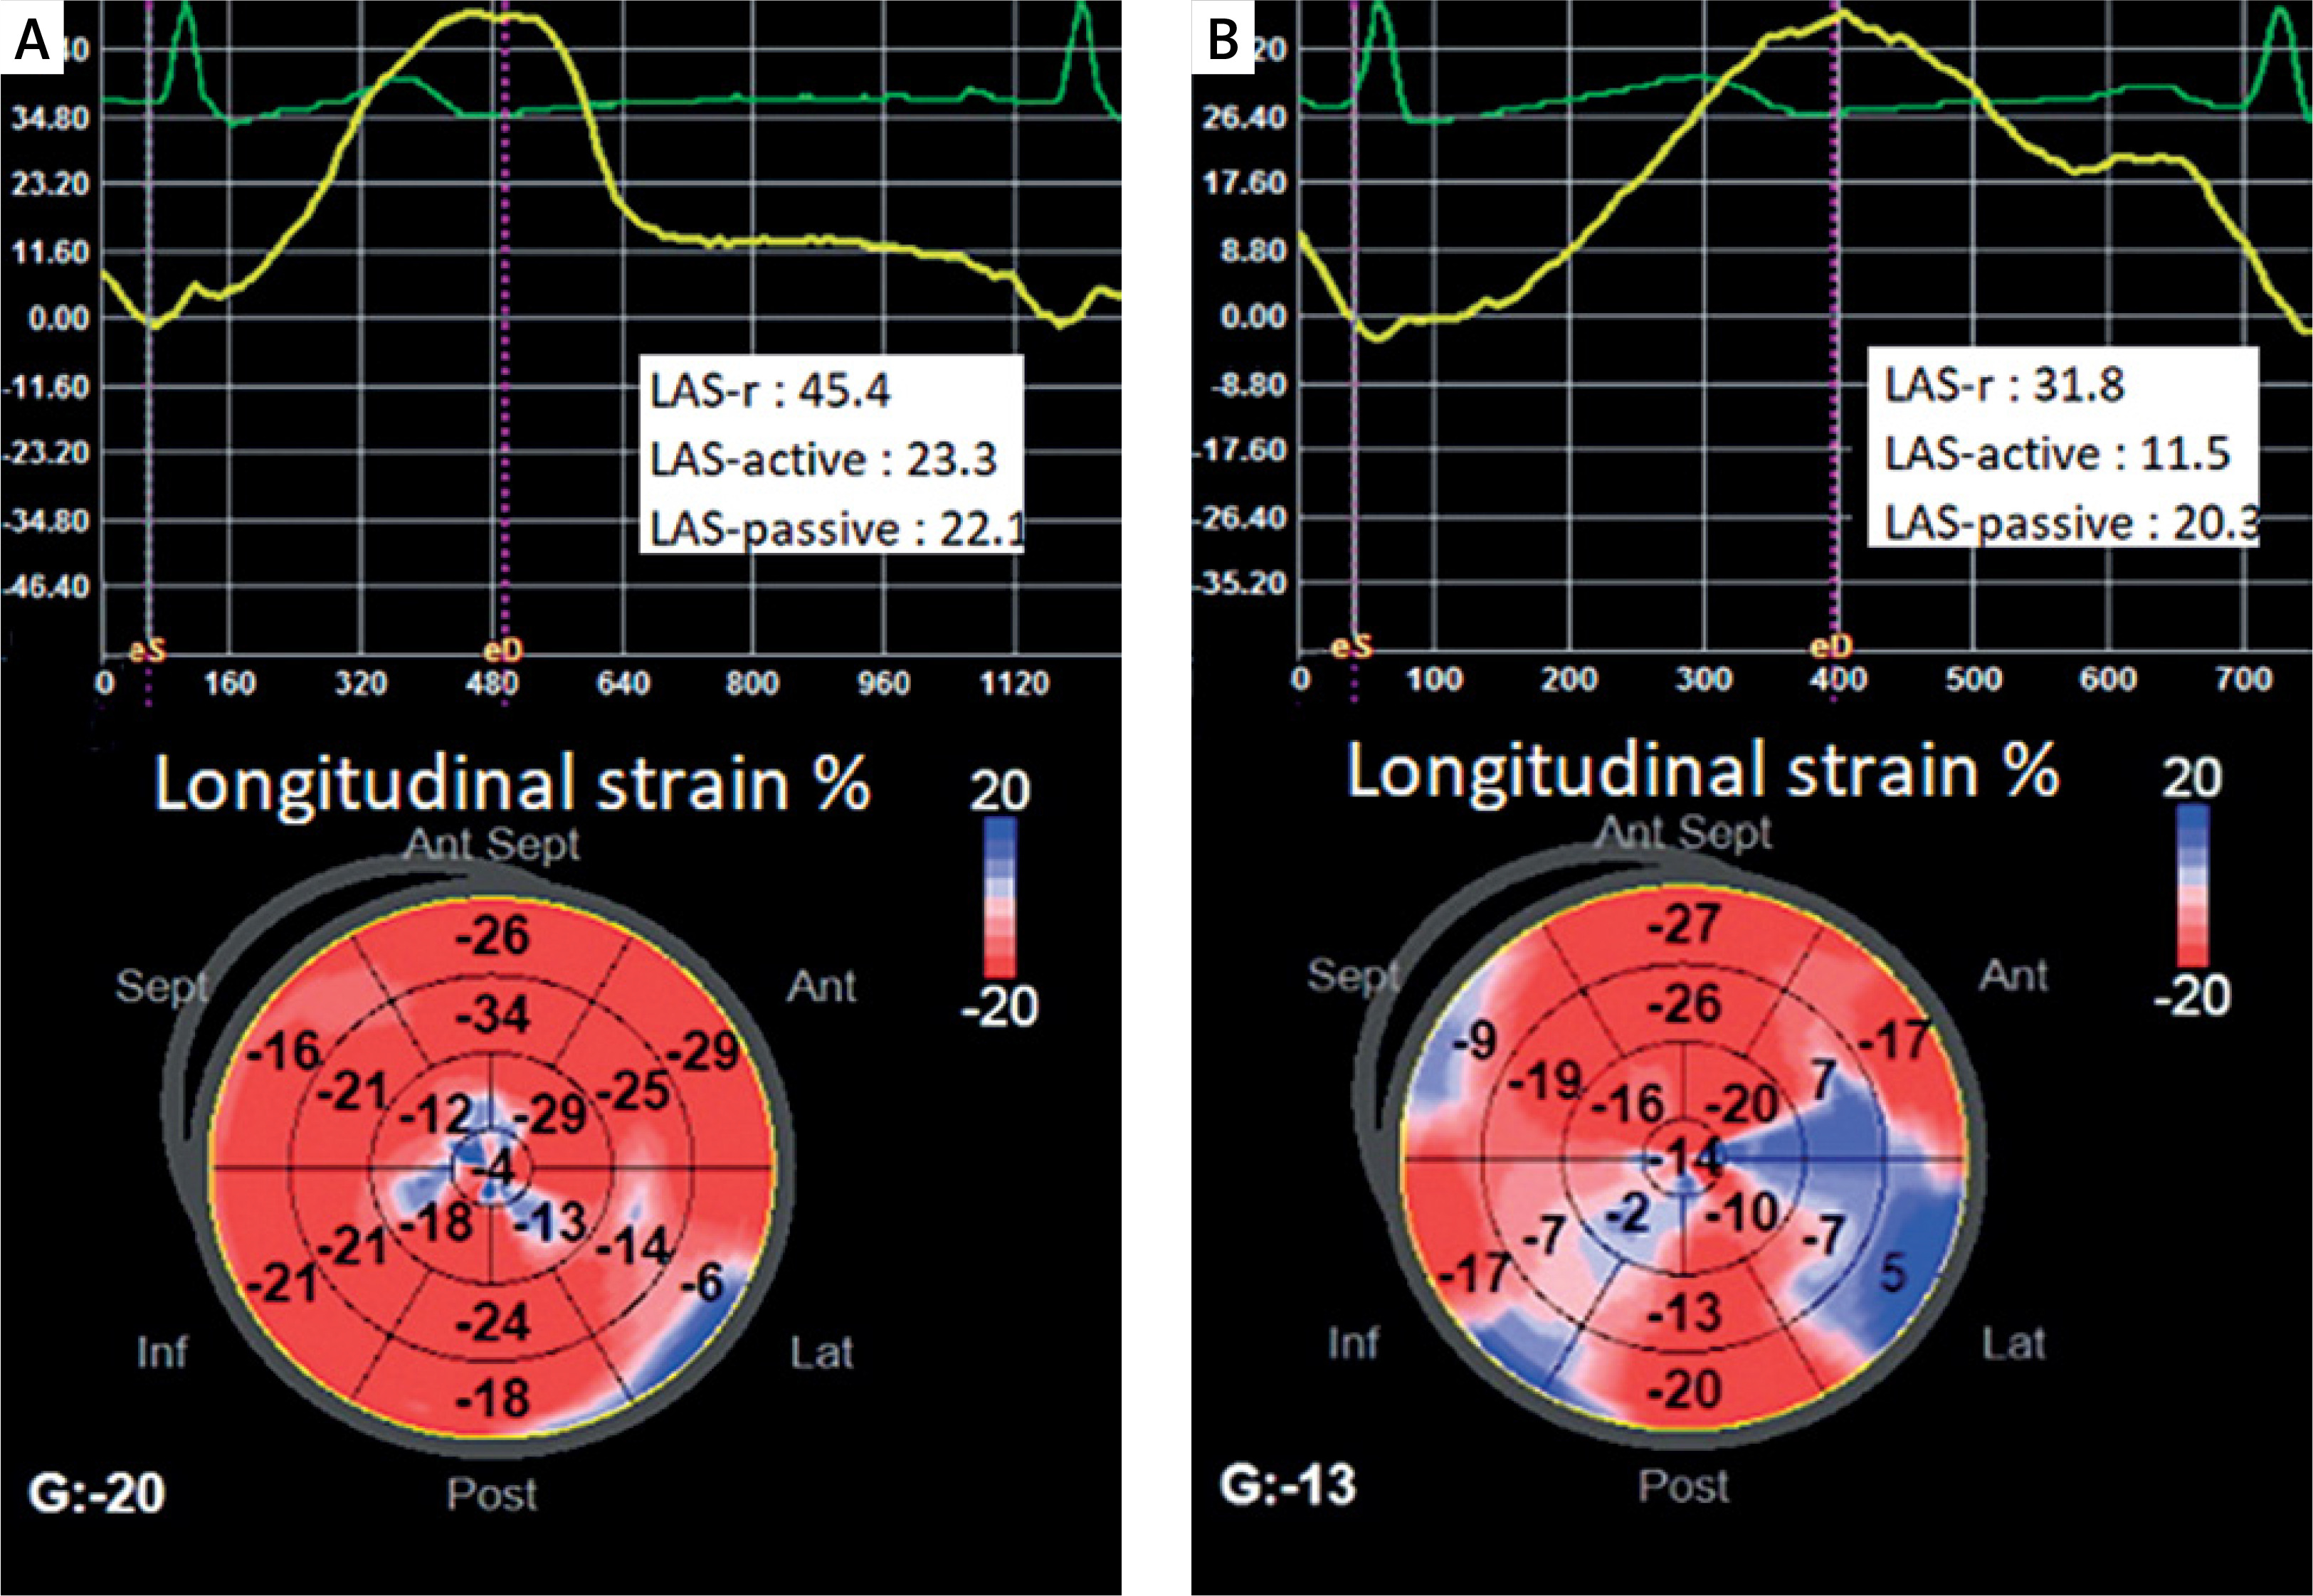
LAS-r, LAS-active, and LV-GLS were significantly lower in the PVC+ group than in the control group (p < 0.001, p < 0.001, p = 0.015, respectively) (Table IV, Figure 1).
Table IV
Three-dimensional echocardiographic data
[i] LVEDV – left ventricular end-diastolic volume, LVESV – left ventricular end-systolic volume, LV – left ventricular, GLS – global longitudinal strain, GCS – global circumferential strain, GAS – global area strain, GRS – global radial strain, LAS-r – left atrial strain-reservoir, LAEF – left atrial emptying fraction.
Figure 1
A – LAS and LV-GLS values of a healthy person from the control group, B – LAS and LV-GLS values of a patient from the PVC+ group
The univariate and multivariate analysis results demonstrated that PWDAR (p < 0.001), LAS-r (p < 0.001), LAS-active (p = 0.008), and LV-GLS (p = 0.021) were independent factors predicting PVC-induced atrial cardiomyopathy (PVC-ACMP) (Table V).
Table V
Univariate and multivariate analysis for PVC
[i] BMI – body mass index, PWPT – P wave peak time, PWdisp – P wave dispersion, LAVI – left atrial volume index, PWDAR – P wave duration to amplitude ratio, LAS – left atrial strain, LV – left ventricular, GLS – global longitudinal strain, GCS – global circumferential strain, CI – confidence interval.
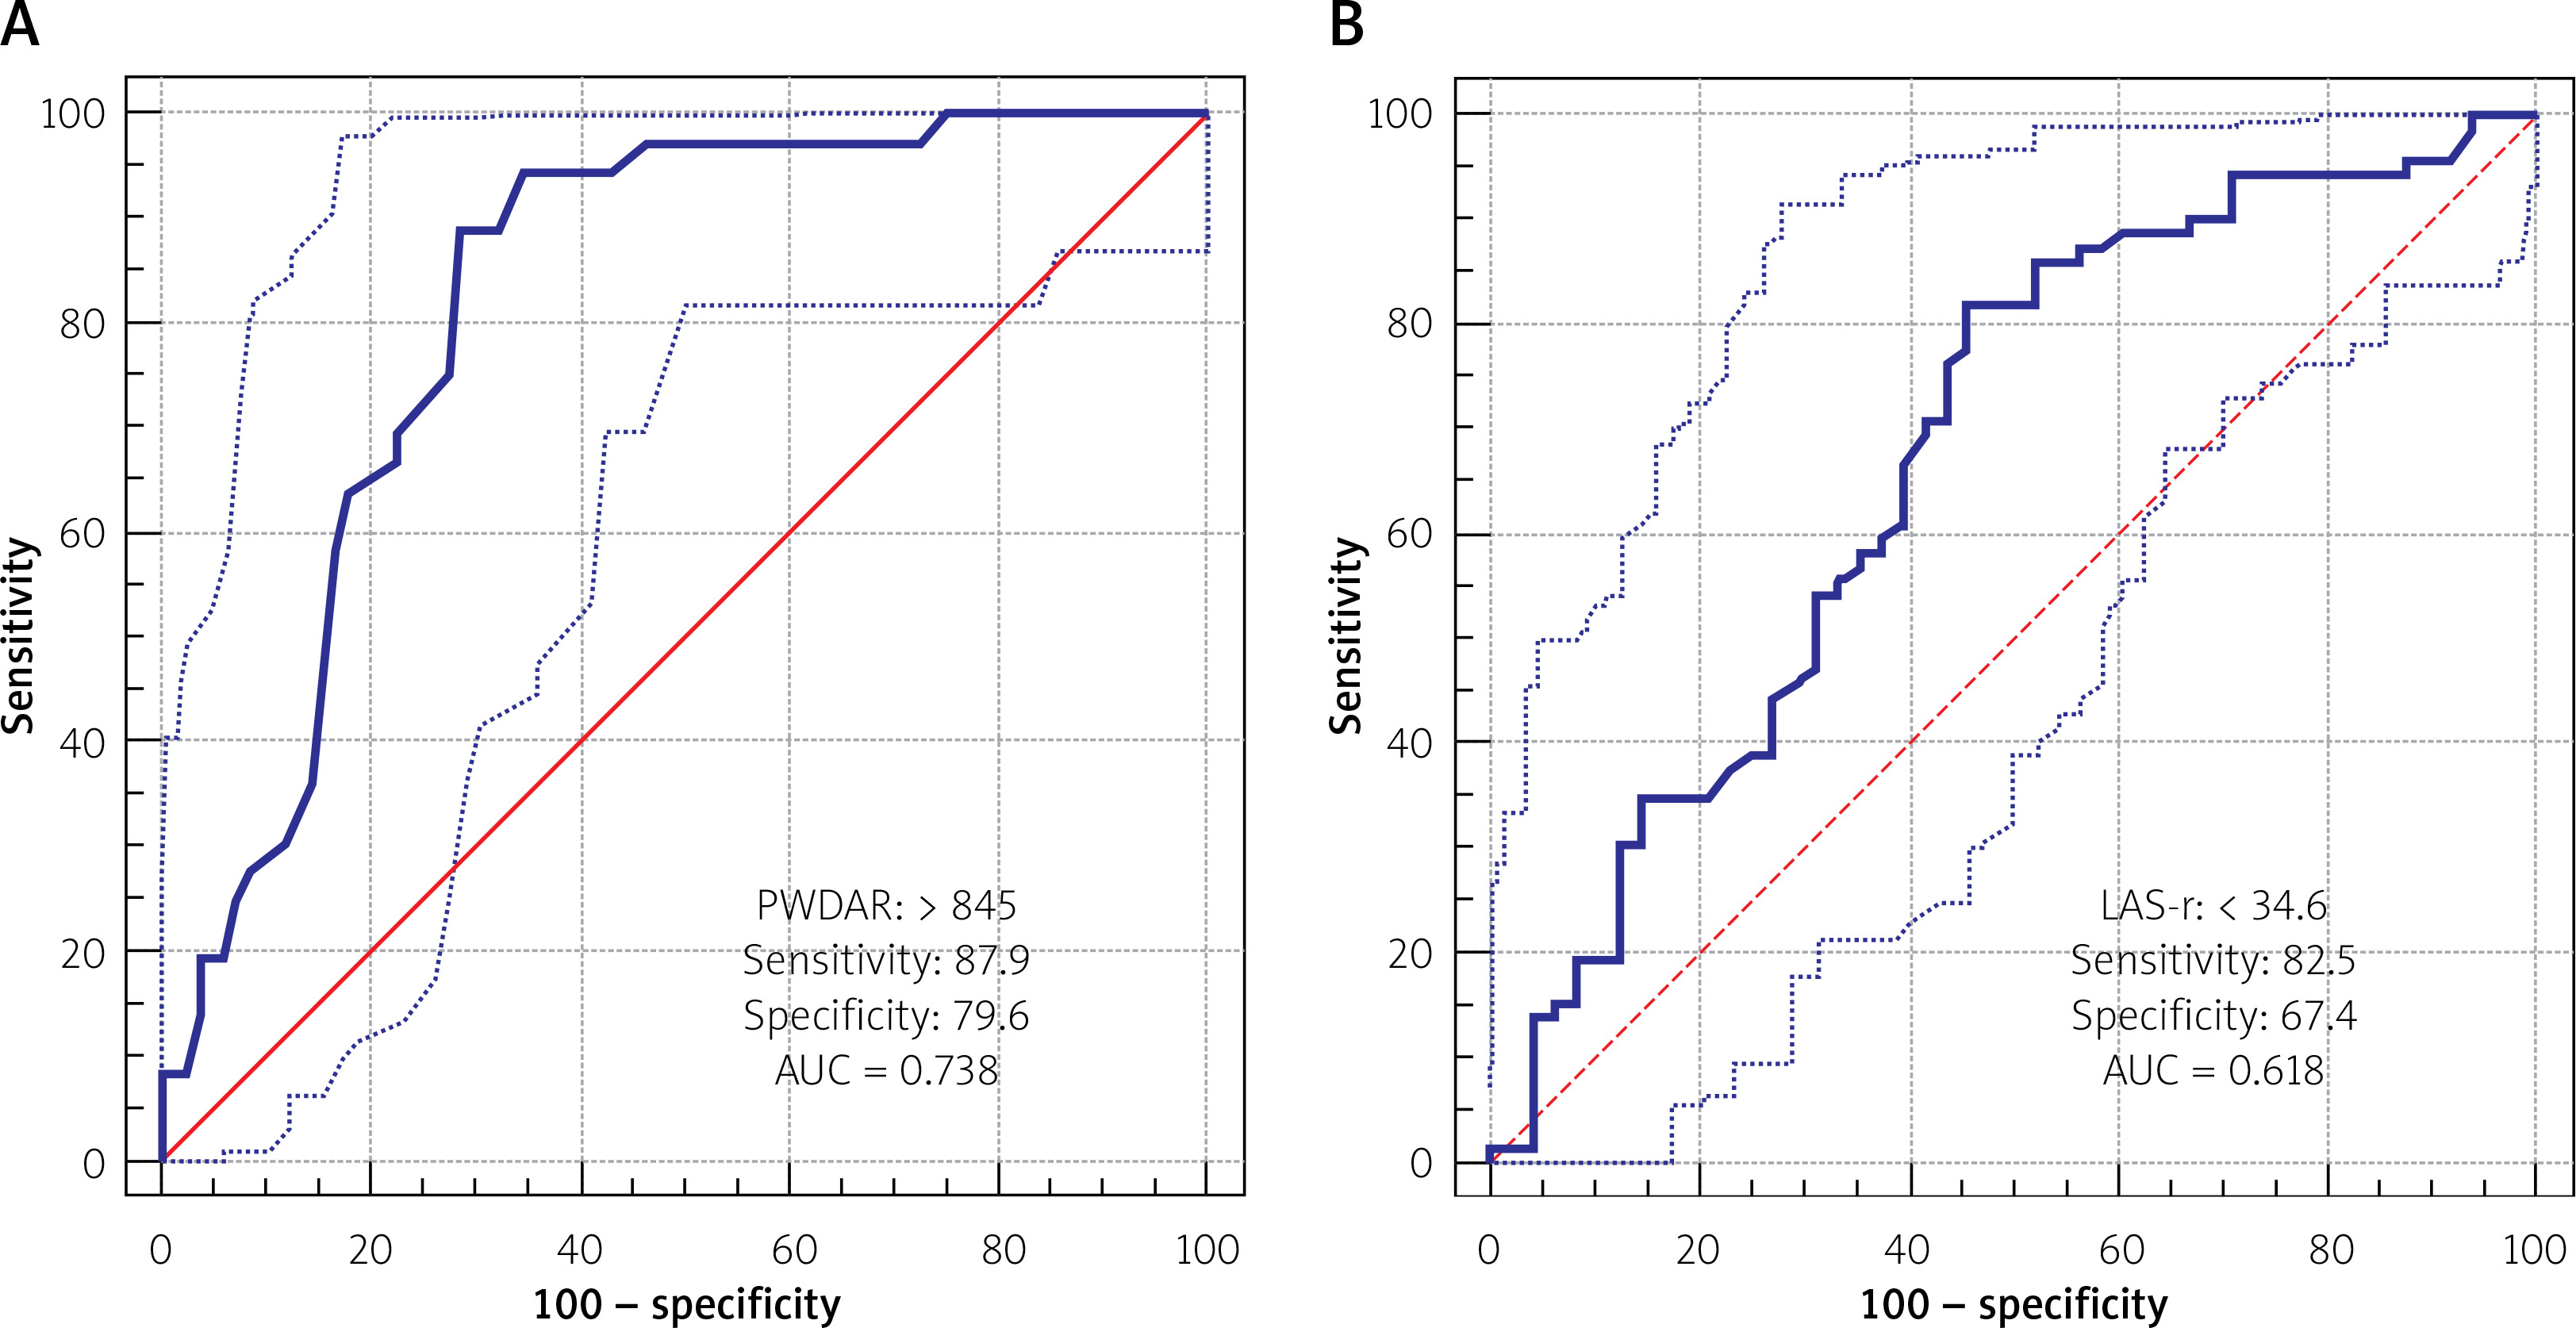
ROC curves were performed to determine the cut-off values of PWDAR and LAS-r to predict PVC-ACMP (Figures 2 A, B). A PWDAR value of > 845 ms/mV has 87.9% sensitivity and 79.6% specificity for prediction of PVC-ACMP (AUC = 0.738); and a LAS-r value of < 34.6 has 82.5% sensitivity and 67.4% specificity for prediction of PVC-ACMP (AUC = 0.618).
Discussion
The results showed that the mean PWDAR value was significantly higher in the PVC+ group than the control group; and the LAS-r, LAS-active, and LV-GLS were significantly lower in the PVC+ group than the control group. These results indicate the presence of subclinical left atrial electrical and mechanical dysfunction in patients with a high PVC burden. PWDAR and left atrial strain parameters can predict PVC-induced atrial cardiomyopathy (PVC-ACMP).
Previous studies have indicated that several factors are associated with PVC-induced cardiomyopathy (PVC-CMP): a high PVC burden, the presence of interpolated PVCs, the presence or absence of symptoms, wide QRS PVCs, a higher coupling interval and an epicardial PVC origin [22–24]. Moreover, it was observed that PVCs increase the risk of AF, possibly through cardiac remodeling and increased LA size [25, 26].
While 2D echocardiography can detect overt LV and LA pathologies, it may be inadequate in the early stages. 3D-STE is considered a sensitive and effective technique for detecting left ventricular and left atrial involvement at the subclinical stage [27, 28]. In this study, we evaluated the LA and LV deformations of patients with a high PVC burden by 3D-STE.
Lie et al. found a significant moderate correlation between the number of PVCs and reduced GLS (R = 0.44, p = 0.002) [29]. This study emphasizes the importance of treating a small number of PVCs. In our study, similar to their work, we found that LV-GLS was significantly depressed in the PVC+ group (p = 0.015).
Detection of subclinical dysfunctions earlier in the LA plays an important role in the effective management of many cardiac diseases [30–34]. Barutcu et al. evaluated the effects of PVCs on LA function by using speckle tracking echocardiography (STE) with LA strain parameters and found that global peak atrial longitudinal strain (PALS) (38.39 ±7.93 vs. 44.15 ±6.71, p = 0.001) and peak atrial circumferential strain (PACS) (16.37 ±4.58 vs. 20.49 ±3.65, p < 0.001) were significantly lower and time to peak longitudinal strain (TPLS) (485.5 vs. 435.0, p < 0.001) was significantly longer in the PVC group [35]. In the current study, the LAS-r and LAS-active were significantly lower in the PVC+ group than in the control group (p < 0.001, p < 0.001, respectively). Also, we found that an LAS-r value of < 34.6 has 82.5% sensitivity and 67.4% specificity for the prediction of a high PVC burden (AUC = 0.618). The result of their study is compatible with ours, but we also evaluated LA function electrically by PWDAR.
Karacop et al. examined the role of P wave duration/P wave voltage, which is a novel index, in predicting new-onset AF [36]. They found P wave duration/P wave voltage to be a significant independent predictor of new-onset AF in the multivariate analysis. Since a high PVC burden is known to cause atrial cardiomyopathy, in our study, we investigated this novel index, which we named PWDAR (P wave duration-to-amplitude ratio), to predict a high PVC burden. We found that a PWDAR value of > 845 ms/mV has 87.9% sensitivity and 79.6% specificity for the prediction of a high PVC burden (AUC = 0.738). Also, in multivariate logistic regression analysis, PWDAR was found to be an independent predictor of a high PVC burden.
PWD, PWdisp, PWPT, and PWA are ECG indexes related to P wave, which may be linked to AF and its recurrence. Among the abovementioned indexes, PWdisp and PWD reflect discontinuous conduction and heterogeneity in the atrium. Numerous clinical studies have been published on PWdisp in various fields. Related studies are available to show that PWdisp is one of the most sensitive muscle-specific factors in ECG prediction of AF, and PWdisp also has a potential value in recurrence after AF ablation [37, 38]. Beside AF, a high PVC burden is known to cause left atrial remodeling. This left atrial remodeling causes prolongation of atrial conduction time and a decrease in voltage values, thus leading to prolongation of P wave duration and a decrease in P wave amplitude. In our study, the effect of a high PVC burden on P wave indices was investigated, and it was found that PWdisp and PWPT values were higher in the high PVC burden group than in the other group.
In a study, Lee et al. aimed to elucidate whether PVC burden is associated with new-onset AF [39]. Patients who were AF naive with PVC were divided into the low burden group (< 1000/day) and moderate-to-high burden group (≥ 1000/day) based on the 24-h Holter ECG report. New-onset AF was defined as a new or first detectable event of either a persistent or paroxysmal AF. The propensity score-matched analysis demonstrated that the moderate-to-high burden PVC group had a higher risk of developing new-onset AF than that of the low burden PVC group (4.91% vs. 2.73%, p < 0.001). Multivariate Cox regression analysis showed that moderate-to-high burden of PVC is an independent risk factor for new-onset AF. In a similar study, by Kim, it was found that the risk of new-onset AF and ischemic stroke was elevated in people with PVC [40]. It was suggested that additional evaluation to identify AF in people with PVC can be helpful. In fact, these studies show us that a high PVC burden causes and exacerbates atrial and ventricular cardiomyopathy [41]. If our study is followed up for a long time, it may be possible to observe AF developing in patients with a high PVC burden.
Electro-mechanical evaluation of the LA with more sensitive techniques is important when considering ischemic cardiovascular and cerebral events in patients with a high PVC burden. The results of our study demonstrated that PWDAR and left atrial strain parameters can predict PVC-induced atrial cardiomyopathy (PVC-ACMP).
This was a cross-sectional study with a limited number of patients (150). Left atrial strain echocardiographic examination was not performed after PVC ablation. As an advanced imaging modality, magnetic resonance imaging (MRI) was not used. Even if the patients are asymptomatic in terms of PVC, they are at risk for left ventricular and atrial dysfunction, just like symptomatic PVC patients. Large-scale studies can be planned for subclinical atrial and ventricular dysfunction in asymptomatic PVC patients.
Conclusions
3D-STE is beneficial for the early detection of LA mechanical dysfunction in these patient groups. PWDAR is a very valuable parameter in the early recognition of LA electrical dysfunction. Our results suggest that patients with a high PVC burden, despite being apparently healthy, may have subclinical LA mechanical and electrical dysfunction.


