
Introduction
Atherosclerosis is a chronic inflammatory disease characterized by the thickening and hardening of arteries due to plaque buildup, which consists of cholesterol, fatty substances, and cellular waste. This process disrupts blood flow and can lead to serious cardiovascular events such as heart attacks and strokes [1, 2]. This mechanism includes endothelial dysfunction, genetic factors, oxidative stress and inflammation [3, 4].
Subclinical atherosclerosis refers to the early stages of atherosclerosis in which structural changes occur in the blood vessels without causing noticeable symptoms. At this stage, fatty deposits (plaques) begin to accumulate in the arterial walls, but they do not yet cause significant narrowing or blockage leading to clinical signs such as chest pain (angina), heart attack, or stroke [5].
Clinical atherosclerosis refers to the symptomatic and advanced stage of atherosclerosis, in which the buildup of fatty plaques inside the arteries has progressed sufficiently to cause measurable blood flow restriction and lead to clinical events or symptoms [6].
Pre-diabetes type 2 is a metabolic condition characterized by blood glucose levels that are elevated above normal but below the diagnostic threshold for type 2 diabetes. It reflects impaired fasting glucose (IFG), impaired glucose tolerance (IGT), or elevated glycated hemoglobin (HbA1c), and indicates an increased risk for developing type 2 diabetes and cardiovascular disease [7].
Diabetes mellitus is a group of metabolic diseases characterized by chronic hyperglycemia resulting from defects in insulin secretion, insulin action, or both, the chronic hyperglycemia of diabetes is associated with long-term dysfunction, damage, and failure of various organs, especially the eyes, kidneys, nerves, heart, and blood vessels [8].
Type 2 diabetes mellitus (T2DM) is a chronic metabolic disorder characterized by insulin resistance, inadequate insulin secretion, and hyperglycemia. It is the most prevalent form of diabetes, accounting for over 90% of all diabetes cases [9, 10]. T2DM is a significant risk factor for atherosclerosis due to its association with insulin resistance, endothelial dysfunction, and systemic inflammation, all of which contribute to the development and progression of atherosclerosis [11, 12]. The increase in blood glucose is associated with insulin resistance, since there is an inverse correlation between insulin resistance and cell function [13, 14].
Endothelin-1 (ET-1) is a powerful vasoconstrictive peptide mainly synthesized by endothelial cells. It plays a key role in controlling vascular tone and maintaining endothelial function. ET-1 also participates in numerous physiological and pathological processes, such as cardiovascular regulation, skin disorders, and autoimmune conditions [15]. Increased levels of ET-1 have been detected in individuals with essential hypertension and in young obese patients experiencing acute myocardial infarction. Elevated ET-1 concentrations are also associated with a greater number of foam cells in the aorta, which serve as an indicator of early-stage atherosclerosis [16]. Nitric oxide synthase (NOS) refers to a group of enzymes that catalyze the production of nitric oxide from the amino acid L-arginine. These enzymes play a vital role in multiple physiological functions, such as the regulation of vascular tone through vasodilation, modulation of neurotransmission, and mediation of immune responses [17, 18].
NOS is critically involved in the pathogenesis of atherosclerosis, a chronic inflammatory condition marked by plaque accumulation within arterial walls. There are three distinct isoforms of NOS: endothelial (eNOS), neuronal (nNOS), and inducible (iNOS), each playing a unique role in the disease mechanism. Among them, eNOS is chiefly responsible for generating nitric oxide (NO) in healthy endothelial cells, facilitating vasodilation and maintaining vascular homeostasis [17, 19].
Aim
The objective of the current study was to investigate the role of eNOS and endothelin in the pathogenesis of clinical and subclinical atherosclerosis.
Material and methods
This cross-sectional study included 90 males with an age range of 20 to > 60 and mean age of 33.00 ±6.131. They were divided into 45 patients with clinical coronary atherosclerosis and mean of age 34.500 ±4.949 and 45 patients with sub-clinical coronary atherosclerosis and mean of age of 32.250 ±7.228. The study was conducted to evaluate clinical and sub-clinical coronary atherosclerosis in males in relation to diabetes type 2 in Karbala, Iraq. Diabetes can be classified into three main categories: non-diabetes (normal), prediabetes, and diabetes [20]. The data were collected and recorded from September 2024 to December 2024 at the Imam Hussein Karbala Center for Heart Diseases and Surgery Teaching Hospital. Diseases were diagnosed through laboratory tests and monitoring for clinical symptoms. All patients were diagnosed by a coronary angiography scan by a cardiologist in addition to collecting information from each group according to the questionnaire [21]. The study applied the following exclusion criteria: All female patients were excluded, as well as males with any history of endocrine disease other than type 2 diabetes. Also excluded were male patients with a recent history of infection within the past 2 months, kidney disease, males with any type of liver disease, cancer, chronic pancreatitis, those who had undergone pancreatectomy, or those who abused alcohol. The inclusion criteria were male sex and presence of clinical or sub-clinical coronary atherosclerosis.
Rationale for including only male patients
This study included only male patients to minimize biological variability and enhance result interpretation. Female sex hormones, particularly estrogen and progesterone, significantly influence vascular physiology, inflammation, and endothelial function, thereby affecting biomarkers such as endothelin-1 and eNOS. Including only males reduces hormonal confounding and increases internal validity.
Five milliliters of venous blood were collected from each fasting patient through venipuncture using sterile syringes. Each sample was labeled with a unique identification number (ID) assigned by the laboratory information system. To assess hematological parameters, including HbA1c, 2 ml of blood were transferred into an EDTA tube containing ethylene diamine tetraacetic acid to prevent coagulation. For fasting blood glucose analysis, the remaining 3 ml were placed into a plain gel tube and allowed to clot for serum separation. The clotted samples were then centrifuged at 4000 rpm for 10 minutes.
Serum insulin levels were measured using a Sandwich ELISA kit (Elabsciences, Wuhan, China). HbA1c was measured using an automated chemistry analyzer (Cobas Integra 400 plus) with a kit from OSN, Korea. Lipid profile was assessed using a kit from Linear Chemicals S.L., Spain, measured by the enzymatic colorimetric method technique.
Serum endothelin-1 and endothelial nitric oxide synthase levels were determined using enzyme-linked immunosorbent assay (ELISA). Fasting and random blood glucose levels were measured using a glucometer (One Call Plus device). HbA1c was also measured using a spectrophotometer according to the manufacturer’s instructions.
Homeostatic Model Assessment of Insulin Resistance (HOMA-IR) was calculated using the following formula: HOMA-IR = fasting plasma insulin (μU/ml) × fasting plasma glucose (mg/dl)/405) [22].
Endothelial nitric oxide synthase ELISA kit
This kit operates on the sandwich ELISA principle. This includes a microplate pre-coated with an antibody that specifically recognizes human NOS3 (also known as eNOS).
Endothelin-1 (ET-1) ELISA kit
This kit is based on the Sandwich ELISA method. Each microplate well is pre-coated with an antibody specific to human ET-1. When samples or standards are added, they bind to this specific antibody. Next, a biotin-labeled detection antibody for human ET-1 is added, followed by an Avidin-Horseradish Peroxidase (HRP) conjugate. After incubation, unbound components are washed away. A substrate solution is then introduced into the wells. A blue color develops only in wells where human ET-1, the biotinylated detection antibody, and the Avidin-HRP conjugate are present.
Statistical analysis
Statistical analysis was carried out using IBM SPSS Statistics software, version 23. Descriptive statistics were employed to summarize the data, including the calculation of means and standard deviations. A significance level of 0.05 was adopted to determine the statistical relevance of the findings. The normality of the data distribution was assessed using the Shapiro-Wilk test, while homogeneity of variance was evaluated with Levene’s test. To examine relationships between categorical and continuous variables, χ2 tests and Pearson correlation coefficients were used. Comparisons between two independent groups were performed using either the independent samples t-test or the Mann-Whitney U test, depending on data distribution. For comparisons involving more than two groups, one-way analysis of variance (ANOVA) was applied, followed by Scheffé’s post-hoc test to identify pairwise differences. Additionally, receiver operating characteristic (ROC) curve analysis was used to determine optimal cut-off values for identifying critical cases. The area under the curve (AUC) indicated the predictive power, and Youden’s index was applied to select the most effective threshold. Statistically significant results at the 0.01 level were denoted with asterisks.
Sample size determination
In order to determine an appropriate and statistically valid sample size for this cross-sectional study, the finite population correction (FPC) method was applied. This approach is particularly suitable when the total population is known and not extremely large (typically under a few million), as is the case in this study. The target population is the general population of Karbala city, which has an estimated population of 800,000 individuals. The sample size calculation was based on the following formula according to Cochran [23]:
Estimated prevalence (p) of atherosclerosis in the general population: 6% (0.06),
Confidence level: 95%, which corresponds to a Z-score of 1.96,
Margin of error (e): 5% (0.05),
Population size (N): 800,000 individuals.
The following finite population correction formula was used to calculate the sample size:
Substituting the values into the formula:
Therefore, the final required sample size for this study is approximately 87 individuals. This sample size is expected to provide a statistically reliable estimate of the prevalence of atherosclerosis in the general population of Karbala with a 95% confidence level and a 5% margin of error.
Results
The results demonstrated a marked decrease in several metabolic and vascular biomarkers – including random glucose, insulin, HOMA-IR, HbA1c, C-peptide, and endothelin – in patients with sub-clinical atherosclerosis when compared to those with clinical atherosclerosis. In contrast, patients with clinical atherosclerosis exhibited elevated levels of these markers, reflecting greater metabolic dysfunction and vascular impairment. Although fasting plasma glucose levels appeared higher in the clinical group, this increase was not statistically significant. Notably, endothelial nitric oxide synthase (eNOS) levels were significantly elevated in the sub-clinical group, suggesting preserved endothelial function in earlier stages of atherosclerotic disease.
Furthermore, the results showed a significant increase (p ≤ 0.01) in total cholesterol, triglycerides, low-density lipoprotein (LDL), and very-low-density lipoprotein (VLDL) levels in clinical atherosclerosis patients, with mean values of 247.170 ±28.155 mg/dl, 249.431 ±20.182 mg/dl, 156.089 ±27.699 mg/dl, and 49.886 ±4.036 mg/dl, respectively. In comparison, sub-clinical patients had lower values of 197.785 ±19.577 mg/dl, 208.802 ±20.866 mg/dl, 96.370 ±19.841 mg/dl, and 41.760 ±4.173 mg/dl, respectively. Conversely, high-density lipoprotein (HDL) levels were significantly higher in sub-clinical patients (59.654 ±9.309 mg/dl) compared to clinical patients (41.195 ±8.828 mg/dl), indicating impaired lipid metabolism in the clinical group.
Regarding demographic factors, endothelin levels were consistently lower in sub-clinical patients across all groups. For the age category 40–59 years, the mean values were 7.411 ±0.939 in sub-clinical versus 20.540 ±6.233 in clinical patients; in the 60–79 age group, 7.718 ±0.801 versus 19.050 ±4.093, respectively. In patients without a family history, endothelin averaged 7.503 ±0.673 in sub-clinical versus 18.855 ±4.599 in clinical cases, while in those with a family history, the values were 7.576 ±0.962 versus 20.003 ±5.267. Non-smokers showed values of 7.679 ±0.782 in sub-clinical compared to 18.555 ±4.460 in clinical patients, whereas smokers had a value of 7.519 ±0.915 versus 19.999 ±5.233. Finally, among rural patients, the means were 7.719 ±0.914 in sub-clinical compared to 19.931 ±3.972 in clinical patients, while among urban patients, they were 7.434 ±0.855 versus 19.456 ±5.715, respectively, as shown in Table I.
Table I
Biochemical and demographic comparison between subclinical and clinical atherosclerosis patients
[i] HOMA-IR – Homeostatic Model Assessment for Insulin Resistance, HbA1c – glycated hemoglobin, eNOS – endothelial nitric oxide synthase, LDL – low-density lipoprotein, HDL – high-density lipoprotein, VLDL – very low-density lipoprotein, SD – standard deviation, P-value – probability value; p < 0.05 is considered statistically significant.
The results demonstrated a significant decrease (p ≤ 0.01) in relation to subclinical age groups, family history, smoking state, and area. The value 812.657 ±288.275 was observed in the non-diabetic group, and 830.756 ±337.653 in the diabetic group. The non-smoking group value was 876.054 ±289.181, whereas the smoking group value was 811.091 ±332.066. The value 785.300 ±356.214 was observed for the rural area group and 854.925 ±296.469 for the urban. For clinical atherosclerosis patients, the value 315.818 ±69.039 appeared for the age group 40–59 and 288.620 ±47.243 for the age group 60–79. The non-diabetic group, the value was 18.855 ±4.599, and the value was 299.368 ±55.086 for the diabetic group. The value of the non-smoking group was 298.613 ±52.850, whereas in smokers, it was 299.785 ±60.077. In the rural group, the value was 292.161 ±56.703, while in urban patients, it was 304.391 ±59.087 (Table II).
Table II
Comparison of demographic parameters between subclinical and clinical atherosclerosis patients
Demographic categories
Age group: 40–59 and 60–79 years. Family history: Presence or absence of family history of diabetes mellitus disease. Smoking state: Smoker or non-smoker. Address area: Rural or urban residence
The results demonstrated a significant reduction in cholesterol, triglycerides, LDL, and VLDL levels (p ≤ 0.01) in subclinical atherosclerosis patients across non-diabetic, pre-diabetic, and diabetic groups. The values were 198.964 ±23.844, 189.877 ±5.378, 200.854 ±17.682, 213.597 ±17.440, 200.355 ±24.085, 209.429 ±21.290, 94.579 ±24.995, 93.241 ±17.816, 99.279 ±16.865, 40.071 ±4.817, and 41.886 ±4.258, respectively. Meanwhile, the values for clinical atherosclerosis patients were 252.036 ±20.884, 249.010 ±29.543, 245.529 ±29.634, 238.369 ±32.163, 253.307 ±22.472, 250.383 ±16.141, 157.337 ±19.156, 156.083 ±31.249, 155.833 ±28.738, 50.661 ±4.494, and 50.077 ±3.228, respectively. On the other hand, the results showed a significant increase in HDL cholesterol (p ≤ 0.01) in subclinical atherosclerosis patients across non-diabetic, pre-diabetic, and diabetic groups. The values were 61.666 ±8.281, 56.565 ±9.784, and 59.689 ±9.784, respectively. However, the values for the atherosclerosis patients were 47.025 ±6.061, 42.266 ±9.687, and 39.619 ±8.688, respectively, as shown in Table III.
Table III
Comparison of serum concentration of lipid profile in clinical and sub-clinical atherosclerosis patients according to classification of diabetes mellitus groups
The results demonstrated a significant decrease (p ≤ 0.01) in random glucose and C-peptide in non-diabetic, pre-diabetic, and diabetic groups. Also, decreases were observed in insulin, HOMA-IR, e NOS, and endothelin in diabetics in sub-clinical atherosclerosis patients. The values were 116.678 ±13.350, 124.618 ±14.638, 0.791 ±0.087, 40.023 ±12.081, 41.681 ±8.209, 7.331 ±0.893, 7.834 ±0.954, and 7.583 ±0.835, respectively. On the other hand, the clinical atherosclerosis patients’ values were 183.001 ±35.115, 223.577 ±41.827, 2.383 ±1.048, 119.324 ±38.916, 129.894 ±25.464, 18.387 ±2.494, 17.344 ±3.984, and 20.700 ±5.514, respectively. Moreover, the results showed significantly higher eNOS (p ≤ 0.01) in sub-clinical atherosclerosis patients in non-diabetic, pre-diabetic, and diabetic groups (843.633 ±335.962, 681.600 ±367.246, and 883.913 ±277.233, respectively) as compared to clinical atherosclerosis patients (316.962 ±55.220, 308.449 ±54.051, and 292.799 ±60.230), as shown in Table IV.
Table IV
Comparison of serum concentration of glucose parameters in clinical and sub-clinical atherosclerosis patients according to classification of diabetes mellitus groups
[i] Fasting plasma glucose [mg/dl] – blood sugar level after fasting, measured in milligrams per deciliter, Random glucose [mg/dl] – blood sugar level measured at any time, mg/dl, Insulin [μIU/ml] – insulin concentration in micro-international units per milliliter, HOMA IR – Homeostatic Model Assessment of Insulin Resistance (unitless index), HbA1c [mmol/mol] – glycated hemoglobin, reflecting average blood sugar over 2–3 months, in mill moles per mole, C-peptide [pg/ml] – C-peptide concentration in picograms per milliliter (marker of insulin production), eNOS [pg/ml] – endothelial nitric oxide synthase concentration in pg/ml, Endothelin [pg/ml] – endothelin concentration in pg/ml, No diabetes – normal glucose regulation group, Pre diabetes – impaired glucose regulation before diabetes onset, Diabetes – diagnosed diabetic group.
The results of the present study showed no significant difference (p > 0.05) in BMI, systolic blood pressure, and diastolic blood pressure levels for sub-clinical atherosclerosis patients (57.044 ±14.675; 28.092 ±4.189; 0.900 ±0.050; 0.553 ±0.083; 123.600 ±19.660; 81.511 ±17.370, respectively) as compared to clinical atherosclerosis patients (60.467 ±11.014; 29.255 ±5.120; 0.904 ±0.028; 0.531 ±0.057; 130.200 ±21.315; 82.978 ±14.249).
The distribution of body mass index (BMI) categories among subclinical and clinical groups showed no statistically significant difference (p = 0.71916). In the subclinical group, 26.7% of individuals were classified as having normal BMI, 33.3% were overweight, and 40.0% were obese. Similarly, in the clinical group, 20.0% had normal BMI, 33.3% were overweight, and 46.7% were obese. Overall, the total population consisted of 23.3% with normal BMI, 33.35% overweight, and 43.3% obese, as shown in Table V.
Table V
Comparison of body mass index and hypertension between clinical and subclinical atherosclerosis patients
| Parameters | Group | Subclinical | Clinical | Total | P-value |
|---|---|---|---|---|---|
| BMI Group | Normal | 12 26.7% | 9 20.0% | 21 23.3% | 0.71916 |
| Overweight | 15 33.3% | 15 33.3% | 30 33.35% | ||
| Obese | 18 40.0% | 21 46.7% | 39 43.3% |
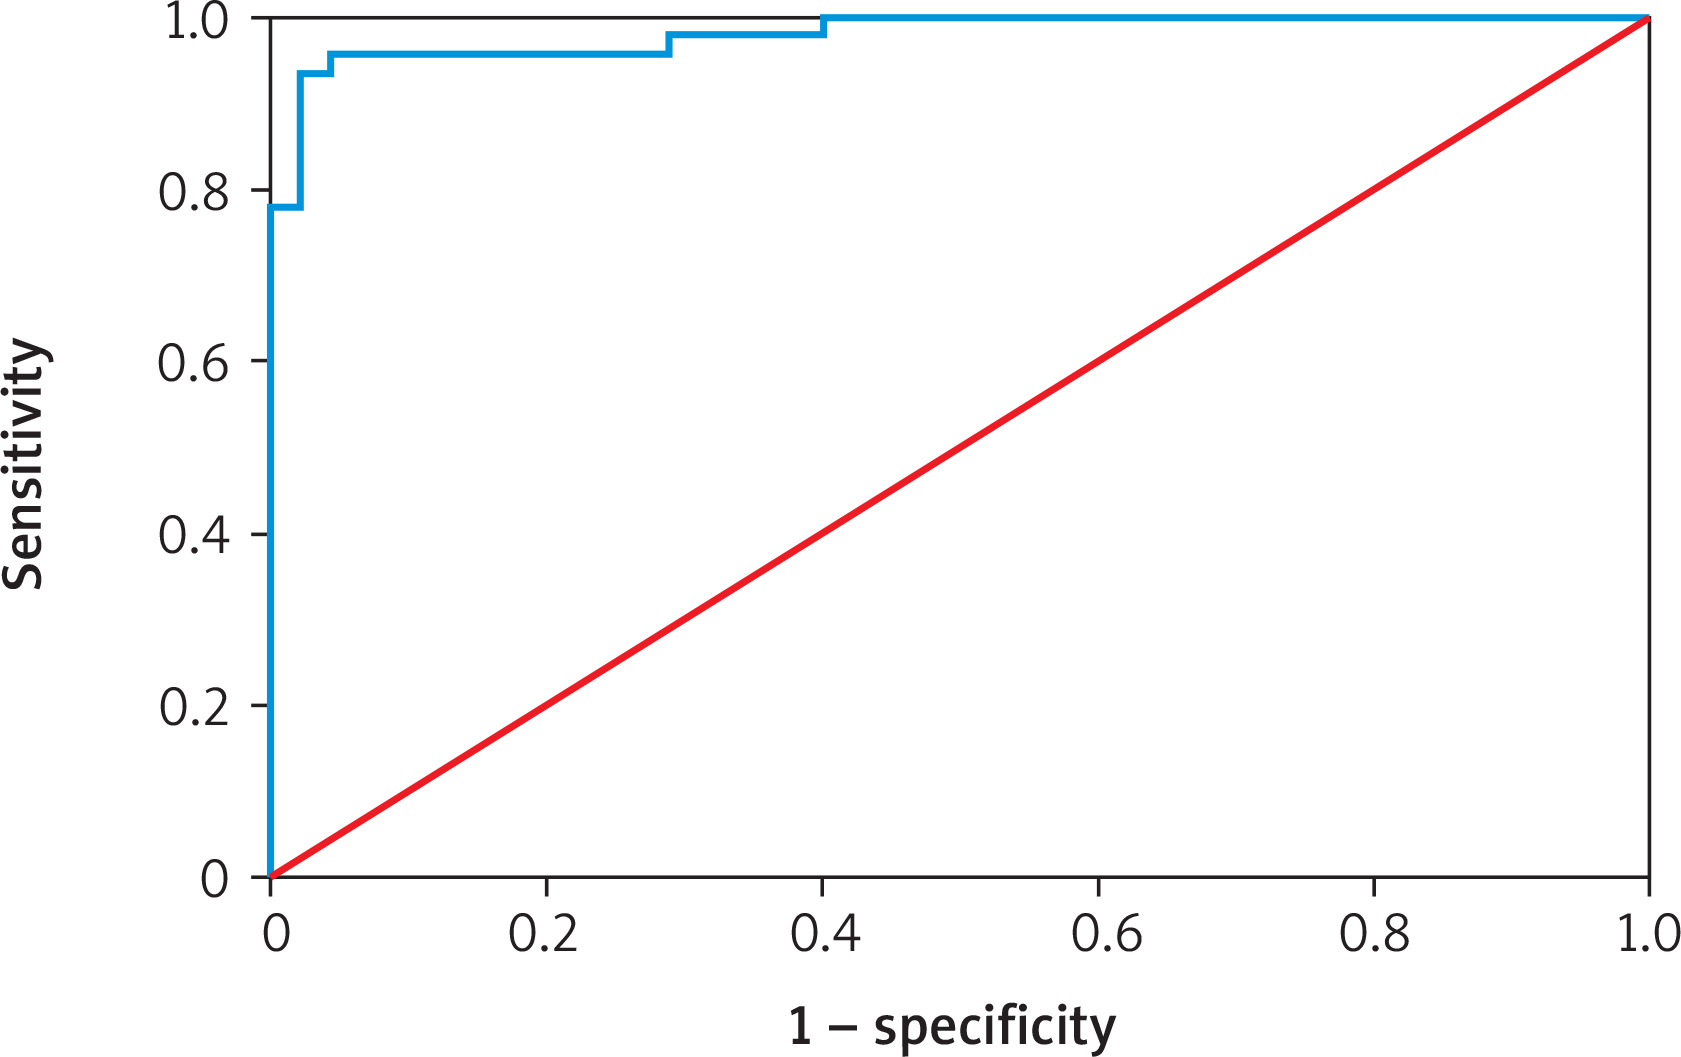
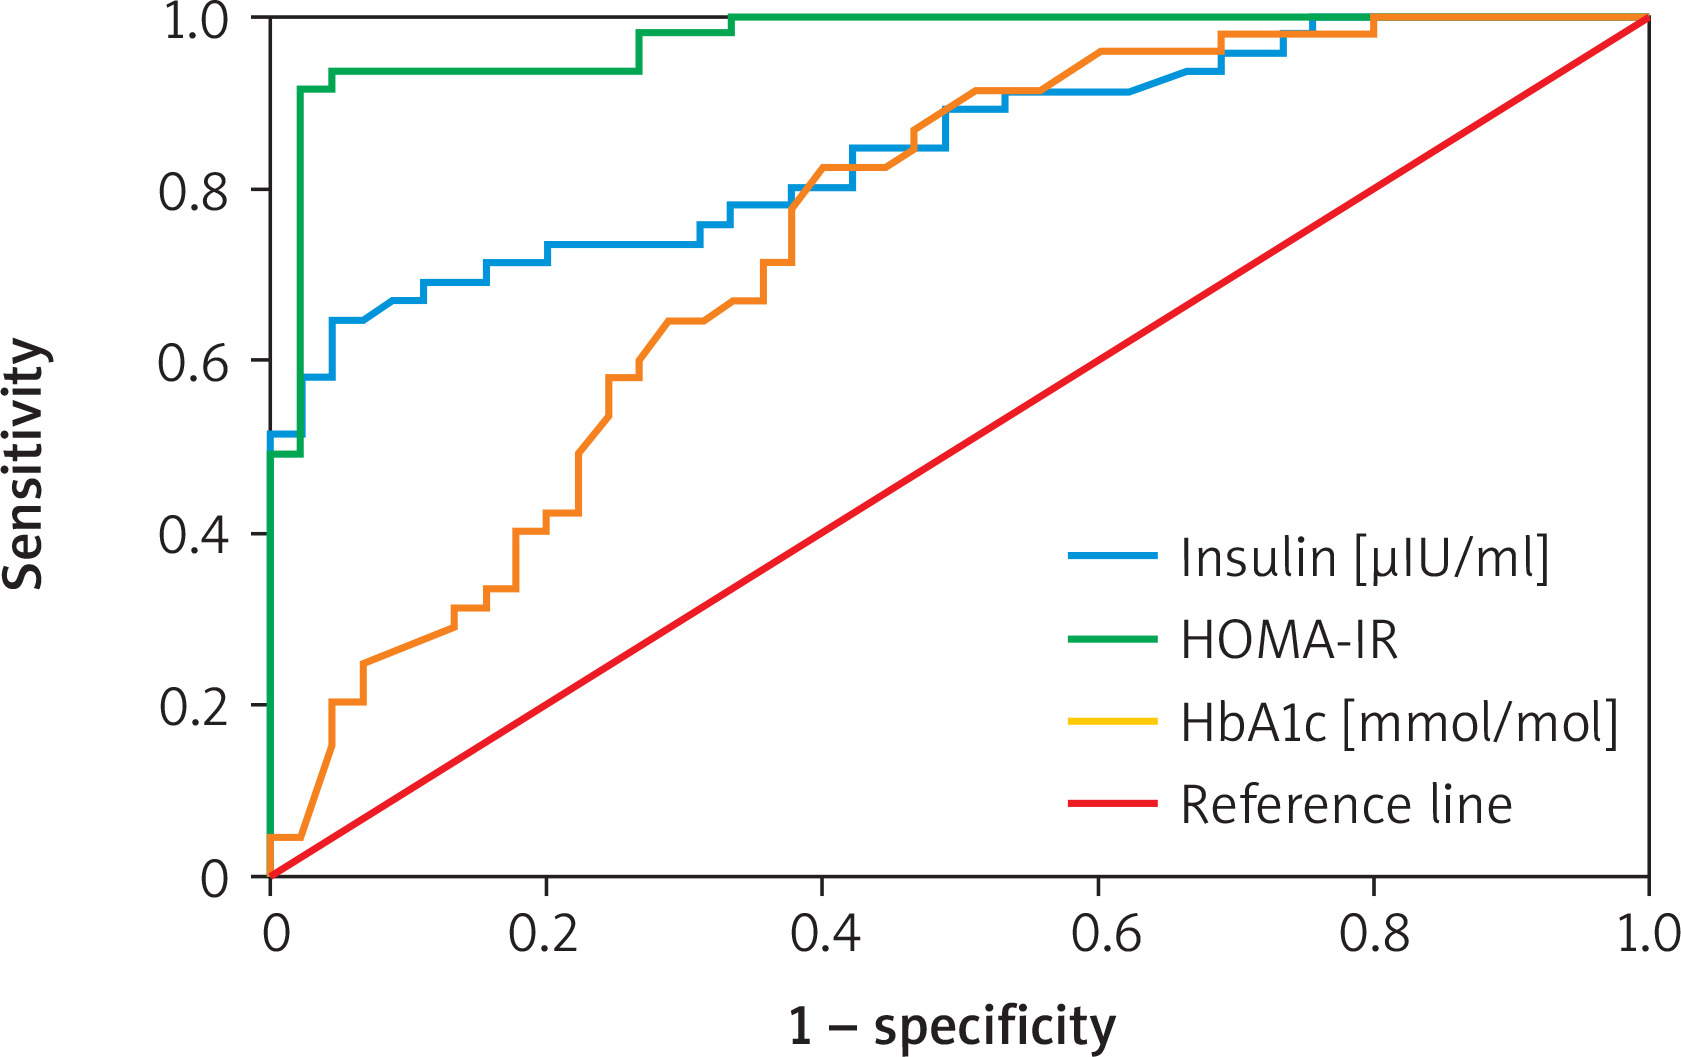
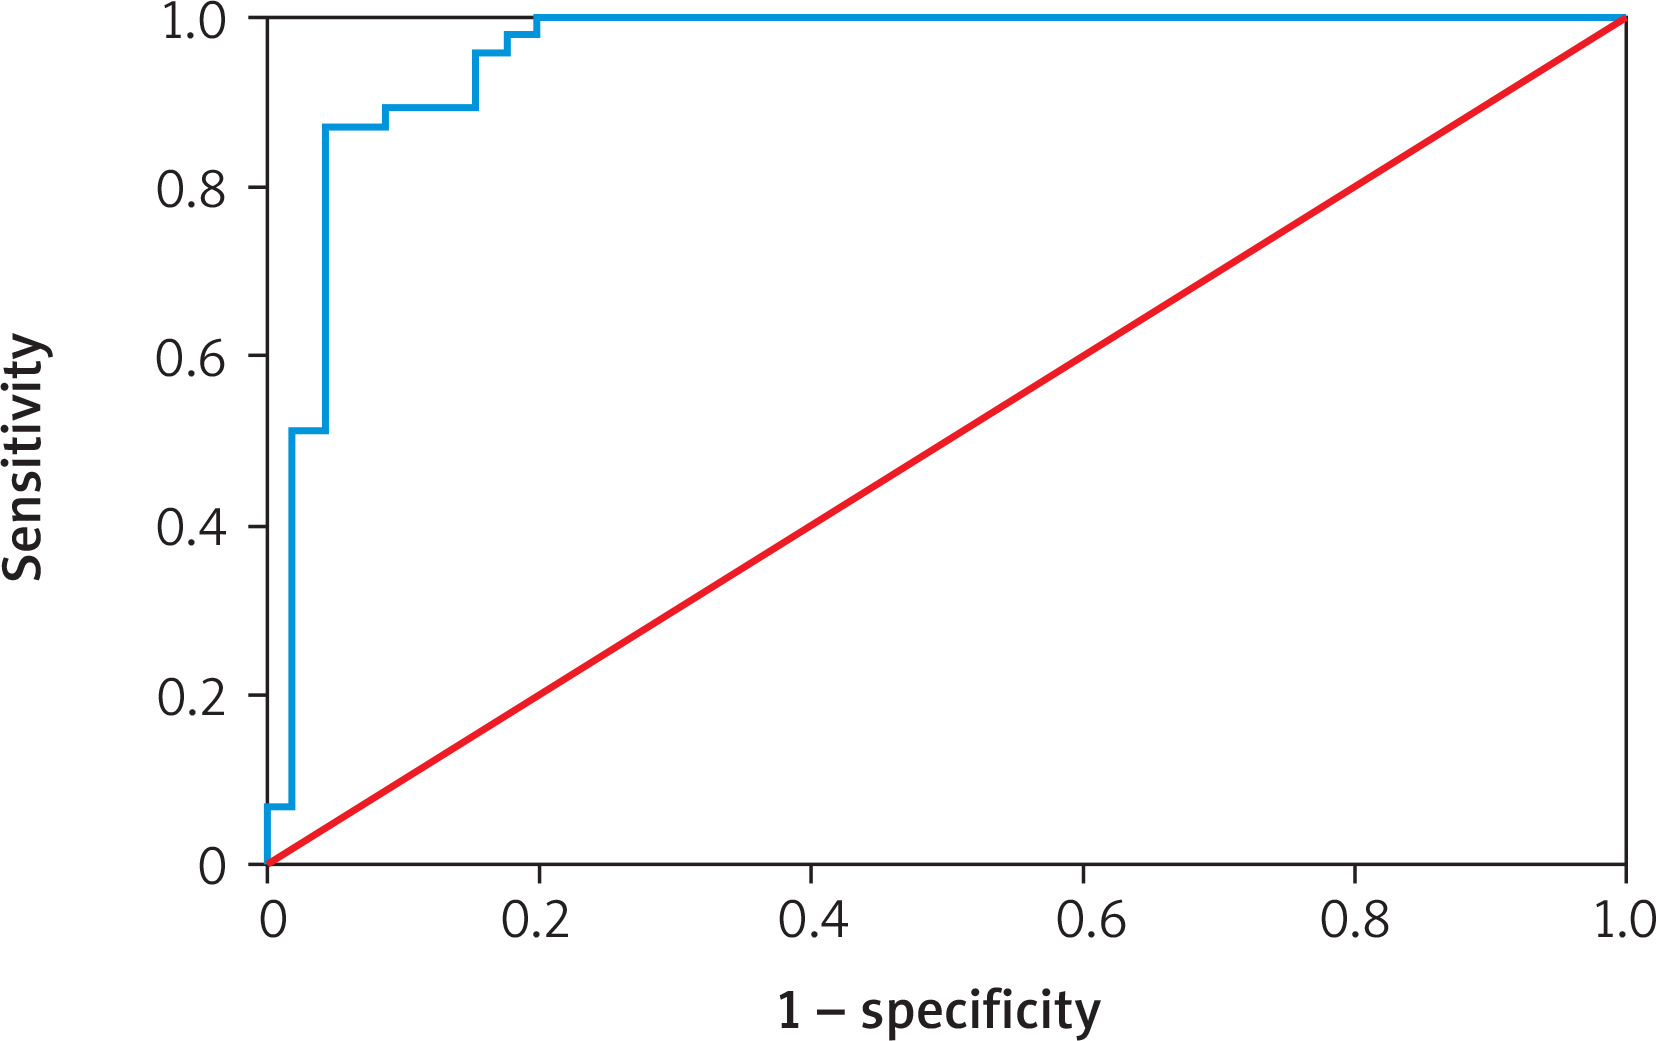
Table VI shows the diagnostic performance of various biomarkers for predicting atherosclerosis. Endothelin-1 had an AUC of 98.03% (95% CI: 0.906–1.000; p = 0.001) with a cutoff point of 10.189, sensitivity of 95.53%, specificity of 95.56%, and overall accuracy of 95.56%. eNOS showed an AUC of 95.36% (95% CI: 0.906–1.000; p = 0.001), cutoff 379.264, sensitivity 86.67%, specificity 95.56%, and accuracy 91.11%. Insulin had an AUC of 84.57% (95% CI: 0.939–1.000; p = 0.001) with a cutoff of 2.793, sensitivity 71.11%, specificity 84.44%, and accuracy 77.78%. HOMA-IR demonstrated an AUC of 97.04% (95% CI: 0.573–1.000; p = 0.001), cutoff 0.991, sensitivity 91.11%, specificity 97.78%, and accuracy 94.44%. Finally, HbA1c recorded an AUC of 68.37% (95% CI: 0.573–1.000; p = 0.001), cutoff 7.350, sensitivity 71.11%, specificity 60.00%, and accuracy 65.56% (Figures 1–3).
Table VI
Receiver operation characteristic (ROC) curve for evaluation diagnostic, accuracy and predictive value for atherosclerosis biomarkers
[i] Std. error – standard error, Asymptotic Sig. – asymptotic significance (p-value from ROC analysis), AUC – area under the curve, Sensitivity – ability of the test to correctly identify positives, Specificity – ability of the test to correctly identify negatives, Accuracy – overall diagnostic correctness.
Figure 1
ROC curve analysis of predictive accuracy of endothelin [pg/ml] for atherosclerosis detection
Discussion
In patients with clinical atherosclerosis, levels of fasting glucose, HbA1c, HOMA-IR, and insulin were significantly higher compared to those with subclinical atherosclerosis. This elevation is largely attributable to increased insulin resistance and chronic hyperglycemia, which impair cellular glucose uptake and result in elevated blood glucose concentrations. The metabolic disturbances are more severe in clinical atherosclerosis, where systemic inflammation and endothelial dysfunction further compromise glycemic regulation. Together, these pathological mechanisms contribute to the progression from subclinical to clinical stages of atherosclerosis [24, 25]. A meta-analysis of observational studies demonstrated that elevated HOMA-IR levels are significantly correlated with a greater prevalence and progression of coronary artery calcification (CAC), which serves as an indicator of atherosclerotic burden [23, 26]. While this study published in Diabetes Care suggested that while insulin resistance, as measured by HOMA-IR, is associated with coronary artery calcification, it does not provide additional predictive value beyond traditional risk factors such as metabolic syndrome components [27, 28].
Elevated lipid profiles (excluding HDL) are more pronounced in clinical atherosclerosis because the disease is more advanced, with longer and more intense exposure to atherogenic lipids such as LDL and triglycerides. HDL levels are typically lower in clinical atherosclerosis compared to subclinical cases due to the greater disease burden, chronic inflammation, and oxidative stress associated with advanced stages of the disease [10, 29]. Clinical stages involve greater inflammation, metabolic disruption, and more harmful lipid particle types, often alongside comorbidities such as diabetes or obesity. These factors contribute to higher lipid levels compared to subclinical (early, asymptomatic) atherosclerosis [17, 18].
Aging, smoking, and diabetes independently and synergistically contribute to endothelial dysfunction through mechanisms such as reduced nitric oxide production, increased oxidative stress, and chronic inflammation. Addressing these risk factors through lifestyle modifications and medical interventions is crucial in maintaining vascular health and preventing cardiovascular diseases [30–33].
Nitric oxide (NO) levels tend to decrease with age, smoking, and diabetes. Nitric oxide production decreases with age due to reduced endothelial cell efficiency and increased oxidative stress, which breaks down. Smoking damages endothelial cells and increases oxidative stress, impairing NO production, increasing inflammation, and further reducing NO levels. In diabetes, high blood sugar and oxidative stress damage endothelial cells, impairing NO production. Additionally, insulin resistance exacerbates this issue [34, 35]. These factors impair vascular health and promote atherosclerosis [36].
Conclusions
In clinical atherosclerosis, elevated glucose, HbA1c, insulin, and HOMA-IR levels reflect greater insulin resistance and systemic inflammation. Lipid imbalances – such as reduced HDL and increased LDL and triglycerides – are more evident as the disease advances. Factors such as aging, smoking, and diabetes further impair endothelial function by lowering nitric oxide availability and increasing oxidative stress. These combined effects drive disease progression, emphasizing the need for early intervention and management of risk factors.