
Introduction
Nonalcoholic fatty liver disease (NAFLD) is the most common chronic liver disease in children in developed countries [1]. The estimated prevalence of NAFLD in children varies from 7.6% in the general population to 34.2% in obese patients [2].
The spectrum of disorders from the fatty liver disease group extends from simple steatosis, nonalcoholic fatty liver (NAFL) to nonalcoholic steatohepatitis (NASH) with the presence of injury, inflammation, and fibrosis of the liver tissue. The diagnosis of NAFLD is based on histopathological or imaging testing in the absence of other causes leading to liver damage (e.g., alcohol intake, drug poisoning, viral hepatitis, metabolic diseases) [3]. Liver biopsy remains the gold standard of definitive diagnosis (steatosis involving > 5% of hepatocytes); however, because of its invasive character and possible complications it is unacceptable as an initial diagnostic tool. It is not suitable for repeated long-term monitoring in children.
In children, life-threatening complications of NAFLD are rare, but it is essential to emphasize that other conditions associated with chronic liver disease or metabolic syndrome can increase overall mortality in adulthood. The studies of the natural history of patients with NAFLD revealed that fibrosis is an independent predictive factor of liver-related mortality [4]. Over the past years, scientists have attempted to create a universal tool allowing for repetitive long-term non-invasive diagnostics, including fibrosis assessment, using primary laboratory and imaging tests or new biochemical markers.
According to published reports, markers used in adults may not be suitable for children and adolescents [5].
A model based on age, waist circumference and triglyceride (pediatric NAFLD fibrosis index – PNFI) was found to be inadequately useful [6]. Therefore the pediatric NAFLD fibrosis score (PNFS) was developed in 2014 [7]. The authors created a new model based on alanine aminotransferase (ALT), alkaline phosphatase, platelets (PLT) and γ-glutamyltransferase (GGT); AUROC was 0.74 (95% CI: 0.66-0.82) – higher than AUROC for APRI (aspartate transaminase [AST] to platelet ratio index), NAFLD fibrosis score, and FIB-4 (fibrosis-4) index.
This study aimed to assess the clinical usefulness of noninvasive markers of fibrosis in children with NAFLD in daily care.
Material and methods
Patients
Forty-nine children with NAFLD aged 3-16 years (mean 10.51 ±3.18 years) who visited the Hepatology Outpatient Clinic at the Department of Infectious Diseases and Child Neurology were consecutively recruited to this study. The diagnosis of NAFLD was based on the clinical picture, abdominal ultrasound, necessary laboratory tests (elevated liver function tests) and, in individual cases, liver biopsy. In differential diagnosis viral hepatitis (type B, C, Epstein-Barr virus and cytomegalovirus infection), autoimmune hepatitis, α1-antitrypsin deficiency, hemochromatosis, celiac disease, Wilson disease and alcohol intake were considered. In children younger than 5 years, inborn errors of metabolism were excluded [8]. Diagnosis of liver diseases in the differential diagnosis mentioned above was the study exclusion criterion. Table 1 summarizes the clinical characteristics of the study group.
Table 1
Characteristics of the group
Nonalcoholic fatty liver (NAFL) was defined as hyperechogenicity of the liver ultrasound and absence of alcohol consumption and concomitant diseases included in the differential diagnosis list.
For further analysis, patients were divided into four groups: HAO (group with elevated serum ALT and obesity), HAL (lean patients with elevated ALT), NAO (patients with ALT below upper limit of normal [ULN] and obesity) and NAL (lean patients without elevation of serum ALT level).
Obesity was defined as a body mass index (BMI) higher than the 97th percentile for the child’s age and sex, overweight as BMI between the 90th and 97th percentiles. Weight was measured on an electronic digital scale, with 150 kg capacity and 10 γ accuracy. Height was measured with a 2 m vertical wall stadiometer graduated in millimeters. The measurements were performed following recommended procedures.
Data collection
Anthropometric data of the participants, including weight, height, waist circumference, and hip circumference, were collected. A blood sample following 8-10 hours fasting was obtained to assess complete blood count, fasting blood sugar, insulin level, ALP and ASP (ALT normal value < 12 years old: boys < 40 IU/l, girls < 35 IU/l, > 12 years old: boys < 26 IU/l, girls < 22 IU/l), GGT (normal value 4-24 IU/l) and serum lipid profile.
Complete blood count (CBC), glucose and insulin levels, ALT, AST, GGT and serum lipid levels were determined on a standard laboratory analyzer.
HOMA-IR (homeostatic model assessment) index was calculated using the formula [9]: HOMA-IR = [insulin (U/ml) * glucose (mg/dl)]/405. The cutoff point for HOMA-IR was 2 [10, 11].
Noninvasive hepatic fibrosis scores
APRI was calculated as AST/ULN platelets (G/L) * 100 [12]. The cutoff point indicating fibrosis was 0.5, while a cut-off of 1.5 may indicate severe risk of liver cirrhosis [13]. Formula: FIB-4 = (age * AST)/[platelet (G/L) * √ALT] was used for FIB-4 index calculation [14]. Pediatric NAFLD fibrosis score (PNFS) was calculated using the following formula:
PNFS (probability distribution) = [eZ/1 + eZ] * 100;
z = 1.1 + (0.34 * √ALT) + (0.002 * alkaline phosphatase) – (1.1*log (platelets G/l)) – (0.02 * GGT) [8].
The risk of the presence of fibrosis was estimated by this parameter, and patients were divided into groups with and without the risk of fibrosis (F) – PNFS between 13 and 24 (equivalent to estimated F ≥ 2) and severe fibrosis (SF) – PNFS higher than 24 (equivalent to F3-F4) [8].
Invasive diagnostics
Biopsy specimens were taken in 4 children with suspicion of the most progressed liver injury in local anesthesia using Menghini needle (Braun). The specimens were evaluated by pathologists blinded for history and clinical data.
Ultrasonography
All examinations were performed by an experienced radiologist on a Toshiba Aplio i700 and Esaote MyLab Twice. Results were based on four hallmarks of liver steatosis: echogenicity of the liver, visualization of the diaphragm, intrahepatic vessels and posterior part of the right liver lobe.
Statistical analysis
Data were presented as the mean ± standard deviation (SD). Student’s t text or the Mann-Whitney test was used to compare continuous variables, where appropriate. Moreover, Pearson’s χ2 test was applied to categorical variables. Fisher’s exact test was used in the analysis of contingency tables. The Kruskal-Wallis test was used for testing whether samples originate from the same distribution. Correlations were performed using the Spearman rank correlation test. For all tests, a p-value of < 0.05 was considered statistically significant. STATISTICA (version 13, TIBCO Software Inc., Palo Alto, USA) was used for all analyses.
Results
In the study group, 35 (71.43%) of patients were obese, and 7 (14.29%) were overweight. There were no statistically significant differences between overweight and lean patients regarding laboratory parameters and fibrosis markers except lower mean corpuscular volume (MCV, p = 0.034) found in overweight patients. ALT activity exceeded ULN in both groups of patients. Higher AST was observed in lean patients only. No statistically significant difference was observed regarding these parameters. There were no statistically significant difference in PNFS, APRI and FIB-4 between lean and overweight patients (Table 2).
Table 2
Comparison of laboratory parameters and noninvasive hepatic fibrosis scores in overweight and lean patient groups
[i] BMI – body mass index, HGB – hemoglobin, HCT – hematocrit, MCV – mean corpuscular volume, WBC – white blood cells, PLT – platelets, ALT – alanine aminotransferase, AST – aspartate aminotransferase, LDL – low-density lipoprotein, HDL – high-density lipoprotein, TG – triglycerides, APRI – AST to platelet ratio, FIB-4 – fibrosis-4 index, PNFS – pediatric NAFLD fibrosis score
Furthermore, the group of patients with a risk of fibrosis assessed according to the PNFS index was compared to the group without such a risk (F vs. no F). Significantly higher aminotransferase and GGT activity were observed in the group with fibrosis (n = 11), while triglyceride (TG) levels were lower in this group compared to children without risk of fibrosis. Moreover, APRI and FIB-4 values were also significantly higher in the group with a risk of fibrosis (Table 3). Mean APRI value exceeds the cut-off of 0.5. Similar observations in groups with and without risk of fibrosis (PNFS ≥ 24, n = 4) were made regarding aminotransferase and GTT activity (Table 4). However, only APRI differed significantly between these groups, with a mean value exceeding 1.
Table 3
Comparison of clinical and laboratory parameters and noninvasive hepatic fibrosis scores in groups of patients with and without a risk of fibrosis (PNFS ≥ 13)
[i] BMI – body mass index, HGB – hemoglobin, HCT – hematocrit, MCV – mean corpuscular volume, WBC – white blood cells, PLT – platelets, ALT – alanine aminotransferase, AST – aspartate aminotransferase, LDL – low-density lipoprotein, HDL – high-density lipoprotein, TG – triglycerides, APRI – AST to platelet ratio, FIB-4 – fibrosis-4 index, PNFS – pediatric NAFLD fibrosis score
Table 4
Comparison of clinical and laboratory parameters and noninvasive hepatic fibrosis scores in groups of patients with and without a significant risk of fibrosis (PNFS > 23)
[i] BMI – body mass index, HGB – hemoglobin, HCT – hematocrit, MCV – mean corpuscular volume, WBC – white blood cells, PLT – platelets, ALT – alanine aminotransferase, AST – aspartate aminotransferase, SF – significant fibrosis, LDL – low-density lipoprotein, HDL – high-density lipoprotein, TG – triglycerides, APRI – AST to platelet ratio, FIB-4 – fibrosis-4 index, PNFS – pediatric NAFLD fibrosis score
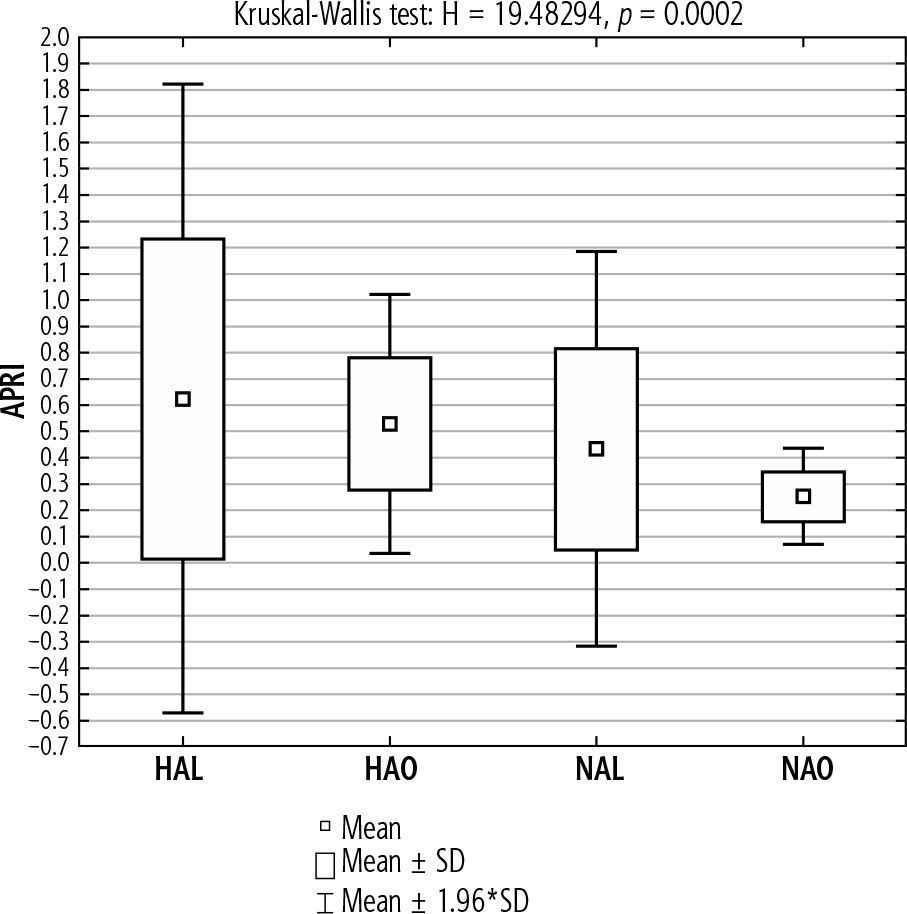
In the next step, the four previously described groups were compared (HAL, HAO, NAL, NAO). Higher values of APRI were found in the group of lean patients (with and without aminotransferase elevations respectively) compared to the corresponding groups of obese patients. The highest values of APRI were found in a group of lean patients with elevated aminotransferase activity. In obese patients with aminotransferase activity within reference values, the APRI index was below the cutoff for significant fibrosis (Fig. 1).
Fig. 1
Mean APRI index in the groups of lean and obese patients with and without elevated aminotransferase activity
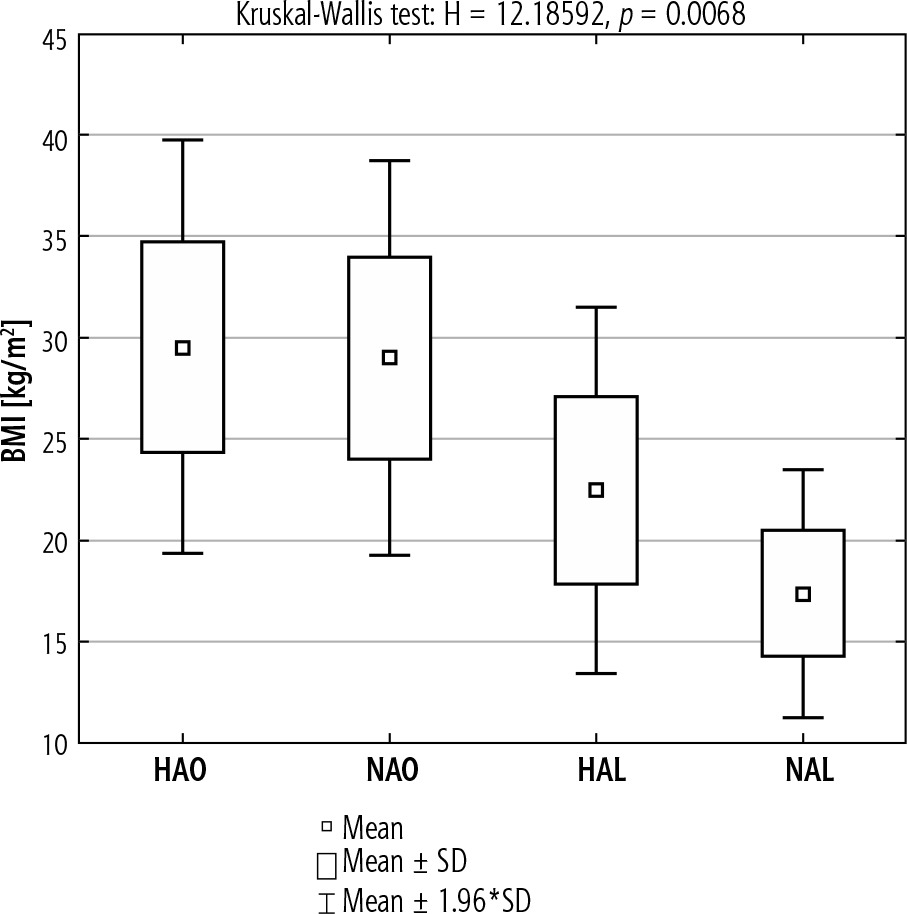
Patients with elevated aminotransferases (HAO, HAL) developed higher BMI compared to the appropriate groups with the liver function tests within reference limits. In the lean group with increased aminotransferase activity, a higher BMI was found. Between HAO and NAO, the mean BMI values were similar. The group of the leanest patients comprised those with normal aminotransferase activity (Fig. 2).
Fig. 2
Mean BMI in the groups of lean and obese patients with and without elevated aminotransferase activity
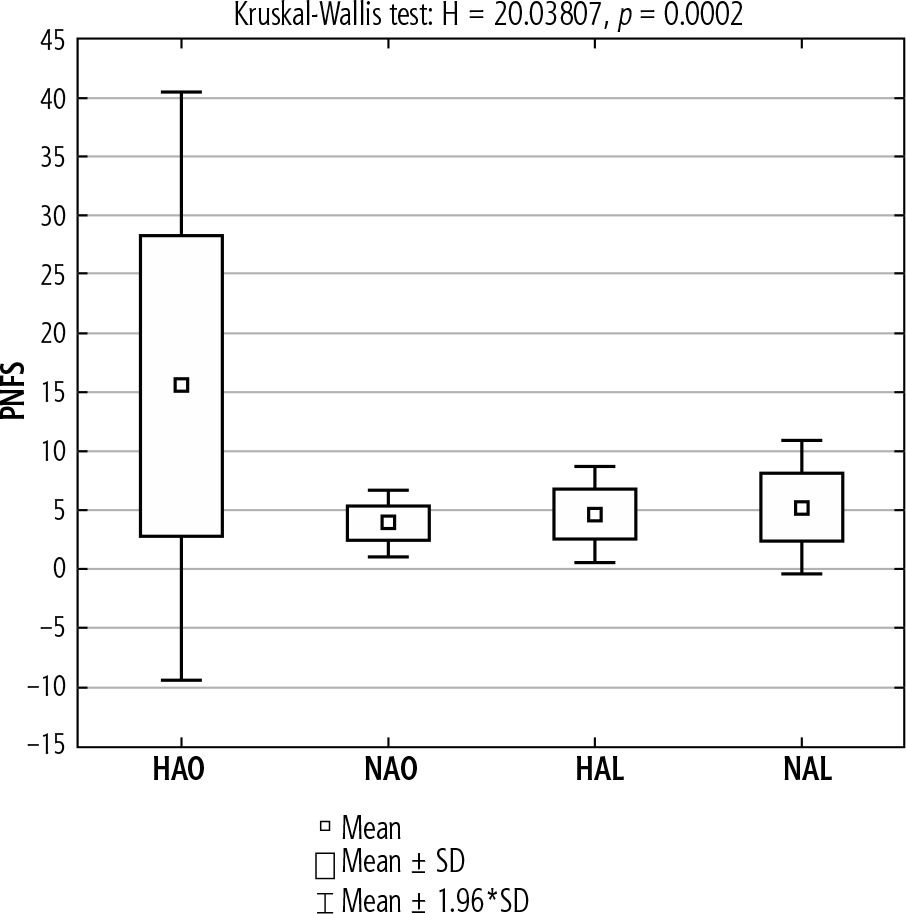
Significantly higher mean PNFS index values were found in the HAO group compared to other groups. Among the other groups, the mean values of the PNFS index were similar. In these groups, the threshold for fibrosis (F) was not exceeded (Fig. 3).
Fig. 3
Mean PNFS index in the groups of lean and obese patients with and without elevated aminotransferase activity
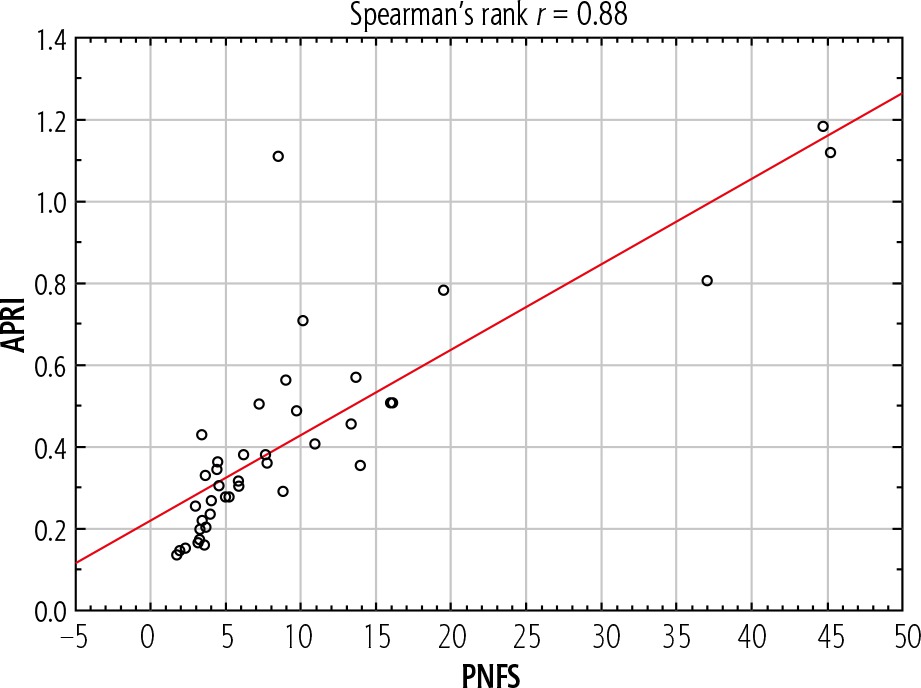
A strong significant correlation between APRI and PNFS indexes was found (r = 0.88, p < 0.05) (Fig. 4).
Liver biopsy was performed in 4 patients with the highest risk of fibrosis estimated by chosen indexes. In all cases, more than 5% macrovesicular steatosis was found (30-50%). In 1 case with suspected NASH, periportal and pericellular fibrosis, lobular inflammation, and hepatocyte ballooning were observed by a pathologist. Fibrosis was found in all assessed cases.
Discussion
Nonalcoholic fatty liver disease, the most common liver chronic disease, constitutes a growing health problem in developed countries. Despite this, there are few reports about the prevalence of NAFLD in children. Boys were the majority in the described population (71.4%), which is consistent with the previously published observations [2]. These data are also in compliance with the higher prevalence of obesity among boys observed in Poland [15].
On the authority of expert opinion published in 2007 (Barlow SE), overweight children over ten years of age with additional risk factors should be screened for liver disease (serum ALT and AST) twice a year [16]. These guidelines match the trends observed in our group – patients with elevated serum ALT and AST had higher BMI than patients with liver function tests within reference values.
Significantly lower MCV values in overweight patients in the study group were documented. These observations are compatible with the Vuong report [16]. They compared complete blood count (CBC) parameters in patients with and without an increased waist circumference. According to those data, waist circumference (WC) was positively correlated with red blood cells (RBC), hemoglobin and hematocrit and negatively correlated with MCV, mean corpuscular hemoglobin (MCH), and mean corpuscular hemoglobin concentration (MCHC). Lower iron levels in a group with higher WC were detected. Iron deficiency in obese patients may be caused by increased production of hepcidin. The concentration of this protein grows during inflammation, leading to impairment of iron transport from enterocytes to the portal circulation [17]. Similar observations in a group of patients undergoing bariatric surgery were made – a high percentage of anemia was noted [18].
Initially, three hepatic fibrosis scores were taken into consideration in our study – APRI, FIB-4, and PNFS. We found that FIB-4 was adequate only in a group with a risk of fibrosis, not significant fibrosis in the study group. Therefore this marker was not found reliable in children with NAFLD. In the study by American authors from 2015 [5], of the four analyzed indicators (AST/ALT ratio, APRI, NAFLD fibrosis score and FIB-4) only APRI had good predictive value for diagnosing any fibrosis in children but not to distinguish a population with significant or advanced fibrosis. The authors found the uselessness of indicators intended for adults in the pediatric population and the necessity to create a new one.
In 2014 the first study regarding PNFS was published. The authors gave a first and probable explanation of the high utility of PNFS to distinguish a group of children with significant fibrosis: low PLT associated with more advanced liver damage, ALT as a marker of necroinflammatory activity and the unexplained background of changes in alkaline phosphatase and GGT activity [7]. Due to the probable effectiveness of PNFS in the diagnosis of fibrosis and significant fibrosis, we chose this indicator for further analysis. Indirect confirmation of this observation may be significantly higher PNFS values in the group of obese patients with elevated aminotransferase activity.
The utility of APRI for distinguishing groups with and without risk of fibrosis was found, and the values were significantly higher in children with severe fibrosis, which coincides with previous reports. In the latter group of patients the mean APRI value exceeded 1.0. Although a value of 1.5 (cut-off for cirrhosis) has not been crossed the risk of significant fibrosis was confirmed by histopathological evaluation. An interesting fact is that lean patients with elevated aminotransferase activity had higher values of APRI than overweight ones. Similar alterations in groups without elevated activity of liver function tests were noted.
There is a need for further studies comparing the effectiveness of non-invasive markers of fibrosis in children NAFLD. In our analysis, a high correlation between APRI and PNFS was found (r = 0.88). It seems reasonable to create a commonly available, low-cost tool to identify a group of children requiring a more accurate and, consequently, more expensive diagnosis of liver disease. An example of such a tool is an algorithm created for adult patients with NAFLD and suspected risk of advanced fibrosis published this year [19]. In patients with abnormal liver function tests, evidence of fat accumulation in diagnostic imaging, risk factors (e.g., obesity) and excluded secondary causes of steatosis and significant alcohol consumption, the next step is to rule out advanced fibrosis by the NAFLD fibrosis score or FIB-4 index. According to the risk calculated by indicators, these patients will carry out an appropriate further diagnostic path – e.g., patients with low risk will repeat PNFS/FIB-4 every two years and patients with intermediate risk will undergo more sophisticated examinations such as the ELF test. When attempting to create a similar tool for children, APRI and PNFS scores can be considered as one of the steps. In our study children with a risk of significant fibrosis developed higher ALT, AST and GGT activity. APRI was also higher in this group of patients. Therefore, these patients required a further, more detailed diagnostic approach including a liver biopsy.
We are aware that our research has limitations, mainly concerning the small population from one outpatient clinic in a tertiary hospital. All children were from one ethnic group, and only 4 underwent liver biopsy, all of them having noninvasive markers of liver fibrosis.
However, our observations may be continued on a larger group of children with NAFLD.
Conclusions
Apart from aminotransferase activity, complete blood count should be assessed, looking for lower MCV caused by iron deficiency. In contrast to FIB-4 (fibrosis score), PNFS and APRI proved to be more accurate in our group. PNFS seems to be appropriate to evaluate fibrosis in a noninvasive diagnostic algorithm.


