
Introduction
Metabolic dysfunction-associated steatotic liver disease (MASLD), characterized by liver fat deposition accompanied by multicomplex metabolic dysfunction, has been recognized as the most prevalent (approx. 30%) chronic liver disease worldwide, and its increasing epidemic trends continue [1]. Notably, China has been predicted to suffer the highest disease future burden of MASLD across multiple developed regions, including England, America and Japan, by the dynamic Markov model based on existing reports. It is estimated that by 2030, MASLD cases will increase by 29.1% to 314.58 million cases, with a prevalence of 28.4% [2]. More importantly, MASLD not only progresses to hepatitis, fibrosis, and cancer but is also involved in systemic metabolic complications, including type 2 diabetes, cardiovascular disease and chronic kidney disease [3].
Currently, limited specific drug treatment has been approved for MASLD, and the heterogeneity of the clinical features of MASLD has become the major barrier for developing specific pharmacotherapy therapy [4]. Emerging evidence suggests that ethnicity-associated histological and metabolic differences exist between African Americans and Caucasians, such as a lower prevalence of steatosis in the former population [5–10]. It is acknowledged that genetic diversity, food intake, and habits differ greatly between Western countries and Asia [11]. However, few studies have identified racial differences in related traits between Asians and Caucasians. Moreover, studies on the causes of death in MASLD might suggest that Asian patients have lower proportions of death due to liver complications than Caucasians [12–15]. Therefore, comprehensively investigating the ethnic discrepancies among clinical and metabolic characteristics is of great significance.
In this study, we explored the clinical metabolic characteristics and liver fat contents as well as their potential links in MRI-PDFF-confirmed Han Chinese MASLD patients and compared these characteristics with those of Caucasians patients using the Biobank database.
Material and methods
Patients
The cross-sectional population derived from consecutive patients admitted to the four University-affiliated Medical Centers of fatty liver in China – the First Affiliated Hospital of Sun Yat-sen University (latitude: 22.7683°N, longitude: 113.5236°E), the First Affiliated Hospital of Jinan University (latitude: 23.1254°N, longitude: 113.3230°E), the Third Affiliated Hospital of Sun Yat-sen University (latitude: 23.1695°N, longitude: 113.5103°E), Shunde Hospital of Southern Medical University (latitude: 22.8035°N, longitude: 113.2649°E) – between January 2015 and January 2023. The Independent Ethics Committee for Clinical Research and Animal Trials of the First Affiliated Hospital of Sun Yat-sen University approved the research plan (ethic code: [2020]187]), and all subjects provided written informed consent. The data of Caucasian were extracted from the UK Biobank database (Application Number 56925), which is a large prospective cohort of middle-aged adults designed to support biomedical analysis focused on improving the prevention, diagnosis, and treatment of chronic disease, the methods and aim of which have been reported elsewhere. In brief, between April 2007 and December 2010, UK Biobank recruited 502,628 participants (5.5% response rate, the majority of whom were age 40-70 years) from the general population. Participants attended 1 of 22 assessment centers across England, Wales, and Scotland and completed a touchscreen questionnaire, had physical measurements taken, and provided biological samples. All participants provided written informed consent and the study was approved by the NHS National Research Ethics Service, according to Hilsinky (2008). Both Han Chinese and Caucasian with signs of fatty liver – especially abdominal ultrasound or computed tomography (CT) in health check-up or visit to other clinical departments – subsequently received abdominal MRI-PDFF to quantitively evaluate hepatic steatosis. In Chinese patient with MASLD, 146 patients with liver biopsies were included for further analysis.
The inclusion criteria were as follows: 1) age at least 40 years; 2) availability of complete of anthropometric parameters, laboratory test results and imaging data; 3) confirmed diagnosis of MASLD based on the criteria endorsed by the latest international expert consensus [16]; and 4) availability of MRI-PDFF measurements for all included patients. The exclusion criteria included: 1) pregnancy and breastfeeding women; 2) coexistence with alcoholic liver disease (previous history of alcohol intake of > 140 g/week in males or > 70 g/week in females), drug-induced liver injury (e.g., history of long-term consumption of the steroids amiodarone, tamoxifen or methotrexate), autoimmune liver disease (positive results for anti-nuclear antibody, anti-smooth muscle antibody or anti-mitochondrial antibody), hepatitis B (positive for hepatitis B surface antigen for over 6 months) and/or C virus infection (screening of antibody against hepatitis C virus), or Wilson’s disease (screen for ceruloplasmin); (3) participants with previous cardiovascular diseases (coronary heart disease, including myocardial infarction, asymptomatic myocardial ischemia, ischemic cardiomyopathy, and chronic ischemic heart disease) or stroke; and 4) concomitant malignant tumor or other severe diseases with organ dysfunction (heart failure, respiratory failure, renal failure, hepatic failure, or disseminated intravascular coagulation).
Clinical and metabolic data collection
The data included age at diagnosis, body weight, height, waist circumference (WC), and hip circumference (HC). Body mass index (BMI, kg/m2) was calculated as the body weight (kg) divided by the square of the standing height (m2), and it was categorized as lean/normal weight (< 23 kg/m2 for Chinese individuals or < 25 kg/m2 for Caucasian individuals), overweight (23-25 kg/m2 for Chinese individuals or 25-30 kg/m2 for Caucasian individuals), and obese (BMI > 25 kg/m2 for Chinese individuals or > 30 kg/m2 for Caucasian individuals) [17]. The waist-to-hip ratio (WHR) was calculated as the waist circumference (cm) divided by the hip circumference (cm).
We collected data from electronic medical records, including alanine aminotransferase (ALT), aspartate aminotransferase (AST), γ-glutamyl transpeptidase (GGT), creatinine, fasting blood glucose (FBG), total cholesterol (TC), triglycerides (TG), high-density lipoprotein cholesterol (HDL-C), low-density lipoprotein cholesterol (LDL-C), apolipoprotein-A1 (Apo-A1), apolipoprotein-B (Apo-B), and lipoprotein-a (Lp-a), and the triglyceride-glucose index (TyG index) was calculated. Elevated ALT was defined as > 30 U/l in males and > 19 U/l in females, and high AST was defined as > 30 U/l in males and > 19 U/l in females [18]. These clinical biochemistry parameters were measured by the same methods in both groups.
Metabolic syndrome (MetS) presence was defined according to the CardioMetabolic Health Alliance in 2015 for Caucasians and its modified criteria for Asians [19].
MRI-PDFF quantification of liver fat
All Han Chinese patients had received abdominal magnetic resonance imaging-based proton density fat fraction (MRI-PDFF) with a 3.0-Tesla MRI scanner (Siemens 3.0T MAGNE-TOM Verio; Siemens, München, Germany), from which the LFC of the entire liver was calculated. The detailed scanning protocol and imaging parameters were the same as those described in our previously published study [20]. The fat content was calculated in an irregularly shaped ROI covering the entire liver in 21 consecutive slices (maximum area centered) of each patient, and patients were manually placed by two trained radiologists [21].
Subjects from UK Biobank underwent MRI scans using 10-point symmetric chemical shift encoded acquisition (10P) to measure average liver proton density fat fraction (PDFF) in three to nine liver regions of interest to quantify LFC [22]. Liver PDFF values were obtained based on the gradient echo imaging protocol by medical professionals.
Steatosis was defined as an average LFC ≥ 5%, and we defined 5% ≤ PDFF < 16.3% as mild fatty liver, 16.3% ≤ PDFF ≤ 21.7% as moderate fatty liver, and PDFF > 21.7% as severe fatty liver steatosis [23].
Liver histological assessment
Liver biopsies were scored by two experienced hepato-pathologists using the SAF (Steatosis, Activity and Fibrosis) scoring system, with a score of 0-3 for steatosis, 0-3 for lobular inflammation, 0-2 for ballooning, and 0-4 for fibrosis stage. Activity score was defined as the lobular inflammation score plus the ballooning score, yielding a score of 0-4 [24]. The histological severity of MASLD according to the SAF score was classified as mild, moderate, or severe. Mild was defined as fibrosis and activity score of no more than one in either score. Moderate was defined as either fibrosis and/or activity score equal to two. Severe was defined as fibrosis and/or activity score of at least 3 [25].
Statistical analysis
Statistical calculations were conducted using SPSS Statistics software (version 25.0, IBM Corp.). Continuous variables with a normal distribution, as verified by the Kolmogorov-Smirnov test, are reported as means ± standard deviations (SD), whereas variables not normally distributed are reported as medians with interquartile ranges (IQR). The Kruskal-Wallis rank sum test was used to compare non-normally distributed continuous variables between groups, and Student’s t test was applied to those normally distributed variables. Pearson’s chi-squared (χ2) test was used to compare categorical data between groups. Spearman’s rank correlation analysis was used to analyze the relationships of liver enzyme, creatinine, fasting blood glucose levels, lipid profiles, TyG index and SAF scores with liver fat content (LFC). Multivariable linear regression models with stepwise selection were used to standard estimate partial regression coefficients (β′) of the contributing factors associated with LFC. As a retrospective design, patients were not randomized; thus, the propensity score matching (PSM) method (with a caliper size of 0.2) was conducted to effectively ameliorate confounding bias and variables, allowing for a more reasonable comparison between the Han Chinese group and the Caucasian group [26, 27]. By replacing multiple covariates with a single score to balance the distribution of covariates (such as sex, age, LFC, and BMI) between the two groups, PSM performs a similar randomization-like balancing of confounding factors in non-randomized studies, reducing selection bias. P values for the trend (two-sided) were calculated and were considered statistically significant when they were less than 0.05.
Results
Patient characteristics
A total of 620 Han Chinese patients with MASLD from four Chinese hospitals in China and 829 Caucasian patients with MASLD assessed by MRI-PDFF from the Biobank database were included in this study, after exclusion of participants: 1) aged younger than 40 years (n = 523); 2) without complete anthropometric parameters or laboratory examination results (n = 65); 3) not meeting the diagnostic criteria of MASLD (n = 93); 4) with previous cardiovascular diseases (coronary heart disease and stroke) (n = 55); 5) with concomitant malignant tumor or other severe diseases with organ dysfunction (n = 14) at baseline (n = 2199), leaving 1449 participants remaining for analysis (Fig. 1, Table 1).
Fig. 1
Distribution of steatosis severity in Han Chinese and Caucasian MASLD patients. A) All patients and gender subgroups; B) Different grades of body mass index (BMI) subgroups. Liver fat content (LFC) defined by magnetic resonance imaging proton density fat fraction (MRI-PDFF): 5% ≤ PDFF < 16.3% as mild fatty liver; 16.3% ≤ PDFF ≤ 21.7% as moderate fatty liver; PDFF > 21.7% as severe fatty liver; Body mass index (BMI, kg/m2) was calculated as body weight (kg) divided by the square of the standing height (m2), and it was categorized as lean/normal weight (< 23 kg/m2 for Chinese individuals or < 25 kg/m2 for Caucasian individuals), overweight (23-25 kg/m2 for Chinese individuals or 25-30 kg/m2 for Caucasian individuals), and obese (BMI > 25 kg/m2 for Chinese individuals or > 30 kg/m2 for Caucasian individuals); *p < 0.05, **p < 0.001, ***p < 0.0001; ns – not significant
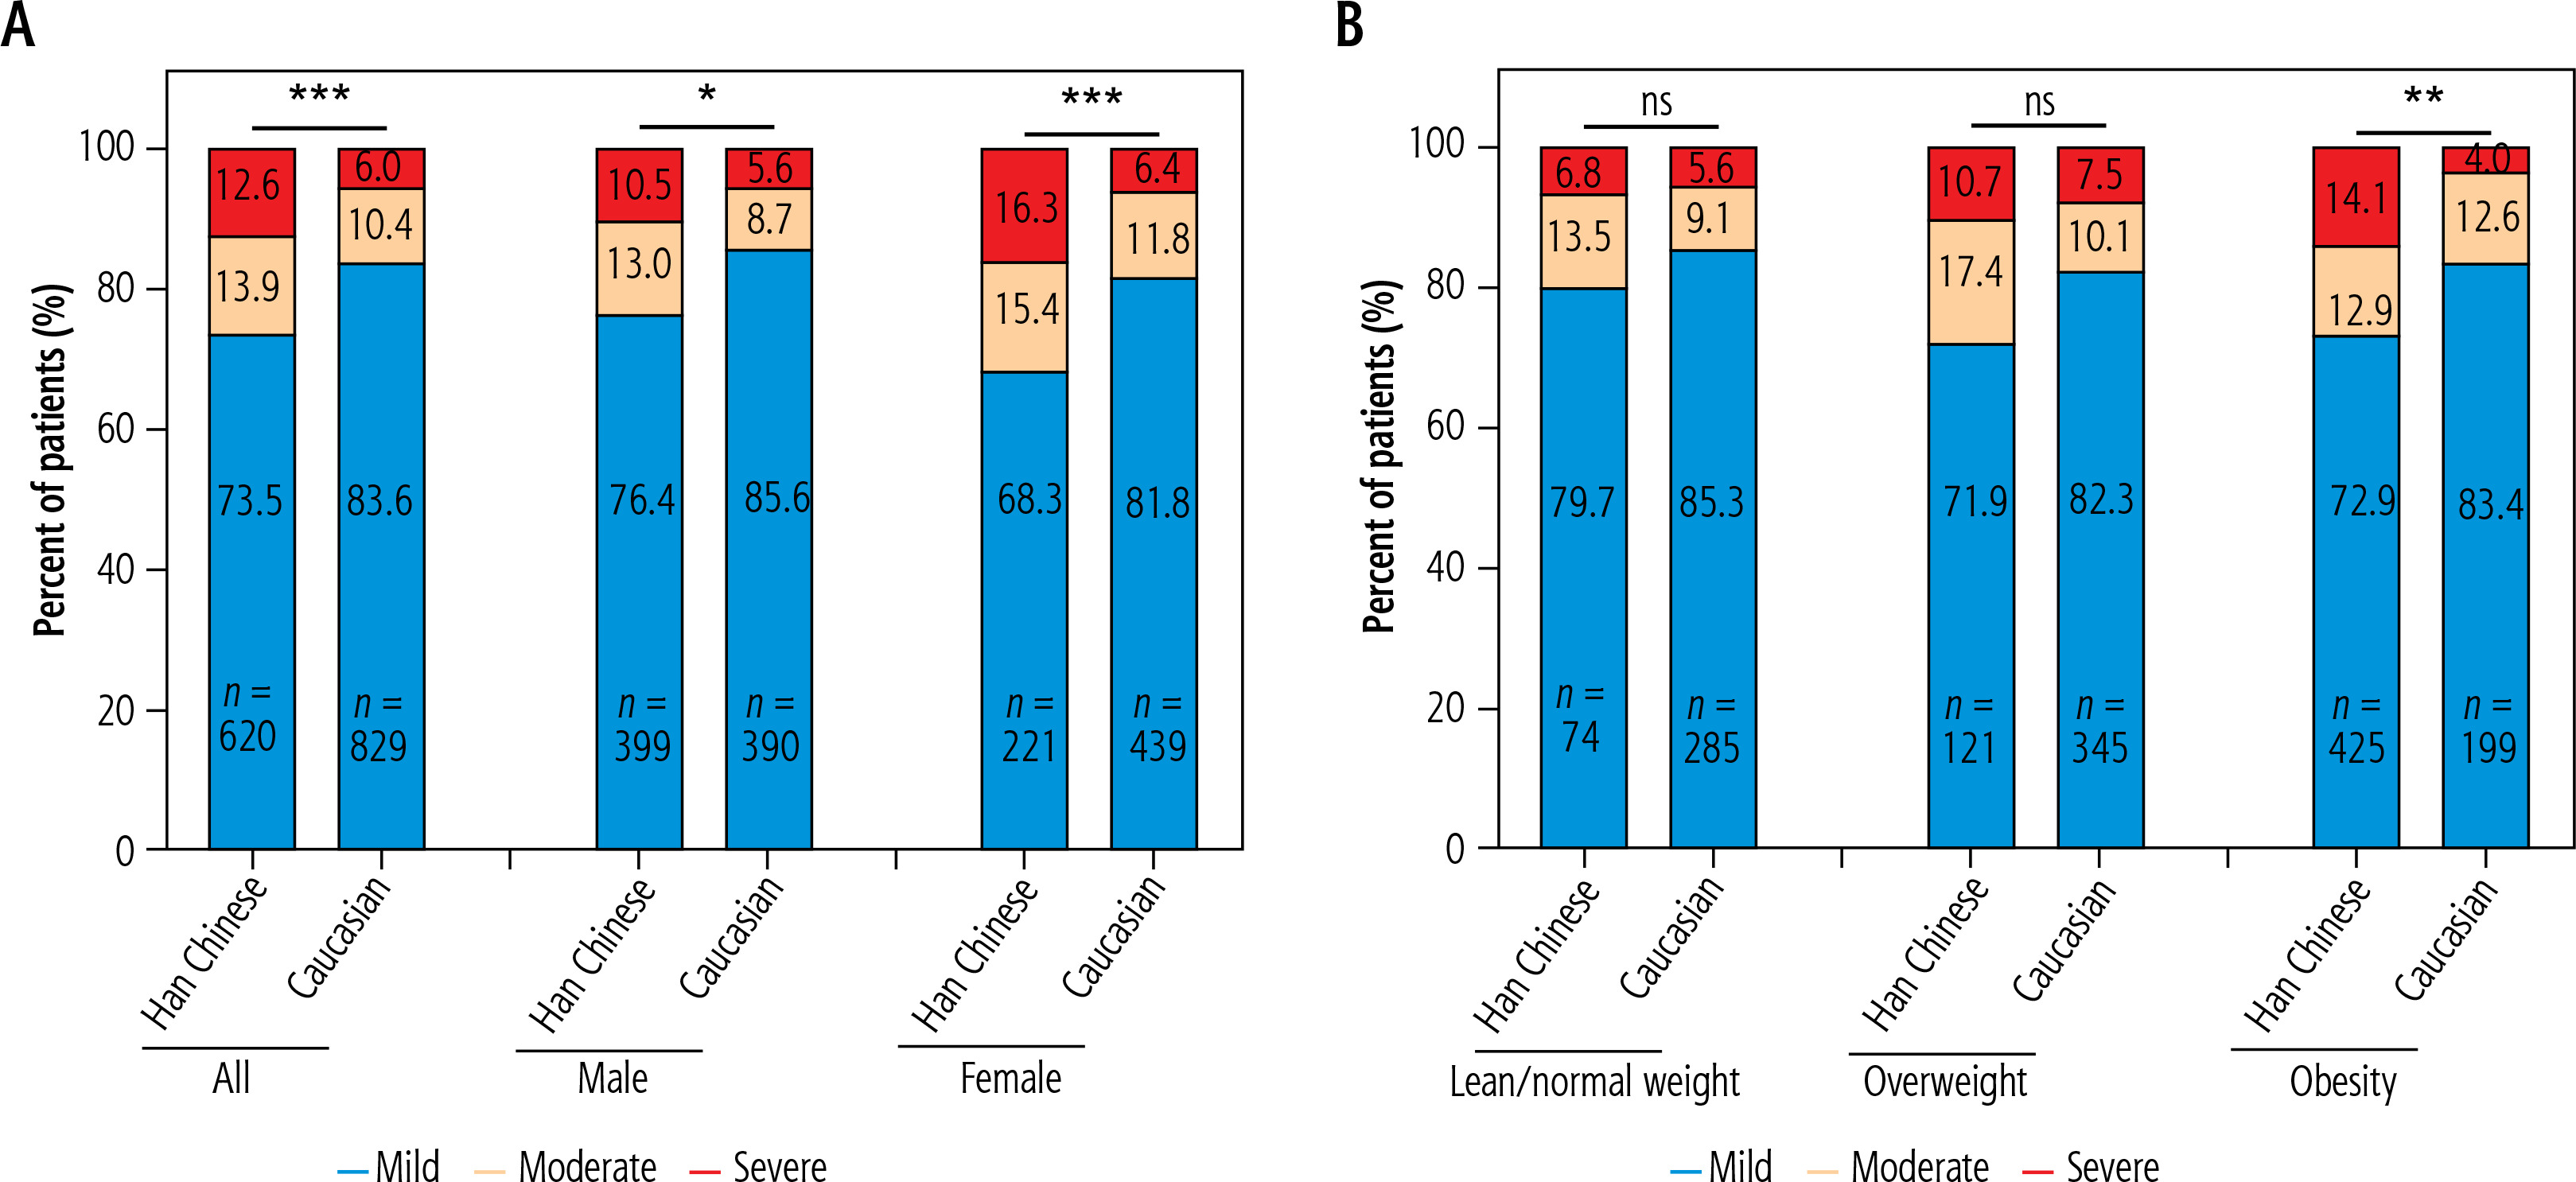
Table 1
Characteristics of MASLD patients overall and by gender and ethnicity: Han Chinese and Caucasian
[ii] MASLD – metabolic dysfunction-associated steatotic liver disease, MRI-PDFF – magnetic resonance imaging proton density fat fraction, BMI – body mass index, WHR – waist-hip ratio, WC – waist circumference, ALT – alanine aminotransferase, AST – aspartate aminotransferase, GGT – γ-glutamyl transpeptidase, Cr – creatinine, FBG – fasting blood glucose, CHOL – total cholesterol, TG – triglycerides, HDL-C – high-density lipoprotein cholesterol, LDL-C – low-density lipoprotein cholesterol, Apo-A1 – apolipoprotein-A1, Apo-B – apolipoprotein-B, Lp-a – lipoprotein-a, TyG index – triglyceride-glucose index
MASLD patients were stratified by sex and liver fat content severity into the following groups: sex-based stratification as male (n = 399 in Han Chinese; n = 390 in Caucasian) and female (n = 221 in Han Chinese; n = 439 in Caucasian) groups; liver fat severity-based stratification as mild (n = 456 in Han Chinese; n = 693 in Caucasian), moderate (n = 86 in Han Chinese; n = 86 in Caucasian), and severe (n = 78 in Han Chinese; n = 50 in Caucasian). In addition, age subgroups were further stratified within sex groups): 40 ≤ age ≤ 60 (male = 362, female = 168 in Han Chinese; male = 213, female = 267 in Caucasian) as the middle-aged groups and age > 60 (male = 37, female = 53 in Han Chinese; male = 177, female = 172 in Caucasian) as the old-aged groups. The process and grouping details of MASLD patients in the two groups are presented in Suppl. Fig. 1 of Supplementary material.
In the overall groups and in the sex subgroups, Han Chinese MASLD patients had higher proportions of male and younger patients as well as higher levels of LFC (median 11.02% vs. 8.85%, p < 0.001 overall; 11.16% vs. 9.01%, p < 0.001 in males; 10.30% vs. 8.76%, p < 0.001 in females; Table 1), ALT, AST, FBG, and TyG index but lower levels of TC, HDL-C, LDL-C, Apo-A1, Apo-B, and Lp-a than Caucasian MASLD patients. However, Han Chinese MASLD patients had a higher WHR in females but a lower WHR in males (median 0.90 vs. 0.88, p < 0.001 overall; 0.91 vs. 0.93, p < 0.001 in males; 0.87 vs. 0.80, p < 0.001 in females; Table 1). There were no significant differences in the levels of creatinine levels between the two overall groups, TC in the male subgroups, and BMI and GGT in the female subgroups. In the male age subgroups, Han Chinese male MASLD patients had higher levels of ALT and FBG but lower levels of BMI, WHR, HDL-C, Apo-A1, and Lp-a than Caucasian males. There were significant differences in age, LFC (median 11.02% vs. 8.61%, p < 0.001 for 40 ≤ age ≤ 60; 11.57% vs. 9.48%, p = 0.328 for age > 60; Table 2), AST, GGT, TC, LDL-C, Apo-B, and TyG index in the middle-aged groups, while no significant differences in levels of Cr or HDL-C were observed in either age group.
Table 2
Characteristics of MASLD of different age groups by gender and ethnicity: Han Chinese and Caucasian
[ii] MASLD – metabolic dysfunction-associated steatotic liver disease, MRI-PDFF – magnetic resonance imaging proton density fat fraction, BMI – body mass index, WHR – waist-hip ratio, WC – waist circumference, ALT – alanine aminotransferase, AST – aspartate aminotransferase, GGT – γ-glutamyl transpeptidase, Cr – creatinine, FBG – fasting blood glucose, CHOL – total cholesterol, TG – triglycerides, HDL-C – high-density lipoprotein cholesterol, LDL-C – low-density lipoprotein cholesterol, Apo-A1 – apolipoprotein-A1, Apo-B – apolipoprotein-B, Lp-a – lipoprotein-a, TyG index – triglyceride-glucose index
Han Chinese female MASLD patients also had higher levels of LFC (median 9.82% vs. 8.81%, p = 0.001 for 40 ≤ age ≤ 60; 14.81% vs. 8.69%, p < 0.001 for age > 60; Table 2) as well as WHR, ALT, AST, and FBG but lower levels of TC, HDL-C, LDL-C, Apo-A1, and Lp-a than Caucasian females. Significant differences in Cr, TC, and TyG index were only found in the middle-aged groups, and significant differences in Apo-B were found only in the old-aged groups. No significant differences in the levels of BMI or GGT in either age group were identified.
In the LFC subgroups, Chinese MASLD patients also had higher proportions of male and younger patients; higher levels of WHR, ALT, AST, GGT, FBG, and TG and a higher TyG index; and lower levels of HDL-C, Apo-A1, and Lp-a than Caucasian MASLD patients in all subgroups. Moreover, we found significant differences in LFC (median 8.73% vs. 8.04%, p < 0.001 in mild groups; 19.00% vs. 18.64%, p = 0.307 in moderate groups; 26.55% vs. 25.54%, p = 0.098 in severe groups, Suppl. Table 1), Cr, TC, LDL-C, and Apo-B only in mild groups, while significant differences in BMI were found in the mild and moderate groups.
Comparison of clinical features after propensity score matching
To validate our findings, propensity score matching (PSM) was performed with a caliper width of 0.2. Matching covariates included sex, age (categorized as 40-49, 50-59, 60-69, and ≥ 70 years), average LFC severity (mild, moderate, severe), and BMI (lean, overweight, obese). After matching, 346 balanced pairs of Han Chinese and Caucasian patients were obtained. Subsequent analyses compared ethnic groups both overall and stratified by sex (Han Chinese: 172 males, 174 females; Caucasian: 182 males, 164 females). All parameters remained consistent between raw and matched data except for serum creatinine. While the raw male subgroup showed marginal significance (median 80 vs. 81, p = 0.045; Table 1), the matched subgroup exhibited a more pronounced difference (79 vs. 72, p < 0.001; Suppl. Table 2). Interestingly, no significant differences were observed in WHR, lipid profiles (TC, TG, HDL-C, LDL-C), or Apo-B levels (p > 0.05) after matching.
Given the significant interethnic disparity in mean LFC, we analyzed and compared the stratified distributions of mild-to-severe steatosis patients across sex-specific subgroups (male vs. female) and BMI categories (low: < 25 kg/m2, intermediate: 25-30 kg/m2, high: > 30 kg/m2) within the entire cohort. Han Chinese MASLD patients had higher proportions of moderate and severe degrees of average LFC in the overall, male, female, and obese subgroups (Fig. 1).
Correlation among LFC, metabolic indicators, and liver injury markers
Spearman’s rank correlation analysis between average LFC and metabolic and liver injury indicators in lean/normal weight and overweight-obese subgroups was performed. The levels of ALT showed a positive correlation with the average LFC in both the lean and overweight-obese subgroups in Han Chinese MASLD patients, while Caucasians did not show this tendency (r = 0.279, p = 0.018 and r = 0.361, p < 0.001 in Han Chinese lean/normal weight and overweight-obese MASLD patients, respectively; r = –0.021, p = 0.727 and r = –0.041, p = 0.341 in Caucasian lean/normal weight and overweight-obese MASLD patients, respectively; Fig. 2). Then we performed a multivariable linear regression analysis between average LFC and metabolic and liver injury indicators in male and female Han Chinese MASLD patients. Men and women had different correlating factors (βWC’ = 0.253, p = 0.003; βALT’ = 0.329, p < 0.001; βAST’ = –0.152, p = 0.034; βCr’ = –0.130, p = 0.008; βHDL-C’ = 0.174, p = 0.008; βApo-B’ = 0.224, p = 0.019; and βTyG index’ = 0.201, p = 0.038 in male patients; βage’ = 0.134, p = 0.005; βBMI’ = –0.210, p = 0.036; βWHR’ = 0.294, p = 0.002; βALT’ = 0.349, p < 0.001; βAST’ = –0.223, p < 0.001; βGGT’ = –0.083, p = 0.011 and βFBG = 0.025, p < 0.001 in female patients; Table 3).
Fig. 2
Relationships of liver transpeptidase with liver fat content (LFC) in Han Chinese and Caucasian MASLD patient subgroups with different BMI. A-C) Lean subgroup and D-F) Overweight-obesity subgroup. Liver enzymes include alanine aminotransferase (ALT), aspartate aminotransferase (AST) and γ-glutamyl transpeptidase (GGT); liver fat content (LFC) defined by magnetic resonance imaging proton density fat fraction (MRI-PDFF); body mass index (BMI, kg/m2) was calculated as body weight (kg) divided by the square of the standing height (m2), and it was categorized as lean/normal weight (< 23 kg/m2 for Chinese individuals or < 25 kg/m2 for Caucasian individuals), overweight (23-25 kg/m2 for Chinese individuals or 25-30 kg/m2 for Caucasian individuals), and obese (BMI > 25 kg/m2 for Chinese individuals or >30 kg/m2 for Caucasian individuals)
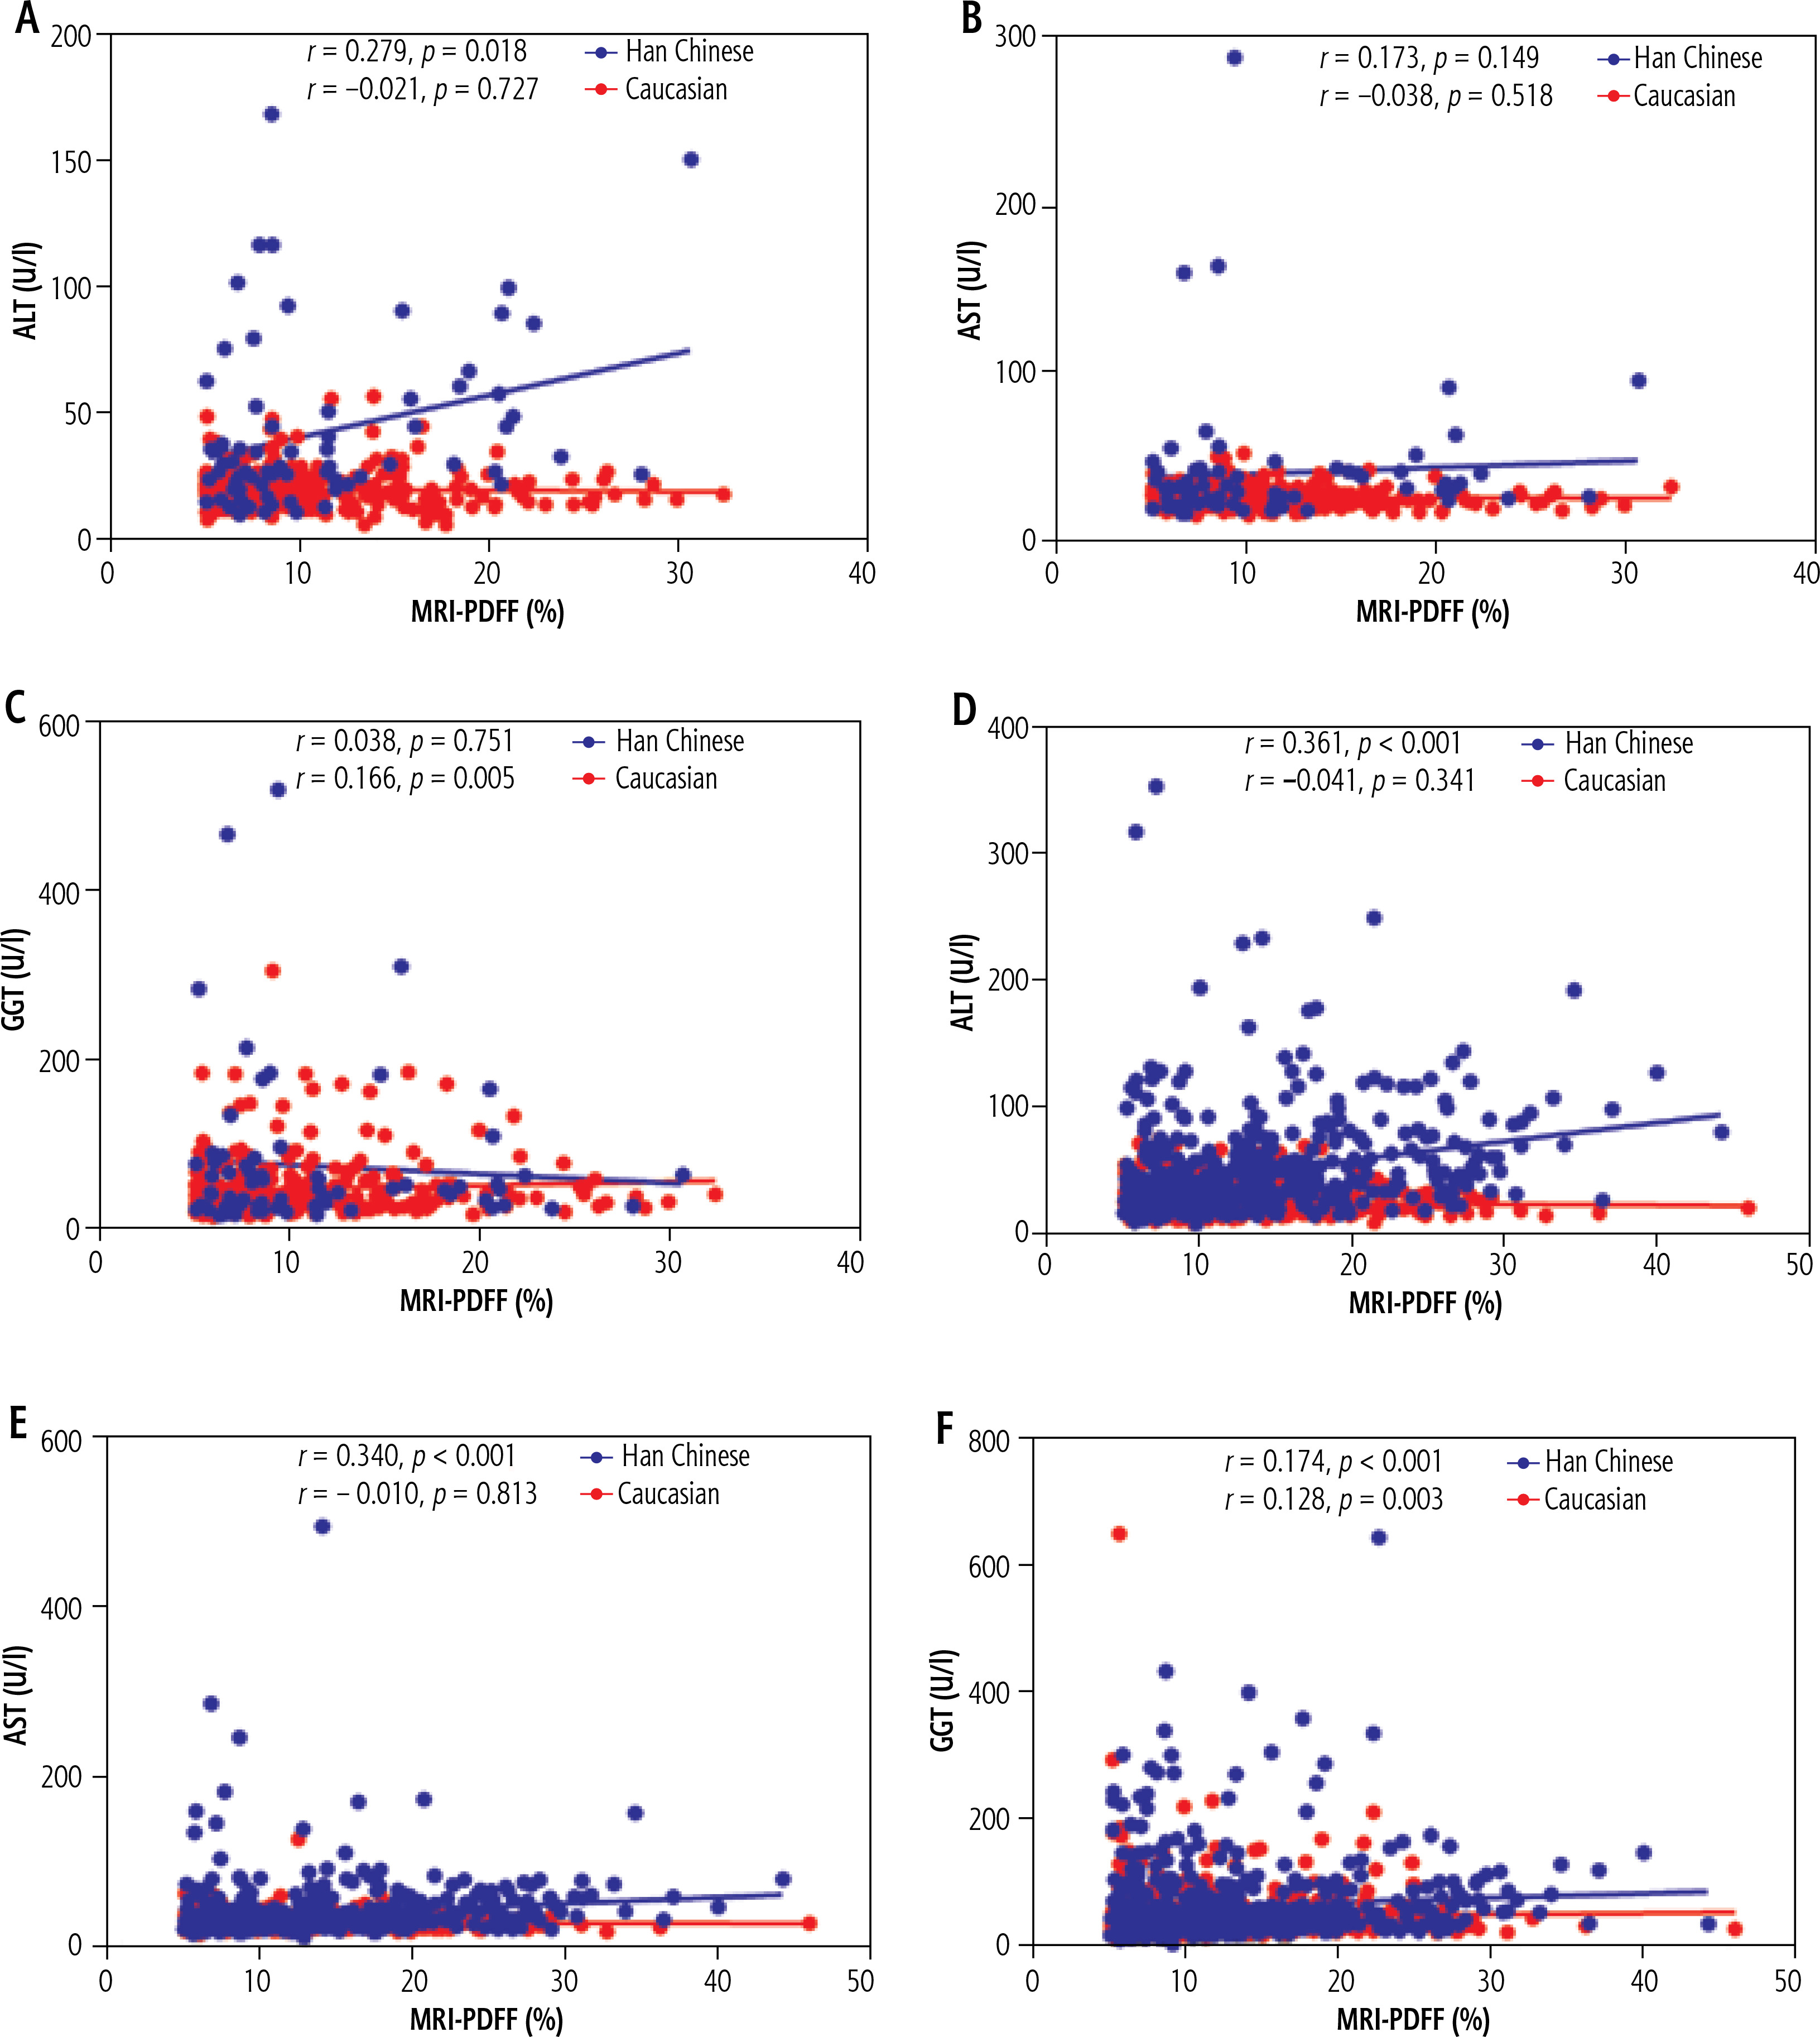
Table 3
Factors associated with LFC confirmed by MRI-PDFF in Han Chinese MASLD patients
[ii] MRI-PDFF – magnetic resonance imaging proton density fat fraction, MASLD – metabolic dysfunction-associated steatotic liver disease, BMI – body mass index, WC – waist circumference, WHR – waist-hip ratio, ALT – alanine aminotransferase, AST – aspartate aminotransferase, GGT – γ-glutamyl transpeptidase, Cr – creatinine, FBG – fasting blood glucose, CHOL – total cholesterol, TG – triglycerides, HDL-C – high-density lipoprotein cholesterol, LDL-C – low-density lipoprotein cholesterol, Apo-A1 – apolipoprotein-A1, Apo-B – apolipoprotein-B, Lp-a – lipoprotein-a, TyG index – triglyceride-glucose index
Further confirmation among Han Chinese MASLD patients with liver biopsy
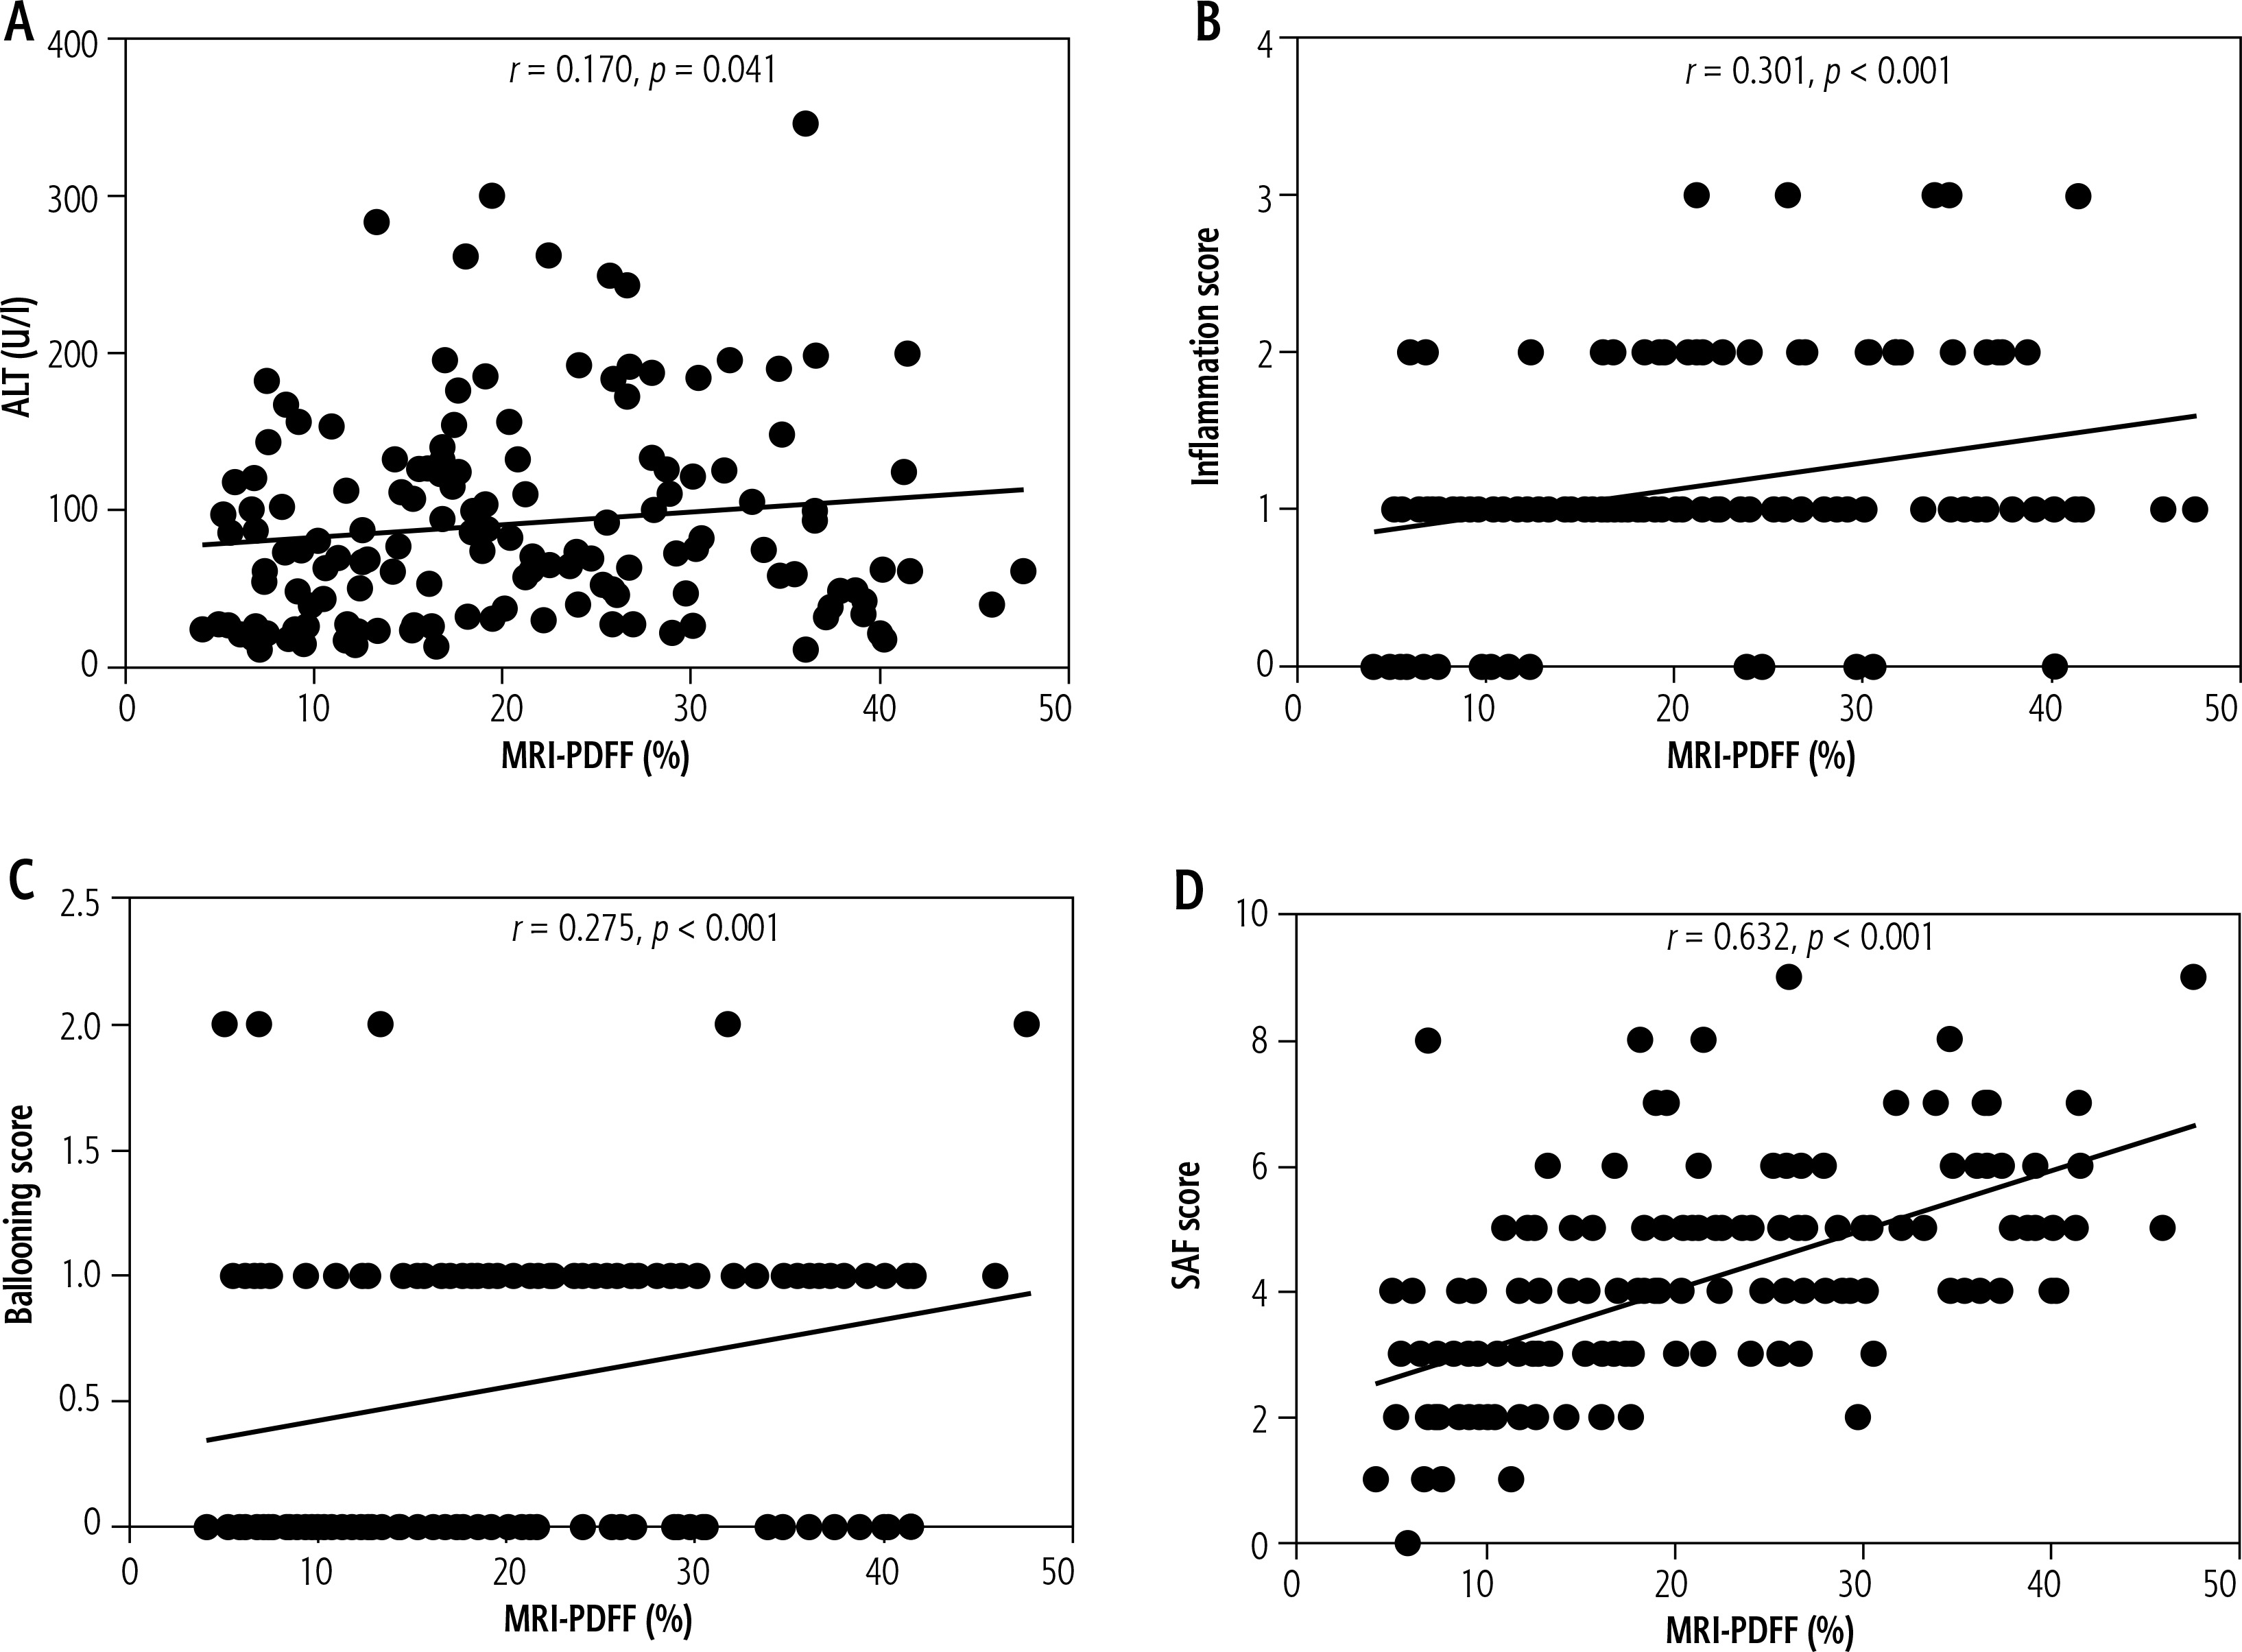
A total of 146 Han Chinese MASLD patients had received liver biopsy, which was performed within 2 weeks of MRI-PDFF and laboratory tests with assessment of measured serum ALT levels. Detailed baseline demographics and pathologic characteristics of these Han Chinese MASLD patients are presented in Suppl. Table 3. Spearman’s rank correlation analysis was conducted between serum ALT levels, inflammation scores, ballooning scores, and SAF scores of liver biopsies with average LFC, respectively. The levels of ALT showed a positive correlation with the average LFC (r = 0.170, p = 0.041; Fig. 3A), suggesting that Han Chinese MASLD patients with higher serum ALT levels tend to have severe liver steatosis. As expected, Han Chinese MASLD patients with greater liver histological severity also showed higher LFC, with significant correlations found for inflammation scores (r = 0.301, p < 0.001, Fig. 3B); ballooning scores (r = 0.275, p < 0.001; Fig. 3C); and SAF scores (r = 0.632, p < 0.001; Fig. 3D).
Discussion
Metabolic dysfunction-associated steatotic liver disease exhibits significant ethnic heterogeneity in its pathogenesis and clinical manifestations. While current diagnostic criteria emphasize metabolic factors, emerging evidence suggests that lean MASLD patients, particularly in East Asian populations, may represent a distinct subtype driven by non-traditional risk factors. Previous studies in Caucasian cohorts have established the association between obesity, insulin resistance, and hepatic steatosis, but data on Han Chinese populations remain limited despite their higher susceptibility to lean MASLD. This multicenter study aimed to compare the metabolic profiles and liver injury patterns between Han Chinese and Caucasian MASLD patients, with specific focus on ethnic differences in LFC after adjusting for confounders and the differential role of aminotransferases (ALT/AST) in predicting steatosis severity. Our findings indicated that, compared with Caucasian individuals, Han Chinese MASLD patients displayed increased LFC after adjusting for potential confounders. Furthermore, a significant impact of ALT and/or AST levels on steatosis severity was observed in Han Chinese but not Caucasian individuals. These findings challenge the universal application of Western-derived MASLD criteria and highlight the need for ethnicity-specific management algorithms, particularly regarding ALT monitoring in lean Asian patients.
Among the matched sex and age subgroups, Han Chinese MASLD patients had higher levels of average LFC than Caucasians in the matched age, sex, BMI and LFC category after PSM. This is supported by a recent report with the hepatic steatosis assessed by CT and controlled attenuation parameter (CAP) that directly compared 101 and 160 MASLD patients recruited from the United States and China (liver CT scan 40.7 vs. 47. 3 HU, CAP 335 vs. 298 dB/m, all p < 0.001) [6, 28]. The MRI-PDFF adopted in our research was found to be much more accurate in estimating liver steatosis than CT and CAP [29]. Moreover, previous studies with multiethnic data from the USA showed that being Asian as a race interacts with visceral fat measured by dual X-ray absorptiometry (DXA) in the multivariable logistic regression model, contributing more to the increased CAP independent of BMI and waist circumference using Caucasians as controls [30, 31]. These findings support the hypothesis that different patterns of visceral fat accumulation in Asians and Caucasians may similarly exist in liver fat accumulation [32]. The finding that the Han Chinese population presented more severe steatosis than the Caucasian population may imply that increased awareness and specific monitoring of LFC might be advocated for Asians in clinical practice.
The current study highlights a novel racial distinction in the ALT/AST-LFC relationship, validated through histologic analysis. Elevated ALT/AST levels, established biomarkers of inflammatory liver damage [33], showed a positive correlation with both LFC and inflammation scores in Han Chinese MASLD patients, suggesting that severe steatosis may parallel heightened inflammation. A positive correlation between average LFC and serum ALT or AST did not exist among Caucasian MASLD patients derived from the Biobank database. This is in accordance with a recent analysis of pooled data from 3 phase 2a trials that also applied MRI-PDFF as the tool of steatosis assessments for Caucasians with MASLD [34]. It included 370 participants with a mean baseline MRI-PDFF of 17.4 ±8.6% and a correlation with only ALT (r = 0.40, p < 0.002) but not AST (r = 0.22, p = 0.30). Another two studies with available liver biopsy data obtained similar results regarding liver steatosis and inflammation as our findings. R. Mohanty’s study suggested that Asians had a higher grade of ballooning and lobular inflammation than Caucasians [35]. Similarly, another study found some evidence that severe steatosis and severe inflammation were related to Asian background [8, 36]. The reason for this discrepancy remains unclear. It is possible that the overflow of free fatty acids entering the liver was more obvious in Asians as Asians accumulate more adipose fat and are more prone to insulin resistance than Caucasians at an equivalent weight level. This promotes the formation of fat disposition in hepatocytes, and the subsequent lipotoxic products contribute to oxidative stress with subsequent inflammatory activation and cell damage. Based on the currently known genetic diversity, we speculate that genes related to the pathways of lipolysis or lipogenesis may be associated with this discrepancy, especially the genetic polymorphism of PNPLA3. The PNPLA3 gene controls the excretion of very low-density lipoprotein (VLDL) in the liver, and its genetic variant I148M increases the risk of fat accumulation and injuries in the liver under environmental stress [37, 38]. Therefore, it can be speculated that the distribution of PNPLA3 I148M across different races might explain the different associations between liver fat contents and elevated levels of serum transaminases in individuals within the same obesity degree [39]. However, it has been reported that 35% of individuals from East Asia carry PNPLA3 I148M, compared to 23% among Europeans [40, 41]. The Han Chinese MASLD patients in this study may have higher frequency of PNPLA3 G single-nucleotide polymorphism than Caucasian individuals, thus resulting in higher levels of liver LFC and injury, which manifested as a related higher level of serum ALT and/or AST. As a result, LFC with MRI-PDFF might have a higher predictive value for liver injuries in Asians versus a limited predictive value in Caucasians.
One strength of this study is the use of MRI-PDFF, which has high concordance and stability with the diagnosis of liver steatosis by liver pathology estimation and determines the average LFC relatively accurately. MRI-PDFF is still not a practically available method for the general population, in any region worldwide. Firstly, Han Chinese MASLD patients in the current study were from the general population, were informed of the possible presence of fatty liver by their health check-up via abdominal ultrasound screening, and received disease treatment and management. Similarly, Caucasian MASLD patients from the UK Biobank were recruited from the general population, had risk factors such as metabolic abnormality, and further underwent MRI-PDFF. Therefore, we chose Han Chinese MASLD patients from hospital clinic as counterparts to the Caucasian MASLD patients from UK Biobank.
However, this study had several limitations. The retrospective design without an identical protocol might increase the selection bias. The Chinese group represented patients admitted to the healthcare units due to MASLD and as such presumably presented greater disease severity than the British group originating from the prophylactic screening program. The differences observed could be related to recruitment issues rather than representing the inherent differences between populations due to ethnicity, nutrition, etc. Thus, we focused on the associations among variables (including metabolic and liver parameters) instead of their distribution differences in the two races. Secondly, applying statistical adjustments of PSM might help to control the selection bias and confounding factors to a minimum to ensure the comparability between the two groups. Several limitations may have an impact on our conclusions. Baseline mismatch may be one of the clinical features of MASLD between Han Chinese and Caucasians, but it also brought more confounding factors. The lack of histologic data of Caucasians may lessen the confidence of the associations of histological characteristics with ALT and LFC, as well as metabolic abnormalities. Lastly, due to the lack of dietary, exercise, and genetic data, we are unable to further clarify the effects of these factors on MASLD. Our findings may provide insights for further in-depth research to explore the specific causes of these differences and the role played by races in the future. In future studies, we would continuously recruit more matching MASLD patients from both races in the same region and period to build a comprehensive medical system with detailed data of democracy, life style, dietary habits, anthroposomatology, laboratory indicators, imaging, histology, and genetic data to elucidate the discrepancies and causes of differences between the two races.
Conclusions
In summary, compared with Caucasian MASLD patients, Han Chinese MASLD patients had more severe liver steatosis related higher levels of ALT and AST, which may indicate more severe liver inflammation. Moderate-to-severe steatosis might be a more reliable markers of liver injury in Han Chinese than Caucasian patients, and these findings may suggest that higher steatosis induced liver inflammation, indicating that greater sensitivity of hepatic lipotoxicity might exist in Han Chinese. Further larger cohorts of patients with prospective design and enrolled from multiple sites in each ethnicity at the same time are needed to confirm our findings and long-term response to treatments in Caucasian vs. Han Chinese patients with MASLD.
Footnote
An earlier version of this manuscript was previously posted as a preprint and made openly available on Research Square: Limin Lin, Junzhao Ye, Zhiyong Dong, Shiting Feng, Bing Liao, Xiaodong Zhuang, Bihui Zhong (2022). [Heterogeneity on the steatosis related hepatic injuries of patients with metabolic associated fatty liver disease between Han Chinese and Caucasian]. Research Square. https://doi.org/10.21203/rs.3.rs-2154068/v1. We have updated the analysis and enrollment to improve our study in the current version.


