
Introduction
Hepatic encephalopathy (HE) is a brain dysfunction caused by liver insufficiency and/or portosystemic shunting; it manifests as a wide spectrum of neurological or psychiatric abnormalities ranging from subclinical alterations to coma [1]. It represents a spectrum of reversible cognitive changes ranging from mild inattention and executive function deficits to more advanced stages marked by lethargy, disorientation, and even coma [2, 3]. Although the pathogenesis of HE is multifactorial [4], ammonia remains the best-characterized neurotoxin implicated in the pathogenesis of HE [5].
The International Society for Hepatic Encephalopathy and Nitrogen Metabolism (ISHEN) consensus outlined the symptoms and their grading into covert (minimal HE [MHE] and grade I) and overt HE (OHE, grades II-IV) in September 2014 [1]. MHE is highly prevalent – albeit underrecognized – among patients with cirrhosis, affecting up to 80% of this subset of patients [6]. It negatively affects quality of life for patients and their families [7]. MHE has been shown to interfere with daily functioning, such as the ability to safely operate a vehicle [8]. The diagnosis of MHE can be challenging. Patients with MHE have normal findings on clinical examination, but abnormal psychometric test results. Subtle symptoms of MHE can only be diagnosed through specialized neuropsychiatric testing [9].
The gold standard for MHE is formal consultation with an expert neuropsychologist to administer and score a battery of timed paper-pencil tests in a controlled setting [10]. This is costly, often unavailable, and therefore most clinicians do not routinely employ such testing for their patients [11]. In the past decade, point-of-care alternatives have emerged. These include the critical flicker frequency (CFF) test [12, 13], the inhibitory control test (ICT) [14], and the Stroop test, which has been integrated into a smartphone app (EncephalApp) [15], among others. These tests have not been adequately validated in a real-world setting and a consensus on the corresponding optical cutoff points has not been reached. In a previous study, serum levels of 3-nitrotyrosine (were shown to be a good predictor of the presence of MHE in patients with cirrhosis [16]. Our aim was to evaluate the utility and accuracy of CFF, a modified version of ICT and serum 3-nitrotyrosine levels in the diagnosis of MHE, compared to the gold standard – Psychometric Hepatic Encephalopathy Score (PHES).
Material and methods
This case control study was conducted on 80 patients with hepatitis C virus (HCV)-related compensated liver cirrhosis who presented to the outpatient clinics at National Liver Institute, Menoufia University in Egypt for their regular follow-up visits. HCV was documented by positive PCR HCV RNA. Cirrhosis was confirmed by the clinical, laboratory, and radiological characteristics [1]. Absence of decompensation is established by absence of variceal bleeding, ascites, jaundice, and hepatic encephalopathy [1].
The control group was selected from age- and sex-matched healthy volunteers.
Inclusion criteria of the study were patients with compensated liver cirrhosis aged 18-70, with no previous episodes of OHE. HBV-related chronic liver disease, or with known neurological effects such as recent or old infarction, Wilson disease, hepatocellular carcinoma, alcohol abuse, drug abuse and/or the concurrent use of neuropsychiatric drugs constituted the exclusion criteria of the study. Illiterate patients were also excluded.
Study protocol
Approval of the National Liver Institute’s Ethical Committee, along with written informed consent, were obtained from the enrolled subjects prior to commencement in the study. Demographic data were collected for the study subjects. Thorough history taking and physical examination – including pelviabdominal ultrasound – were then conducted. Patients underwent baseline laboratory testing, including liver function tests, renal function tests and complete blood counts. Positive HCV PCR RNA, along with negative viral markers for hepatitis B virus (HBV) infection, was determined. Furthermore, Child-Pugh score and FIB-4 index were calculated for the study subjects. All patients were subsequently subjected, on the same day each, to psychometric testing, the CFF test, ICT and measurements of plasma ammonia and serum 3-nitrotyrosine levels.
Psychometric Hepatic Encephalopathy Score
The Psychometric Hepatic Encephalopathy Score (PHES) – a battery that includes five paper-pencil tests – was used as the gold standard to define MHE and subsequently assign patients to one of the two study groups (MHE and control groups). PHES included number connection tests (NCTs) A and B, the line drawing test, the serial dotting test and a digit symbol test. Performance on each test was scored in seconds and expressed as standard deviations (Z-scores) from the average values obtained from healthy controls [10]. The PHES was the sum of each component: –3 for Z < –3, –2 for Z < –2, −1 for Z < –1, 0 for –1 < Z < 1, 1 for Z > 1. PHES was considered abnormal with a Z-score cutoff ≤ –4 [17-19], with subsequent assignment of the patient to the MHE group.
Critical flicker frequency test
Critical flicker frequency was defined as the frequency at which a fused light (presented from 60 Hz downward) appeared to be flickering to the observer. Studies have shown its reduction with worsening cognition and improvement after therapy [12, 13].
Modified inhibitory control test
Inhibitory control test is a computerized test of response inhibition and working memory that is freely downloadable at www.hecme.tv [14]. While the original version of the test used the English letters X/Y to define targets of the test, we adapted a special modification to the test by using the numbers 7/8 in Arabic (ν/∧) as targets; this modification was created by expert staff members at the Faculty of Computers and Information, Menoufia University, to suit Egyptian patients.
The plasma ammonia test procedure was done using a Cobas Integra 800 Auto analyzer (Roche Diagnostics Ltd., Germany, catalogue number: M, 87432).
Serum 3-nitrotyrosine levels: it was measured using the quantitative sandwich enzyme immunoassay technique (ELISA). Adding the substrate to a complex of 3-nitrotyrosine antigen, antibody, and a catalyzing enzyme; makes it blue. This is followed by adding the HRP catalyzing enzyme. The reaction is terminated by the addition of a sulfuric acid solution and the color change is measured spectrophotometrically at a wavelength of 450 nm. The concentration of 3-nitrotyrosine in the samples is then determined by comparing the O.D. of the samples to the standard curve.
Statistical analyses
Data were analyzed using SPSS statistical software (version 24, IBM Corp., Armonk, NY, USA). Numerical variables were expressed as means and standard deviation (SD). Categorical variables were expressed as numbers and percentages. The independent t-test was used to compare means for numerical variables between the study groups. The χ2 test was used to compare categorical variables. Receiver operating characteristic (ROC) curves were drawn to estimate the accuracy of different tests and measures in the diagnosis of MHE. The area under the ROC (AUROC) curve was then calculated. An optimal cutoff value with the most acceptable accuracy was selected for each test and/or measure. A p-value was considered significant below 0.05.
Results
Forty patients (50%) scored higher than –4 SD on PHES and comprised our control group. The remaining forty patients (50%), who scored –4 SD or lower on PHES, comprised the MHE group (Table 1).
Table 1
Classification of cases according to PHES
| PHES | ||
|---|---|---|
| Normal (> –4 SD) | 40 (50%) | |
| Impaired | ||
| –4 SD | 27 (33.75%) | |
| –6 SD | 13 (16.25%) | |
The mean age of the two study groups were 50.65 ±6.91, 52.88 ±6.7 years in the control and MHE groups respectively. Forty-nine patients (61.3%) were female. There were no significant differences between the two study groups regarding age, gender, aspartate aminotransferase (AST), alanine aminotransferase (ALT), serum albumin, serum bilirubin levels, platelet count, Child-Pugh score and FIB-4 index (Table 2).
Table 2
Differences in the baseline characteristics and demographics between the study groups
Overall, patients scored 39.3 ±2.3 Hz on the CFF test and 6.78 ±3.43 unweighted lures on modified ICT. Plasma ammonia and serum 3-nitrotyrosine levels were 75.3 ±33 µmol/l and 22.6 ±18.3 nmol/l in the study subjects, respectively (Table 3).
Table 3
Tests of minimal hepatic encephalopathy in the study groups
Univariate analysis of different measures and tests of minimal hepatic encephalopathy in the study groups
Patients in the MHE group scored significantly lower on the CFF test, compared to the control group (38.5 Hz vs. 40 Hz, p = 0.003). The mean number of unweighted lures on modified ICT was 8.7 and 4.9 in the MHE and control groups, respectively (p < 0.001). Moreover, plasma ammonia levels were significantly higher in the MHE group, compared to the control group (89 vs. 61.5 µmol/l, p < 0.001). Serum 3-nitrotyrosine levels were also significantly higher in the MHE group, compared to the control group (31.5 vs. 13.7 nmol/l, p < 0.001). The results of the univariate analyses are tabulated in Table 4.
Table 4
Area under the receiver operating characteristic curve (AUROC) of different measures and tests of minimal hepatic encephalopathy in the study population
Accuracy of different measures and tests of minimal hepatic encephalopathy in the study groups
ROC curves were drawn for different predictors and tests of MHE (Fig. 1). AUROC was then estimated. An optimal cutoff point with the most acceptable accuracy was selected for each test and measure (Table 5).
Table 5
Accuracy of the optimal cutoff points of different measures and tests of minimal hepatic encephalopathy in the study population
Fig. 1
A) Receiver operating characteristic (ROC) curve demonstrating the accuracy of critical flicker frequency test in the diagnosis of minimal hepatic encephalopathy (MHE) in the study population. B) ROC curve demonstrating the accuracy of modified inhibitory control test in the diagnosis of MHE in the study population. C) ROC curve demonstrating the accuracy of plasma ammonia levels in the diagnosis of MHE in the study population. D) ROC curve demonstrating the accuracy of serum 3-nitrotyrosine levels in the diagnosis of MHE in the study population
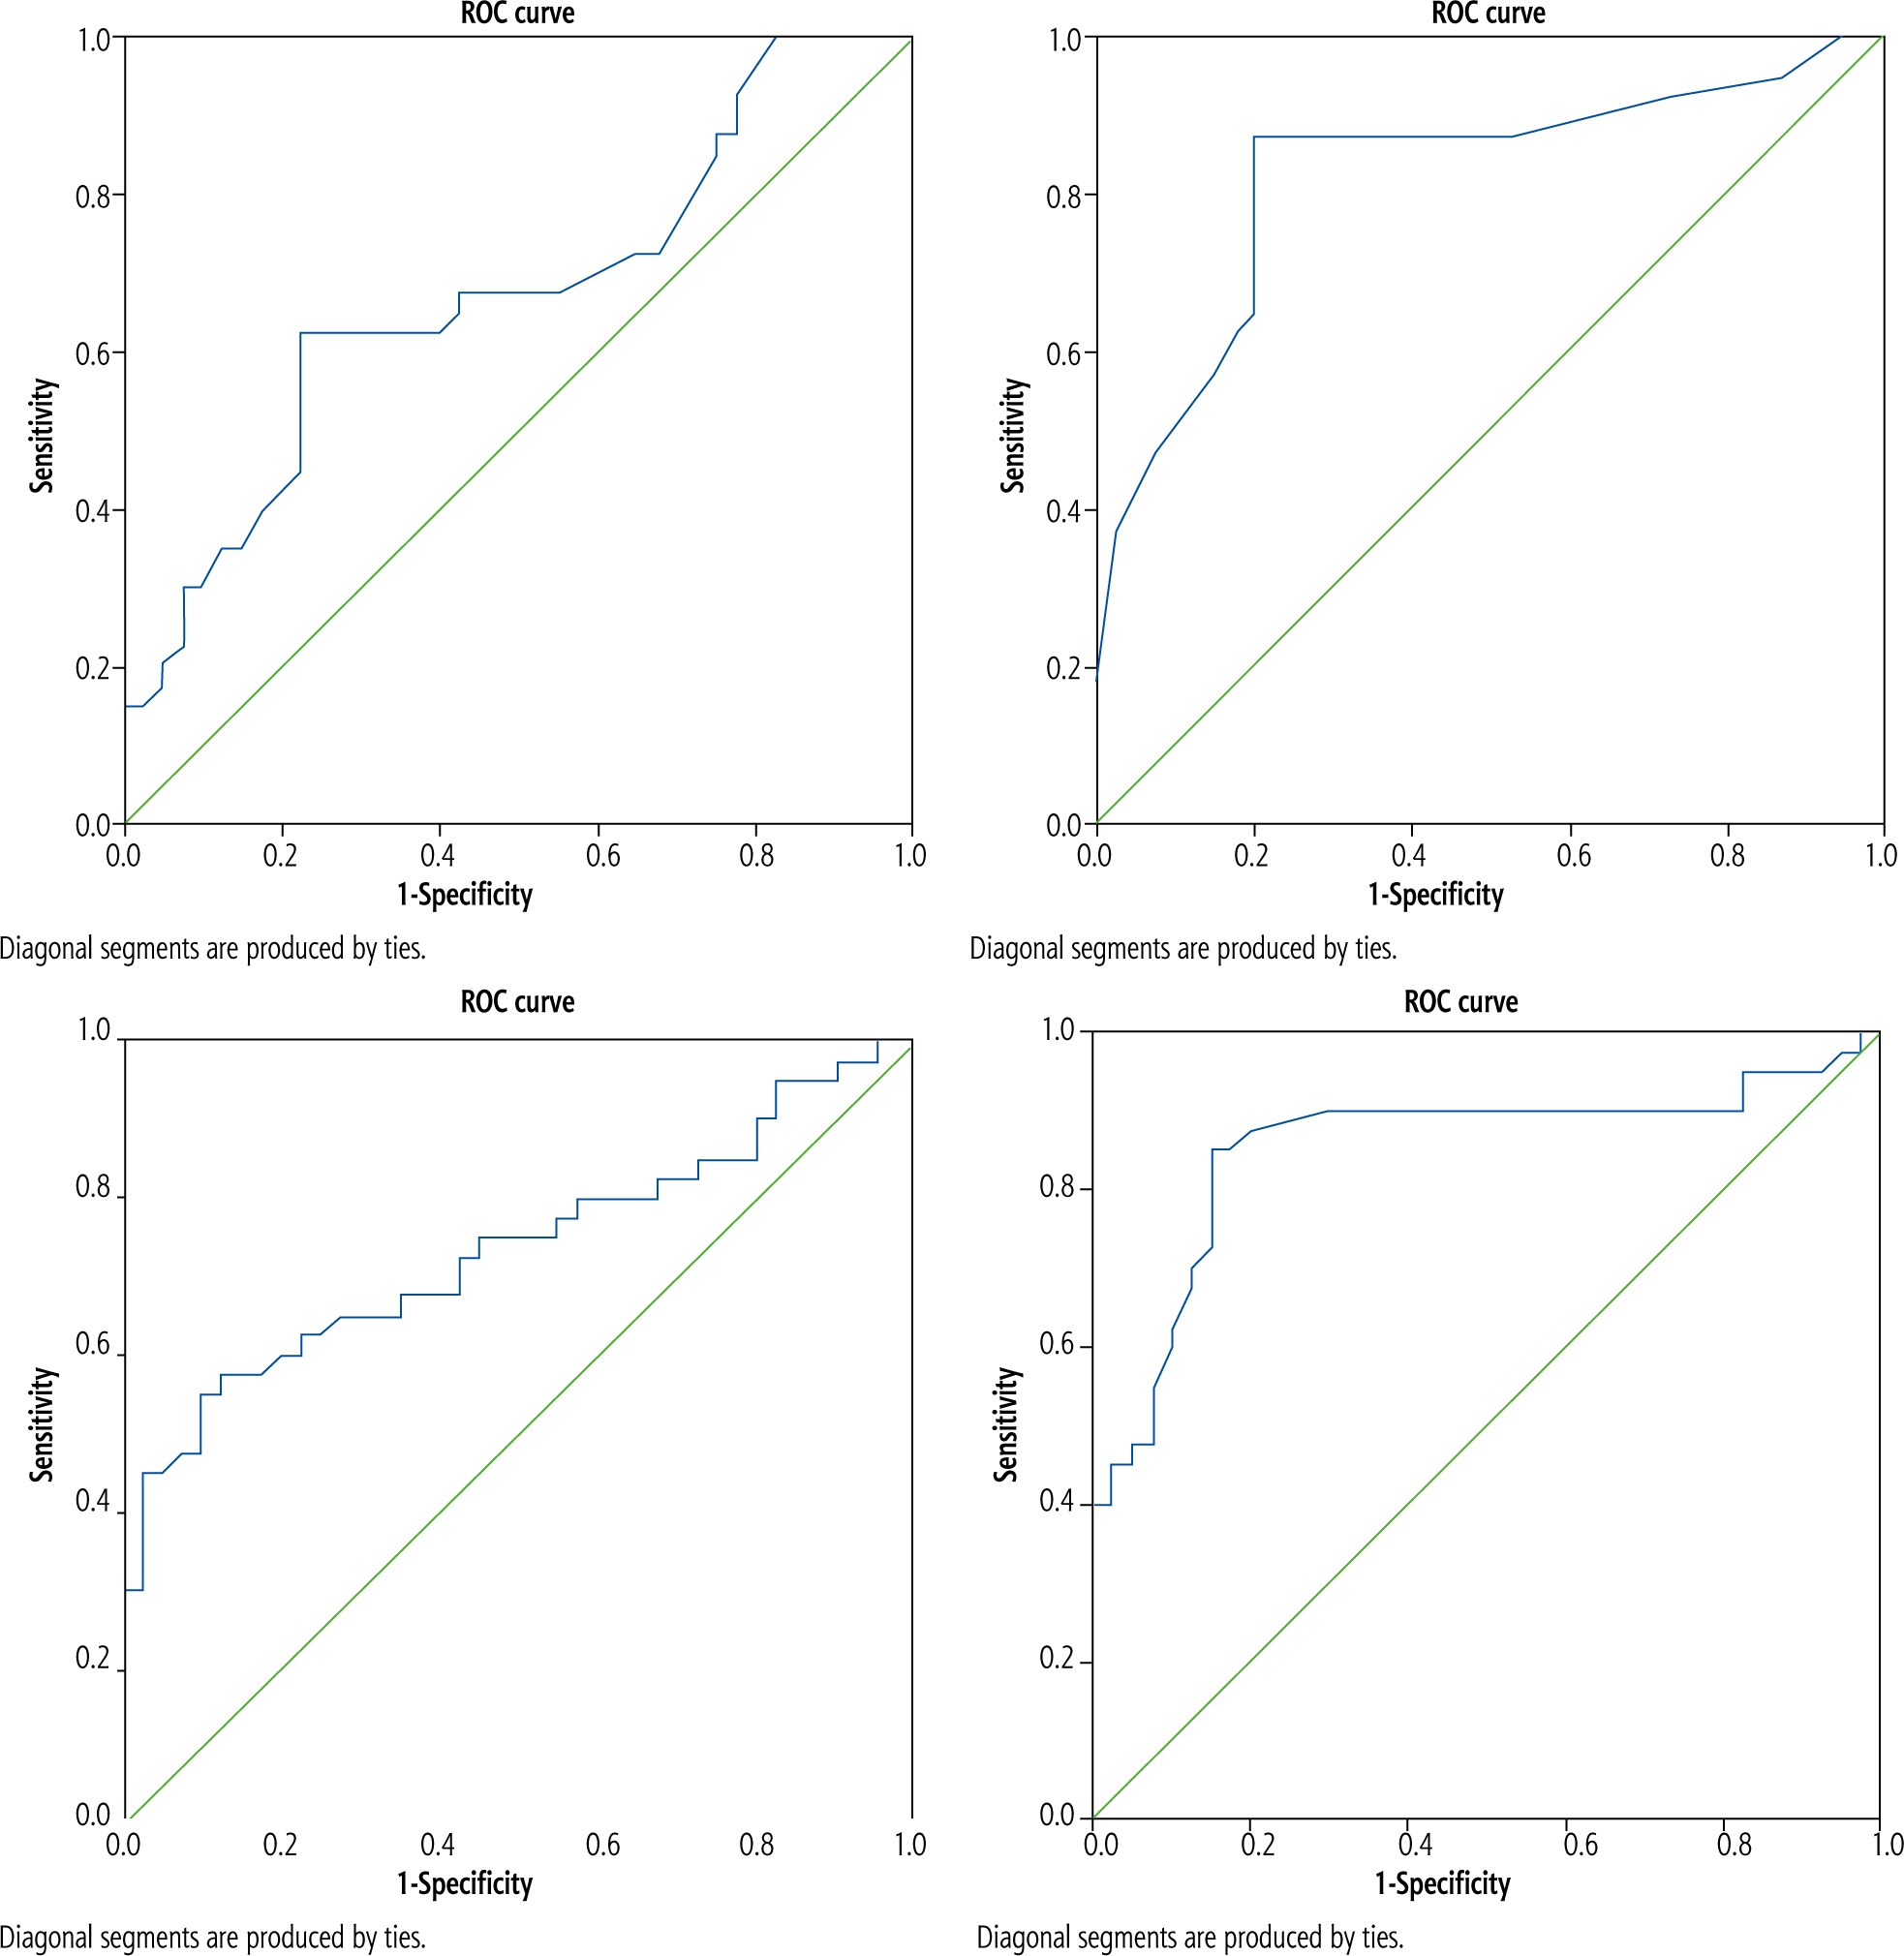
CFF test: AUROC was 0.670 (95% CI: 0.551-0.789, p = 0.009). A cutoff of < 39 Hz had a sensitivity, specificity, positive predictive value (PPV) and negative predictive value (NPV) of 57.5%, 77.5%, 71.9% and 64.6%, respectively with an overall accuracy of 67.5% in the diagnosis of MHE in the study population (Fig. 1A, Table 5).
Modified ICT: AUROC was 0.827 (95% CI: 0.732-0.921, p < 0.001). A cutoff of > 5 unweighted lures had a sensitivity, specificity, PPV and NPV of 87.5%, 80.0%, 81.4% and 86.5%, respectively with an overall accuracy of 83.8% in the diagnosis of MHE in the study population (Fig. 1B, Table 5).
Plasma ammonia: AUROC was 0.735 (95% CI: 0.623-0.847, p < 0.001). A cutoff of ≥ 76.45 µmol/l had a sensitivity, specificity, PPV and NPV of 65.0%, 72.5%, 70.3% and 67.4%, respectively with an overall accuracy of 68.8% in the diagnosis of MHE in the study population (Fig. 1C, Table 5).
Serum 3-nitrotyrosine: AUROC was 0.854 (95% CI: 0.763-0.945, p < 0.001). A cutoff of ≥ 14.15 nmol/l had a sensitivity, specificity, PPV and NPV of 85.0%, 82.5%, 82.9% and 84.6%, respectively with an overall accuracy of 83.8% in the diagnosis of MHE in the study population (Fig. 1D, Table 5).
Multivariate analysis of predictors of minimal hepatic encephalopathy in the study population
On multivariate analysis, CFF test < 39 Hz (OR = 10.2, p = 0.04), modified ICT > 5 unweighted lures (OR = 43.2, p = 0.002), and serum 3-nitrotyrosine levels ≥ 14.15 nmol/l (OR = 50.4, p < 0.001) were significant independent predictors of MHE in the study population after adjusting for age, FIB-4 index, Child-Pugh score and plasma ammonia levels (Table 6).
Table 6
Multivariate analysis of predictors of minimal hepatic encephalopathy in the study population
Discussion
The prevalence of MHE in patients with liver cirrhosis can be as high as 80% [6]. It has also been linked to poor driving outcomes in addition to affecting other domains of the patient’s life, particularly causing a poor health-related quality of life, an impact on socioeconomic status and a higher incidence of falls [20, 21]. Early diagnosis of MHE is therefore crucial for enhanced quality of life for patients with liver cirrhosis, and for the safety of the patient and the public. While psychometric tests remain the gold standard for MHE diagnosis [10], they are still costly and time-consuming. As a result, alternative diagnostic tests have emerged [12-14, 16]. However, the latter have not been adequately validated.
We found that, compared to the conventional PHES, a modified version of ICT and serum 3-nitrotyrosine levels possessed the highest accuracy in diagnosing MHE in patients with compensated liver cirrhosis. At cutoff points of > 5 unweighted lures and 14.15 nmol/l, the modified ICT and serum 3-nitrotyrosine levels, respectively, had an overall accuracy of 83.8% each in diagnosing MHE in the study population. Additionally, the modified ICT and serum 3-nitrotyrosine levels had the largest AUROCs of 0.827 (p < 0.001) and 0.854 (p < 0.001), respectively, in the diagnosis of MHE.
The ICT is a computerized test of attention and response inhibition that has been used to characterize attention deficit disorder, schizophrenia, and traumatic brain injury [22-26]. In our study, we utilized a modified version of the test that uses the numbers 7/8 in Arabic (ν/∧) as targets in lieu of the traditional X/Y – a modification to fit the Egyptian patients better. Patients in the control group scored significantly lower unweighted lures on the modified ICT, compared to the MHE group (4.9 ±2.47 vs. 8.65 ±3.24, p < 0.001).
In the current work, the modified ICT had an AUROC of 0.827. At a cutoff point of > 5 unweighted lures, the modified ICT had the highest accuracy in diagnosing MHE in the study population (83.8%). Among the published studies, the optimal lure cutoff had been notably variable. In a study by Bajaj et al. [14], ICT had an AUROC of 0.902 and overall accuracy in the diagnosis of MHE of 82% at > 5 lures cutoff, which support our findings. Another study by Bajaj et al. confirmed these findings; at a cutoff of > 5 lures, the overall accuracy was 90% with an AUROC of 0.958 [27]. Other studies reported higher optimal cutoffs for ICT in the diagnosis of MHE (14-27.8 lures), although with variable AUROCs (0.7-0.86) and overall accuracy (71.8-85.6%) [19, 28, 29].
Serum 3-nitrotyrosine has performed remarkably well in our study in diagnosing MHE with an AUROC of 0.854 and an overall accuracy of 83.8% at a cutoff of 14.15 nmol/l. Montoliu et al. evaluated the utility of different serum biomarkers in the diagnosis of MHE including serum 3-nitrotyrosine levels in two cohorts [16]. In their first cohort, serum 3-nitrotyrosine levels had an AUROC of 0.96 with an overall accuracy of 91% at a cutoff of 14 nmol/l. When applying the same cutoff in their second cohort of patients, the accuracy of 3-nitrotyrosine levels was 88.5%.
Our study had several limitations. Firstly, the study was performed at a single center; despite being a tertiary referral center, it limited the potential for generalization of the findings without validation in future multicenter clinical trials. Secondly, the limited sample size in our study – despite the difficulties in performing four modalities for the same patient at the same session – might be considered a weakness. However, being a study from Egypt with the highest rates of HCV with its consequences along with the highest rates of car accident mortalities and morbidities might have added substantial value to this study. Additionally, the authors thought that it might be the first study on this topic which assembled and evaluated four diagnostic modalities for the same groups of patients.
Collectively, early detection of MHE in cirrhotic patients has become a necessity in clinical practice. Identification of patients with MHE will allow their treatment, therefore improving their quality of life.
Conclusively, serum level of 3-nitrotyrosine – as a biochemical marker – has proved the highest efficacy in identifying the presence of MHE in mostly illiterate Egyptian patients with liver cirrhosis. ICT is also sensitive, reliable, valid, inexpensive, and can be administered by clinic personnel without the need for psychologic expertise, and can be relied on for MHE detection. Both former tests are suitable for the Egyptian population with special educational and medical situation. CFF was the least and last preferable modality in this study, while ammonia had poorly performed in MHE detection due to other interfering factors regarding the clinical status of the patients.
Ethical statement
The study complied with the ethical standards of research underpinned by five core values of ethical research, consistent with the National Statement on Ethical Conduct in Human Research: informed consent, voluntary participation, privacy and confidentiality, justice and beneficence, and right to review.


