
Summary
This study investigated the short-term predictive value of non-alcoholic fatty liver disease fibrosis score (NFS) in patients who underwent coronary computed tomographic angiography (CCTA). Patients with higher NFS were found to have a greater incidence of myocardial infarction, death, and coronary angiography. Moreover, both NFS and Agatston scores were equally effective in predicting severe coronary artery disease and short-term primary outcomes (mainly driven by repeated coronary angiography). An NFS above –0.92 could predict the primary outcome (death, myocardial infarction, and coronary angiography) with 61% sensitivity and 63% specificity, while an NFS above –0.88 could predict severe coronary artery disease with 62% sensitivity and 65% specificity.
Introduction
Non-alcoholic fatty liver disease (NAFLD) is the most common chronic liver disease in Western countries [1]. NAFLD is associated with many additional diseases such as obesity, metabolic syndrome, type 2 diabetes mellitus, and dyslipidemia [2]. The NAFLD fibrosis score (NFS) is based on laboratory tests and it has proven to be a prognostic indicator for predicting the risk of developing advanced fibrosis and mortality [3]. Patients with type 2 diabetes mellitus with a high NFS have been shown to have more vascular complications [4]. Another study found that the patients with hepatic steatosis and a high liver fibrosis score had a more atherogenic lipid profile [5]. Additionally, cardiovascular mortality is higher in patients with high liver fibrosis scores [6].
Coronary computed tomographic angiography (CCTA) is the most important non-invasive diagnostic tool for showing coronary plaque burden and characteristics [7]. A study using a 64-slice computed tomography (CT) scan showed a correlation between NFS and FIB-4 score with coronary artery calcification [8].
Aim
In the present study, using high-slice (640-slice) CCTA, we aimed to examine plaque formation in CCTA and its relationship with NAFLD. Additionally, we aimed to demonstrate the short-term impact of NFS on outcomes such as the need for coronary angiography, death, and recurrent revascularization in these patients.
Material and methods
Study design and population
This study took place from January 2021 to January 2022 and involved retrospectively evaluating patients who underwent CCTA. We reviewed the demographic and clinic characteristics of these patients from their medical records. To ensure the accuracy of our results, we excluded patients who were under 18 years of age, had known coronary artery disease, lacked clinical information, consumed excessive amounts of alcohol (more than 21 drinks per week for men and more than 14 drinks per week for women), had missing liver enzyme levels, or had active or chronic liver disease. After excluding 334 patients, a total of 499 patients remained for analysis. We followed the ethical guidelines of the Declaration of Helsinki and obtained approval from the Ethics Committee of our university (GOKAEK-2023/05.10).
Data collection and definitions
The present study collected admission and follow-up clinical information, including demographic data, biochemical data, lifestyle, medical history, and use of medications, for each patient from computerized hospitalization medical records. Telephone interviews were used when necessary. Diabetes at baseline was defined as fasting blood glucose levels of ≥ 126 mg/dl and/or a history of diabetes, while hypertension was defined as blood pressure levels of ≥ 140/90 mm Hg at admission and/or a previous diagnosis of hypertension. Dyslipidemia was defined according to the latest guidelines or treatment with lipid-lowering drugs, considering patient risk factors [8]. Additionally, a family history of coronary artery disease (CAD) was determined when CAD was found in first-degree relatives aged < 55 (male) or < 65 (female) years.
Liver fibrosis score
Liver fibrosis was estimated by NFS: −1.675 + 0.037 × age (years) + 0.094 × body mass index (kg/m2) + 1.13 × diabetes mellitus (if present, given 1) + 0.95 × aspartate transferaminase (AST) (U/l) to ALT (U/l) ratio – 0.013 × platelet count (10–9/l) – 0.66 × albumin (mg/l) [9]. The patients were divided into three groups based on NFS values: lower risk (NFS < –1.455), moderate risk (–1.455–0.676), and high risk (> 0.676) [9].
Coronary computed tomography angiography
The present study involved the performance of CCTA using a state-of-the-art 640-slice scanner, the Aquilion ONE Genesis Edition, manufactured by Canon Medical Systems, Otawara, Japan. The scan was conducted utilizing a voltage of 100–120 kV, which was tailored to the patient’s body weight, and a current intensity of 250–500 mA, which was automatically determined based on the patient’s scanogram data. The gantry rotation time was set at 275 ms, while the scan collimation was manually planned in the range of 0.5 × 100 mm to 0.5 × 160 mm, taking into account the size and location of the area of the heart to be scanned. Moreover, the field of view (FOV) was set between 200 and 270 mm to cover the region from the tracheal bifurcation to the base of the heart.
Non-contrast-enhanced coronary tomography was performed in each patient for assessment of the Agatston calcium score [10]. The extent of CAC is calculated by multiplying the area of lesions with a density of ≥ 130 Hounsfield units (HU) with a density factor derived from the maximum density of each lesion (1 for 130–199 HU, 2 for 200–299 HU, 3 for 300–399 HU, and 4 for lesions ≥ 400 HU). The total score was calculated by summing up the scores of each lesion.
During the medical procedure, a volume of 50–80 ml of iodinated contrast medium (350 mg/ml) was administered intravenously at a rate of 5 ml/s, followed by a saline solution of 20 ml. The images were reconstructed in synchronization with an electrocardiogram (ECG) in prospective (40–70 BPM), modulated (70–90 BPM), and retrospective (90–120 BPM) scans. The imaging system automatically provides images at the 75% phase of the RR interval, as well as the most optimal phase generated by the software. However, in cases where the optimal phase is not achieved, the operator utilizes the software to create the most appropriate phase, beat, and functional information.
The acquired images were transferred to a workstation (Vitrea Advanced, United States) for image reconstruction. Various image reconstruction techniques such as axial images, multiplanar reconstruction (MPR), three-dimensional volume rendering (VR), curved planar reformat (CPR), cinematic rendering using global illumination rendering (GIR), and three-dimensional maximum intensity projection (MIP) images were employed to meticulously evaluate the existence of coronary artery stenosis and plaque.
The degree of stenosis was meticulously evaluated and quantified in each coronary segment. Severe coronary artery disease was defined as the presence of stenosis equal to or greater than 50% in the main coronary artery, or equal to or greater than 70% in other coronary arteries [11, 12]. The interpretation of the CCTA was done by an experienced radiologist.
Statistical analysis
All calculations were performed using the SPSS 20.0 software package (IBM Corp., Armonk, NY, USA). The normal distribution of data was assessed using the Kolmogorov-Smirnov test. Numerical variables showing normal distribution were presented as mean ± standard deviation, while numerical variables not following normal distribution were presented as median (interquartile range). Categorical variables were presented as frequencies (percentages). For normally distributed numerical data, group comparisons were conducted using the analysis of variance (ANOVA) test. The Kruskal-Wallis test was used for numerical variables that did not follow a normal distribution. Categorical variables were evaluated using cross-tables and the χ2 test. Receiver-operating characteristic (ROC) analysis was performed to calculate the predictive value of the NFS for primary outcomes and severe coronary artery disease. Multivariate Cox regression analysis was used to assess factors influencing primary outcomes, and multivariate logistic regression analysis was used to identify independent predictors of severe coronary artery disease. Survival analysis for primary outcomes was conducted using the Kaplan-Meier method, stratified by NFS groups. Survival differences were analyzed using the log-rank test. p < 0.05 was considered as statistically significant.
Results
The study included 499 patients, with a mean age of 61.9 ±9.3 years, and 54.7% of whom were male. No significant differences were found in gender and BMI among the NFS groups (p > 0.005). However, patients in the higher NFS groups were older than those in the other groups (p < 0.001) (Table I). The low NFS group had higher LDL values (p = 0.019), whereas the high NFS group had significantly lower hemoglobin levels and higher blood glucose values (respectively, p < 0.001 and 0.001). Triglycerides, HDL, albumin, creatinine, AST, ALT, and platelet values were similar in all three groups. The high NFS group had a higher prevalence of hypertension, while the intermediate NFS group had a higher prevalence of diabetes mellitus (DM) (p < 0.001). Dyslipidemia, family history of coronary artery disease, chronic kidney disease, smoking, and exercise history were similar among the groups (p > 0.05). Patients in the low NFS group had lower use of statins and acetylsalicylic acid (Table I).
Table I
Baseline characteristics of patients by non-alcoholic fatty liver fibrosis score
The study found that patients with higher NFS had significantly higher Agatston score values (30 ±71.6 in the low NFS group, 61.4 ±17.9 in the intermediate NFS group, 370.3 ±549.2 in the high NFS group, p < 0.001). Furthermore, in the high NFS group, there was a significantly higher degree of stenosis compared to the other two groups (p = 0.001). As NFS increased, so did the degree of stenosis. It was observed that no stenosis was present in 61.9% of patients in the low NFS group and 50.6% of patients in the intermediate NFS group. The percentage of patients with atherosclerotic plaque was 42.8% in the low NFS group, 54.9% in the moderate NFS group, and 75% in the high NFS group (p < 0.001). The primary purpose of CCTA was to rule out coronary artery disease, as shown in Table II, with 341 patients undergoing the procedure.
Table II
Coronary computed tomography angiography characteristics of patients according to non-alcoholic fatty liver fibrosis score
The primary endpoint of our study was defined as myocardial infarction (MI), coronary angiography after CCTA in the following year, and death. No significant differences were observed in the numbers of MI and death among the groups (p > 0.05). The statistical analysis revealed that a greater number of individuals in the high NFS group underwent coronary angiography as compared to the low NFS group. This difference was found to be statistically significant (p < 0.001). The patients with higher NFS showed a significantly higher prevalence of severe coronary artery disease as compared to those with lower NFS (p < 0.001) (Table III).
Table III
Primary endpoint and severe coronary artery disease frequency according to non-alcoholic fatty liver fibrosis score
A comprehensive analysis was conducted to determine the predictors for severe coronary artery disease in CCTA. The results of the multivariate logistic regression analysis showed that the NFS (OR = 1.264, 95% CI [1.008–1.585], p = 0.043) and Agatston score (OR = 1.002, 95% CI [1.001–1.003], p = 0.004) were independent predictors for severe coronary artery disease. These findings are presented in detail in Table IV.
Table IV
Logistic regression analysis for severe coronary artery disease detected in coronary computed coronary angiography
| Parameter | Univariate | Multivariate | ||||
|---|---|---|---|---|---|---|
| OR | 95% CI | P-value | OR | 95% CI | P-value | |
| Age | 1.079 | 1.052–1.107 | < 0.001* | 1.025 | 0.991–1.060 | 0.153 |
| Body mass index | 1.029 | 0.979–1.082 | 0.263 | |||
| Male | 1.455 | 0.870–2.431 | 0.153 | |||
| Non-alcoholic fatty liver disease fibrosis score | 1.704 | 1.435–2.024 | < 0.001* | 1.264 | 1.008–1.585 | 0.043 |
| Agatston score | 1.003 | 1.002–1.004 | < 0.001* | 1.002 | 1.001–1.003 | 0.004 |
| Diabetes | 2.090 | 1.259–3.47 | 0.004* | 1.281 | 0.631–2.598 | 0.493 |
| Hypertension | 2.357 | 1.393–3.987 | 0.001* | 1.355 | 0.689–2.667 | 0.379 |
| Dyslipidemia | 1.631 | 0.957–2.779 | 0.072 | |||
| Family history | 1.455 | 0.876–2.417 | 0.147 | |||
| Smoking history | 0.982 | 0.591–1.629 | 0.943 | |||
| Exercise | 1.083 | 0.649–1.810 | 0.759 | |||
| Low-density lipoprotein | 0.966 | 0.989–1.003 | 0.264 | |||
| Admission glucose | 1.005 | 1.000–1.010 | 0.042* | 0.999 | 0.992–1.007 | 0.841 |
| Creatinine | 1.976 | 1.038–3.764 | 0.038* | 1.520 | 0.948–2.438 | 0.082 |
Cox regression analysis was conducted to evaluate the parameters affecting the primary endpoints. The NFS (HR =1.239, 95% CI [1.044–1.470]; p = 0.014) and Agatston score (HR = 1.001, 95% CI [1.000–1.001]; p = 0.015) were independent predictors of the primary endpoint (Table V).
Table V
Cox regression analysis of primary endpoint (death, coronary angiography, myocardial infarction)
| Parameter | Univariate | Multivariate | ||||
|---|---|---|---|---|---|---|
| HR | 95% CI | P-value | HR | 95% CI | P-value | |
| Age | 1.019 | 0.996–1.044 | 0.111 | |||
| Body mass index | 1.009 | 0.970–1.050 | 0.652 | |||
| Male | 1.055 | 0.687–1.622 | 0.806 | |||
| Non-alcoholic fatty liver fibrosis score | 1.259 | 1.088–1.456 | 0.002* | 1.239 | 1.044–1.470 | 0.014 |
| Agatston score | 1.000 | 1.000–1.001 | 0.054* | 1.001 | 1.000–1.001 | 0.015 |
| Diabetes | 1.294 | 0.852–1.966 | 0.227 | |||
| Hypertension | 1.231 | 0.793–1.911 | 0.355 | |||
| Dyslipidemia | 1.328 | 0.875–2.016 | 0.182 | |||
| Family history | 0.930 | 0.608–1.421 | 0.736 | |||
| Smoking | 0.937 | 0.612–1.434 | 0.764 | |||
| Exercise | 0.933 | 0.614–1.417 | 0.933 | |||
| Low-density lipoprotein | 1.002 | 0.997–1.006 | 0.498 | |||
| Admission glucose | 1.004 | 1.000–1.008 | 0.053* | 1.003 | 0.999–1.007 | 0.155 |
| Creatinine | 1.200 | 1.922–1.562 | 0.176 | |||
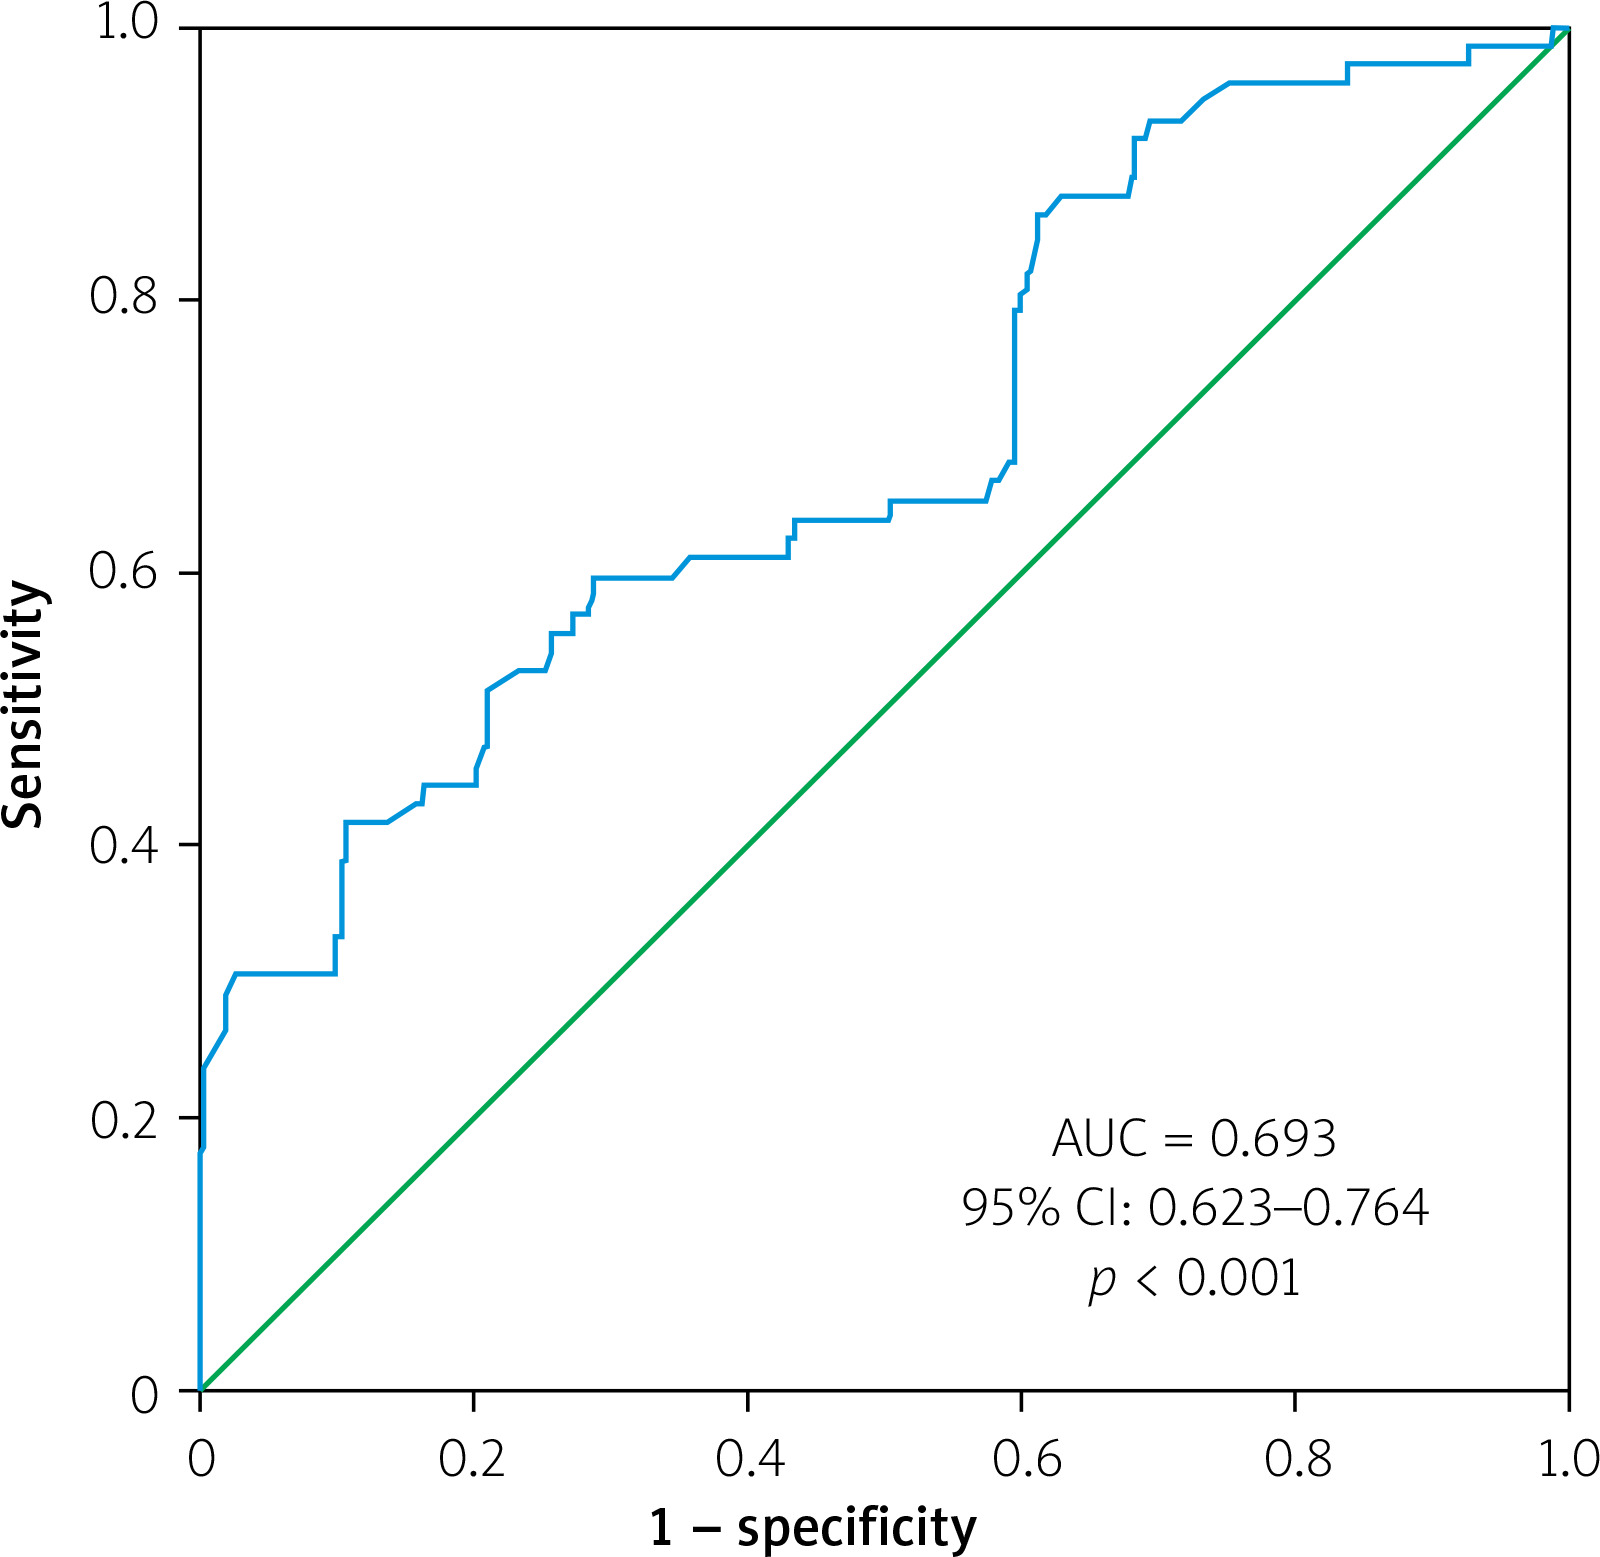
The results from the ROC curve analysis showed that the area under the curve (AUC) for the primary endpoint was 0.657 (95% CI: 0.592–0.723, p < 0.001). An NFS value above –0.92 was found to be predictive of the primary endpoint with a sensitivity of 61% and specificity of 63%, as shown in Figure 1. For severe coronary artery disease, the AUC was 0.693 (95% CI: 0.623–0.764, p < 0.001), and an NFS value above –0.88 could predict severe coronary artery disease with a sensitivity of 62% and specificity of 65% (Figure 2).
Figure 1
Receiver operating characteristic (ROC) curves of non-alcoholic fatty liver disease fibrosis score predicting primary endpoint (death, myocardial infarction, coronary angiography)
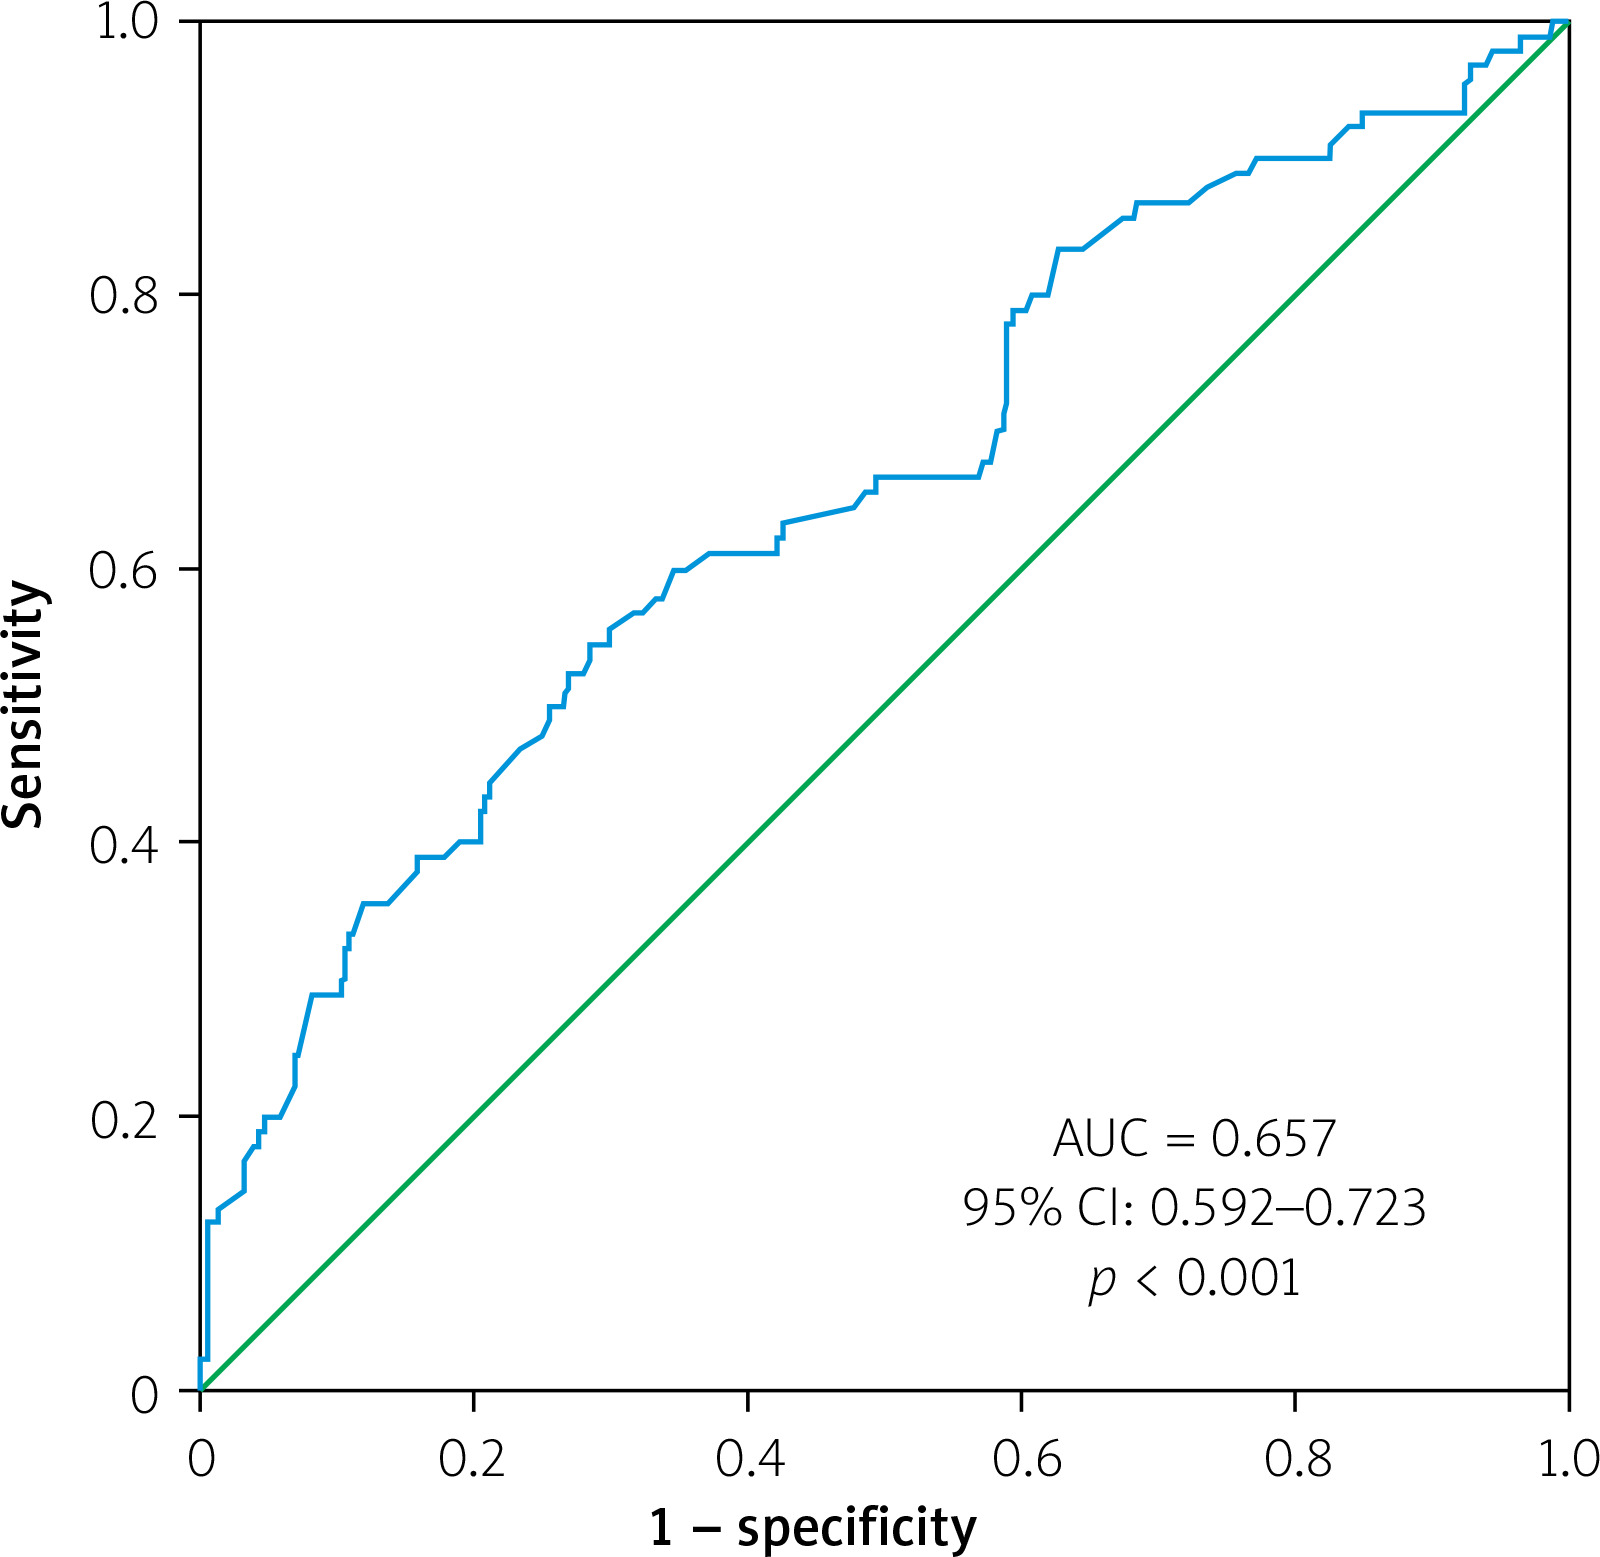
Figure 2
Receiver operating characteristic (ROC) curves of non-alcoholic fatty liver disease fibrosis score predicting severe coronary artery disease
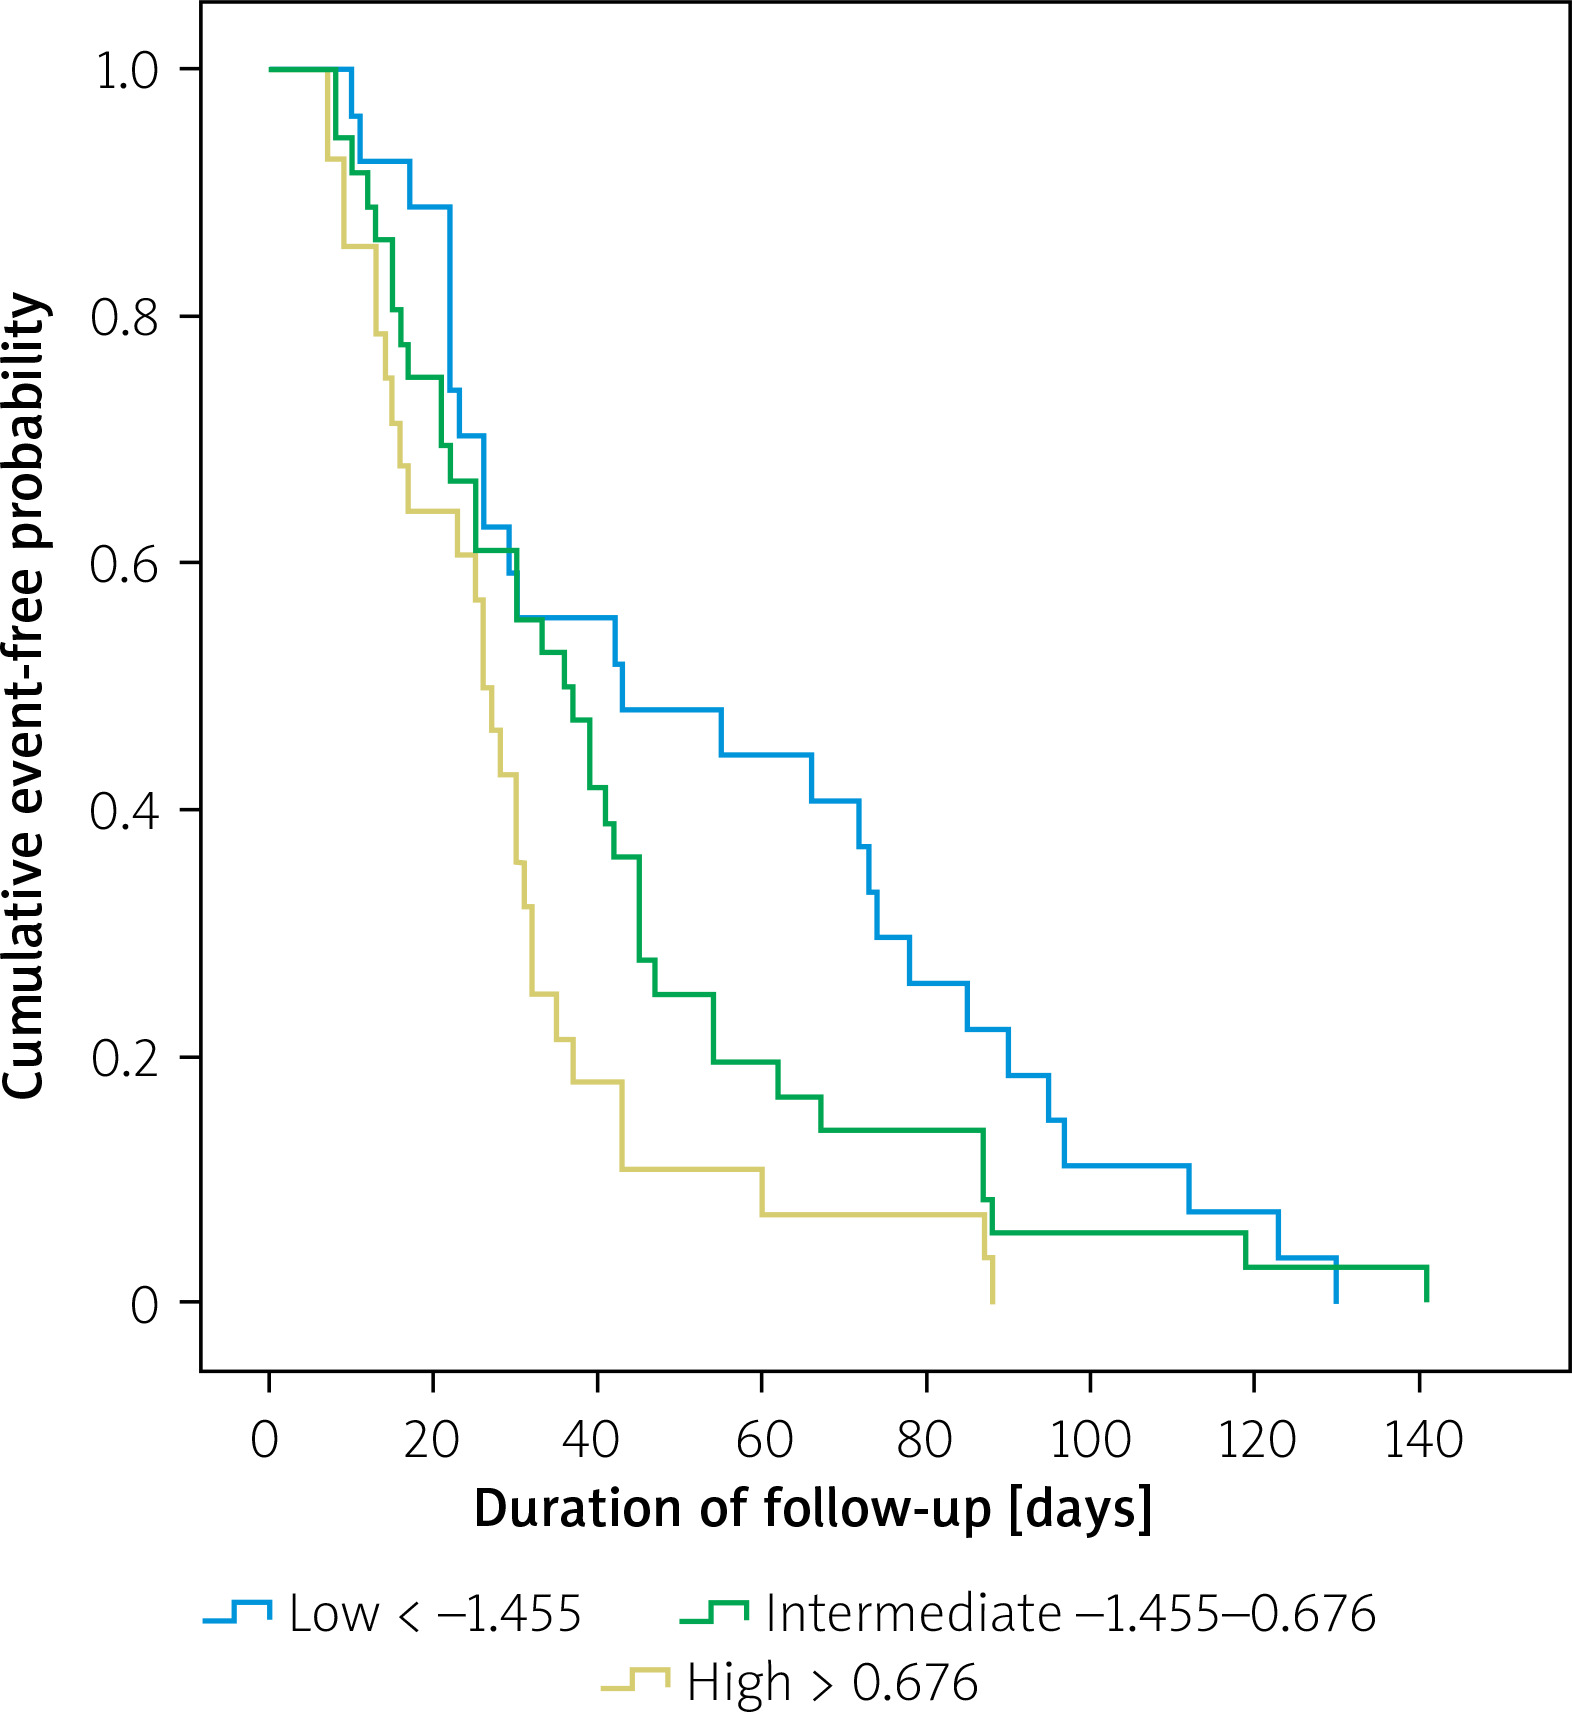
Survival analysis was conducted for the primary endpoints using the Kaplan-Meier method and the log-rank test was used to compare NFS groups. The results showed that patients with higher NFS experienced primary outcomes earlier during the follow-up period (p = 0.009), as shown in Figure 3.
Discussion
In this study, we examined the short-term predictive value of NFS in patients who underwent CCTA. Patients with higher NFS were found to have a greater incidence of myocardial infarction, death, and coronary angiography. Moreover, the NFS and Agatston scores were equally effective in predicting severe coronary artery disease and short-term primary outcomes (mainly driven by repeated coronary angiography). An NFS above –0.92 could predict the primary outcome (death, myocardial infarction (MI), and CA) with 61% sensitivity and 63% specificity, while an NFS above –0.88 could predict severe CAD with 62% sensitivity and 65% specificity.
NAFLD is the most common chronic liver disease in developed countries. It is mostly caused by obesity, type 2 diabetes, hyperlipidemia, and insulin resistance. This disease is believed to be the hepatic component of metabolic syndrome. The most important predictor of mortality in NAFLD is fibrosis. Although biopsy is the gold standard in evaluating fibrosis, various scoring systems have been developed due to its invasive nature and cost-effectiveness [13]. One scoring method used for this purpose is the NFS, which can indicate the presence or absence of advanced fibrosis and can be easily obtained from clinical and laboratory parameters [9]. Recent guidelines have recommended the use of the NFS to predict patients with NAFLD who are at a higher risk of developing fibrosis and cirrhosis [1, 14].
It is not yet clear how liver fibrosis and CAD are related, but some possibilities have been suggested. It is believed that chronic inflammation and oxidative stress can lead to endothelial dysfunction, which can cause both coronary atherosclerosis and liver fibrosis in patients with NAFLD [15]. In the case of atherosclerotic coronary artery disease, lipoproteins accumulate in the intima layer of coronary arteries. This leads to the deposition of leukocytes into the vessel after oxidative stress and cytokine release. As a result, smooth muscle cells begin to proliferate. In advanced stages, fibrosis and calcification contribute to the completion of atherosclerotic plaque formation. On the other hand, in NAFLD, the initial stage is the storage of fat in the liver and the development of insulin resistance. The second stage involves oxidative stress that occurs during the oxidation of fatty acids [9]. Recent studies have revealed a close correlation between NAFLD and coronary artery disease due to their similarities [16, 17].
CAD is a major cause of morbidity and mortality worldwide, and its diagnosis and management are of paramount importance in clinical practice. CCTA is a non-invasive imaging technique that provides valuable information for the diagnosis and management of CAD. Moreover, CCTA can be utilized to visualize different phases of atherosclerosis, including the development of plaque, its progression, and eventual rupture. Therefore, CCTA can contribute significantly to the understanding of the pathophysiology of CAD and the development of effective therapeutic strategies for its prevention and treatment [18]. A 64-slice contrast-enhanced CT scan study found a strong correlation between NAFLD and high-risk plaque, as well as progressive stenosis of the coronary arteries in individuals suspected of having coronary artery disease [19]. This study revealed a significant relationship between Agatston score, degree of stenosis, presence of plaque, and CCTA indication with NFS. These findings highlight the correlation between NAFLD and atherosclerosis. Our results suggest that invasive coronary artery angiography is more necessary for those with high NFSs due to the practical implications of the parallel relationship between CCTA and NAFLD. Moreover, patients with high NFSs are more likely to have severe coronary artery disease. Therefore, the NFS is an important consideration when deciding on invasive coronary angiography. CCTA is a valuable test with a short examination time and low radiation exposure, and can be used to predict and assess the prognosis of coronary artery disease. The CCTA used in our study had high slices and good resolution, providing low radiation exposure and shorter examination time with mostly prospective scans without controlling heart rate in most patients.
The study found that NAFLD was linked to cardiovascular disorders and cardiac mortality was increased in patients with NAFLD who had higher NFS [20]. Liu et al. reported that patients with CAD had a higher risk of recurrent cardiovascular events with increasing liver fibrosis scores [7]. According to a recent study, liver fibrosis was associated with an increased risk of all-cause and cardiovascular mortality. The evaluation of this risk was carried out through the use of various fibrosis scores [21]. The myocardial infarction and death rates were similar between the groups. The low number of patients and relatively short follow-up might have affected the statistical significance. The patients with higher NFS were older, more hypertensive, and had diabetes. Recent evidence showed an association between hypertension and NAFLD [22].
Limitations
The most important limitation of our study was the retrospective inclusion of patients and the short follow-up period. The exclusion of patients who were not reached and patients whose NFS could not be calculated may also have affected the statistical results.
Conclusions
The NFS was found to be an effective parameter in predicting cardiovascular outcomes such as death, coronary angiography, and myocardial infarction. This easily accessible, cost-effective, and reliable parameter could be considered in predicting severe coronary artery disease and plaque formation.


