
Introduction
Among the key genes involved in the development of chronic diffuse liver disease, including non-alcoholic fatty liver disease (NAFLD), are genes encoding synthesis and activity of the glutathione S-transferase (GST) enzyme family. GSTs, enzymes of the second phase detoxification system, possess protective activity against endogenous oxidative stress, as well as exogenous toxins, catalyzing conjugation of sulfhydryl groups of reduced glutathione and neutralizing lipid and DNA oxidation products [1-3].
Nowadays, eight classes of soluble cytoplasmic isoforms of GST enzymes are known: α-, ζ-, θ-, κ-, μ-, π-, σ-, and ω- [4]. In turn, there are three GST genes responsible for the synthesis of one or another enzyme isoform. The GSTM1 gene is responsible for the synthesis of the µ class of the enzyme, localized on chromosome 1p13.3. The GSTT1 gene encodes the θ class of GST enzymes, and it is expressed on chromosome 22q11.23 [5].
Deletion genotype of GSTM1 and GSTT1 genes is the most common. It is associated with absence of corresponding GST isoenzyme synthesis and increased vulnerability to cytogenetic damage. Double null genotype of GSTT1 and GSTM1 genes results in inadequate activity of detoxification systems (low activity of conjugation of sulfhydryl groups) [6]. It is a risk factor for the development of various forms of liver diseases. It increases the likelihood of liver drug damage [7], alcoholic liver disease [8], non-alcoholic liver steatosis [9], causes dysfunction of the intracellular antioxidant system in viral hepatitis B patients with acute and chronic hepatic insufficiency [10], etc.
Certain studies have determined that the double zero genotype GSTT1 and GSTM1 is a risk factor for iatrogenic drug-induced liver damage, regardless of which medication causes such damage [11]. Brind et al. found a greater prevalence of zero genotype GSTT1 in alcoholic liver disease patients [8]. Savolainen et al. observed that homozygous deletion in the GSTM1 gene was associated with irreversible liver damage in response to toxic effects of ethanol [12]. Expression of GST genes plays a certain role in the pathogenesis of viral liver disease. The study by Qi et al. evidenced that GSTM3 and GSTP1 gene promoters’ methylation causes dysfunction of the intracellular antioxidant defense system, and is more commonly present in patients with acute and chronic hepatic insufficiency due to viral hepatitis B than in patients with compensated viral hepatitis B. The authors suggest determining the presence of methylation in the promoter site of GSTM3 and GSTP1 genes in order to predict acute or chronic liver failure [10].
The GST enzyme is also involved in the pathogenesis of NAFLD. Its activity in these patients is almost 20% higher as compared to healthy people [13], which is indicative of a probable role of the relevant genes in the development and progression of NAFLD. Therefore, it determines the need for further study of the abovementioned relationships [14, 15].
The objective of the study was to investigate GSTT1 and GSTM1 null genotype distribution among NAFLD patients and their association with cytokine and adipokine profiles.
Material and methods
The study involved 104 patients with NAFLD (main group). The average age of patients was 55.2 ±13.0 years, body weight was 96.1 ±16.7 kg, body mass index (BMI) was 33.3 ±5.3, 50 patients of the main group were men and 54 were women. Taking into consideration waist circumference all enrolled patients were diagnosed with abdominal type of adipose tissue deposition according to the International Diabetes Federation consensus (2005) (waist circumference ≥ 94 cm in men and ≥ 80 cm in women). The control group consisted of 45 healthy individuals, whose age and gender distribution were not statistically different as compared to the main group. The study protocol was in accordance with the revised Helsinki Declaration (2013) and was approved by the local medical ethics committee. All the enrolled patients and healthy individuals signed written consent to participate in the study.
The criterion for inclusion of patients in the study was verified NAFLD diagnosis. Exclusion criteria were: decompensated cardiovascular pathology (natural history of myocardial infarction, atrial fibrillation, rheumatic or congenital heart defects, cardiovascular insufficiency); systemic diseases (rheumatoid arthritis, systemic lupus erythematosus, systemic scleroderma); concomitant diseases in the active phase or stage of decompensation; pregnancy and breastfeeding; patients who did not give informed consent to participate in the study and/or did not sign the patient’s informed consent card.
Non-alcoholic fatty liver disease was diagnosed in accordance with EASL-EASD-EASO Guidelines (2016). Ultrasound examination of abdominal organs was performed using a Sonix SP (Ultrasonix, Canada) and En Visor HD (Philips Ultrasound System, USA) according to standard ultrasound examination protocol in all patients and healthy individuals. To clarify the extent of liver fibrosis patients underwent acoustic radiation force impulse imaging (ARFI-VTQ) which was performed on an Acuson S2000 diagnostic system (Siemens Medical Solutions, USA). To confirm NAFLD diagnosis the hepatic steatosis index (HSI) and NAFLD liver fat score were calculated. The HOMA-IR index was defined to evaluate insulin resistance in NAFLD patients and healthy volunteers who took part in the investigation.
The examined patients were diagnosed with changes typical for NAFLD on the ultrasound investigation, in particular hepatomegaly, diffuse hyperechogenicity of the liver parenchyma and heterogeneity of its structure, indistinct vascular pattern and dorsal attenuation of the echo signal. According to the acoustic radiation force impulse investigation, NAFLD patients who were diagnosed with stage of liver fibrosis > F2 were not included in the study.
Hepatic steatosis index was calculated for NAFLD patients and healthy individuals. The mean value of this index was 42.4 ±0.71 in NAFLD patients. Meanwhile, HSI in healthy individuals was 7.6 ±0.52, which was significantly lower (p < 0.001) as compared to NAFLD patients. It is known that HSI higher than 36.0 allows NAFLD to be verified with specificity of 92.4%, and below 30.0 allows NAFLD to be excluded with sensitivity of 93.1% [17].
The NAFLD liver fat score was also determined. NAFLD is predicted with sensitivity of 84% and specificity of 69% when the score value is –0.640. When the NAFLD liver fat score is equal to –1.413, sensitivity of the test increases to 95%, and when its indices are 1.257 specificity reaches 94% [18]. The NAFLD liver fat score was 4.5 ±0.89 in enrolled NAFLD patients. The score value was –1.8 ±0.28 in healthy individuals, which was significantly lower (p < 0.001) as compared to NAFLD patients. The results of both HSI and NAFLD liver fat score did not have significant differences in relation to genetic variants of the GSTT1 and GSTM1 genes and confirmed the NAFLD diagnosis in all patients [17, 18].
NAFLD patients who were included in the study were tested to diagnose insulin resistance with the help of homeostatic model assessment insulin resistance (HOMA-IR) (Table 1). The HOMA-IR index in NAFLD patients was on average 9.5 ±1.42, which was significantly higher as compared to the corresponding parameter in healthy individuals (2.3 ±0.47) and indicated aggravated insulin resistance in enrolled patients. 19 (18%) patients among those investigated in addition to NAFLD were diagnosed with diabetes mellitus type 2, compensated with metformin intake. It should be noted that patients with a comorbid course of NAFLD and diabetes mellitus type 2 were distributed evenly among subgroups of NAFLD patients with different polymorphic variants of GSTM1 and GSTT1 genes.
Table 1
Homeostatic model assessment insulin resistance parameters in non-alcoholic fatty liver disease patients and healthy persons
The liver function was studied by bilirubin level, activity of liver enzymes, detoxification indices, hepatocytes protein-synthetic function, cytolysis and mesenchymal inflammatory signs, and cholestasis syndrome diagnostic features. The cytokines (tumor necrosis factor-α – TNF-α (Bender MedSystem GmbH, Austria); interleukin-10 – IL-10 (Bender MedSystem GmbH, Austria)) and adipokines (leptin (Diagnostics Biochem Canada Inc., Canada), adiponectin (Bio-Vendor – Laboratorni medicina, Czech Republic)) and insulin (Monobind Inc, USA) plasma levels were measured by the immunoenzyme method.
The study of GSTT1 and GSTM1 genes’ polymorphism was carried out at the Reference Center for Molecular Diagnostics, the Ministry of Health of Ukraine, Kyiv. The protocol with specific oligonucleotide primers (Metabion, Germany) was used to determine the deletion polymorphism of GSTT1 and GSTM1 genes (Table 2) by means of the allelic-specific polymerase chain reaction method [16].
Table 2
Oligonucleotide primers to detect deletion (null) polymorphism of GSTT1 and G STM1 genes
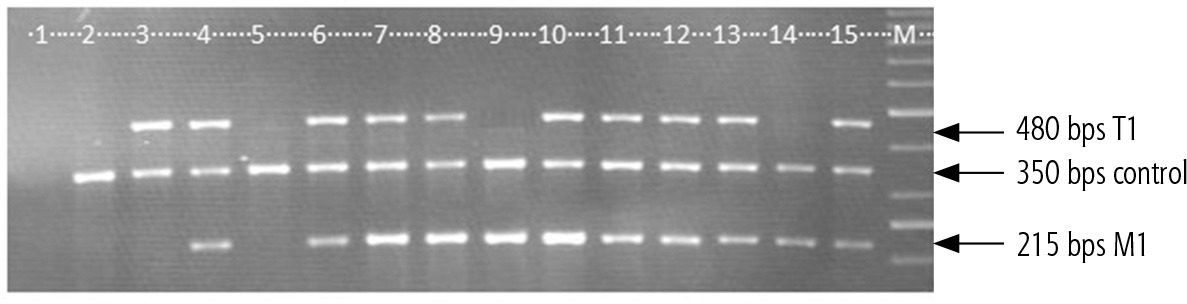
With the help of a molecular genetic method deletion or allelic polymorphism of GSTT1 and GSTM1 genes in the homozygous condition was analyzed, and the heterozygote condition was not discriminated (Fig. 1). In the case of presence of an amplified DNA fragment of 480 bps allelic polymorphism of the GSTT1 gene was detected, and in the case of presence of a fragment length of 215 bps allelic polymorphism of the GSTM1 gene was detected. In the case of absence of a fragment of 480 bps deletion polymorphism of the GSTT1 gene was investigated, and in the case of absence of a fragment of 250 bps deletion polymorphism of the GSTM1 gene was investigated. The quality of DNA isolation and conditions for multiplexed polymerase chain reaction setting were controlled by a fragment of albumin gene amplification with a molecular weight of 350 bps. In the case of fragment absence in the separate sample multiplexed polymerase chain reaction results for this sample were not considered.
Fig. 1
Electropherogram of the amplified GSTT1 and GSTM1 gene fragments’ distribution. Example 1 – negative control, examples 2, 5 – del GSTT1/del GSTM1 genotype; example 3 – allele GSTT1/del GSTM1 genotype; examples 4, 6-8, 10-13, 15 – allele GSTT1/allele GSTM1 genotype, M – molecular gene ruler
Statistical analysis
The types of data distribution were determined by the Shapiro-Wilk test. The Mann-Whitney non-parametric rank test was applied to calculate statistical differences between the groups. The Pearson χ2 test and exact Fisher test were used to compare the distribution of the deletion polymorphism of GSTT1 and GSTM1 genes in NAFLD patients and healthy individuals.
Results
The distribution of deletion vs. non-deletion genotypes of the GSTT1 gene in NAFLD patients and the control group were as follows (Table 3): in the study group 18 (17.3%) vs. 86 (82.7%) patients and in the control 6 (13.3%) vs. 39 (86.7%) cases, respectively. No significant differences between groups according to GSTT1 gene genotypes were found. The genotype distribution of the GSTM1 gene was as follows: 52 (50.0%) NAFLD patients had null genotype vs. 52 patients (50.0%) with non-deletion genotype; in the control group – 23 (51.1%) vs. 22 (48.9%) individuals, respectively.
Table 3
Distribution of the deletion polymorphism of GSTT1 and GSTM1 genes in non-alcoholic fatty liver disease patients and healthy persons
Results of liver function biomarkers depending on the analyzed genes’ genotypes are tabulated (Tables 4 and 5). The differences of investigated parameters in healthy carriers of the functional and non-functional alleles of GSTT1 and GSTM1 genes were not statistically significant. Therefore, as control (reference) indices average values of the studied parameters obtained in all healthy people were taken. No significant differences were found in the parameters that reflect the main functions of the liver and the markers of its damage in NAFLD patients, carriers of different variants of GSTT1 and GSTM1 genes’ deletion polymorphism. However, a significantly higher level of direct bilirubin by 18.5% (p = 0.049) in the blood was found in NAFLD patients with null genotype of the GSTT1 gene, as compared to patients with normal genotype of the indicated gene. But even in NAFLD patients with GSTT1 gene deletion plasma bilirubin level did not surpass its upper normal content.
Table 4
Biochemical parameters of blood depending on polymorphic variants of GSTT1 gene in non-alcoholic fatty liver disease patients
Table 5
Biochemical parameters of blood depending on polymorphic variants of GSTM1 gene in non-alcoholic fatty liver disease patients
The analysis of the probable association of pro- and anti-inflammatory cytokines’ plasma content with the deletion polymorphism of the GSTT1 gene in NAFLD patients demonstrated twice as high (p = 0.01) TNF-α level in the blood of patients with null genotype as compared to patients with normal genotype of the GSTT1 gene (Table 6). Differences in other cytokine and adipokine indicators between patients with different polymorphic variants of the GSTT1 gene were not statistically confirmed.
Table 6
Indicators of cytokine and adipokine profiles depending on polymorphic variants of GSTT1 gene in non-alcoholic fatty liver disease patients
NAFLD patients showed a similar tendency of pro- and anti-inflammatory cytokine variations depending on deletion polymorphism of the GSTM1 gene. In particular, a tendency for an increase of the level of TNF-α in blood was found in patients with deletion of the GSTM1 gene as compared to patients with a functional allele variant of the GSTM1 gene. However, unlike the statistically confirmed association in the case of the GSTT1 genotype, this relationship was not statistically significant (Table 7). Investigation of adipokine profile association with polymorphic variants of the GSTM1 gene revealed a higher leptin blood level by 37.1% (p = 0.04) in null-genotype patients than in those with the allele variant of this gene.
Table 7
Indicators of cytokine and adipokine profiles depending on polymorphic variants of GSTM1 gene in non-alcoholic fatty liver disease patients
Discussion
As a result of the study of deletion polymorphic variants of GSTT1 and GSTM1 genes’ prevalence among NAFLD patients, no confirmed difference in their distribution as compared to healthy individuals was found. These data are partially different from those suggested by Hori et al., who reported higher frequency of GSTM1 null genotype in NAFLD patients as compared to controls in the Japanese [19]. Hashemi et al. found that GSTM1 and GSTP1, but not GSTT1, genetic polymorphisms were associated with NAFLD in the Iranian population [20]. These findings are contrary to the data regarding GSTP1 A313G polymorphism with higher distribution of the G allele of this polymorphism in NAFLD patients [20, 21]. NAFLD patients participating in the study were characterized by increased alanine and aspartate aminotransferase, gamma-glutamyltransferase plasma activity and evaluated cholesterol and triglycerides levels, which are typical for NAFLD [22]. Due to the analysis of possible differences in the parameters of the synthetic, detoxification, excretory liver function and activity of cytolytic and cholestatic syndromes in NAFLD patients, we did not find any significant differences between patients with deletion of GSTT1 and GSTM1 genes and patients with normal genotype of these genes, which would have considerable value. We also did not determine any significant differences in cholesterol and triglyceride concentrations in the blood of NAFLD patients with deletion and normal genotype of GSTT1 and GSTM1. It agrees with Rafiee et al., who also did not define significant contrasts in cholesterol and triglyceride plasma levels in individuals with different polymorphic variants of the studied genes [23]. It is interesting to mention that in earlier studies performed by Maciel et al. the authors suggested that double deletion genotypes of GSTM1 and GSTT1 genes are associated with hypertriglyceridemia [24].
An elevated TNF-α level in the blood of NAFLD patients as compared to healthy individuals was found. These findings are similar to the data of Chakraborty et al., who reported elevated TNF-α levels in NAFLD patients [25]. Jamali et al. proposed an algorithm involving TNF-α for predicting NAFLD/non-alcoholic steatohepatitis [26]. In our study it was found that null-genotype carriers of the GSTT1 gene were characterized by higher TNF-α concentration as compared to normal genotype carriers, indicating activation of the proinflammatory segment of the cytokine profile and inflammatory processes. Of note, TNF-α is one of the key factors involved in insulin resistance, inflammation and apoptosis in the case of NAFLD [27], so its elevated level could be a predictor of aggravated liver injury in NAFLD patients with null genotype of the GSTT1 gene. Meanwhile IL-10 plasma content did not differ significantly between the patients and healthy individuals.
Our investigations indicate the formation of adipokine imbalance in NAFLD patients with an elevated leptin concentration and decreased adiponectin level, which is typical for NAFLD [28]. Leptin plasma level was significantly higher in patients with null genotype of the GSTM1 gene as compared to NAFLD patients with normal genotype. This increase in leptin content in null-genotype GSTM1 carriers was probably associated with a high TNF-α concentration stimulating leptin production [29].
This study has several limitations. One of them is the relatively small quantity of patients and healthy individuals enrolled in the study. Secondly, a wider spectrum of pro- and anti-inflammatory cytokines could be investigated to reveal more peculiarities of the cytokine profile among NAFLD patients with different polymorphic variants of GSTT1 and GSTM1 genes. Finally, this study describes the current state of cytokine and adipokine profiles for the time of investigation. Another prospective study addressing the dynamics of these alterations in short-term and long-term follow-up periods could provide more information regarding the association of the studied gene polymorphisms and discussed parameters.
Conclusions
Deletion polymorphism of GSTT1 gene and GSTM1 gene distribution among NAFLD patients was not different as compared to healthy individuals. Null-genotype GSTT1 gene carriers were characterized by higher TNF-α concentration and null-genotype GSTM1 gene carriers were characterized by elevated leptin level as compared to normal genotype carriers.


