
Introduction
Hepatitis C virus (HCV) infection affects about 3% of the world population. Egypt has a high prevalence of HCV, especially genotype 4a. HCV is a leading cause of hepatocellular carcinoma (HCC) and chronic liver disease [1]. The United States (US) Food and Drug Administration on April 2017 approved supplemental applications for Sovaldi (sofosbuvir) and Harvoni (ledipasvir and sofosbuvir) to treat HCV in children of ages 12 to 17 years or weighing at least 35 kilograms without cirrhosis or with mild cirrhosis. However, in children below 12 years, interferon α (IFN-α)-based therapies and ribavirin are still the standard of care therapy [2].
Different mechanisms including immunological liver damage, direct cytotoxicity mediated by different viral products and induction of oxidative stress (OS) have been suggested as playing a pathogenic role in this infection. It has been suggested that HCV may cause OS in infected cells [3].
Moreover, it has been shown that patients with chronic hepatitis C (CHC) exhibit increased production of tumor necrosis factor α (TNF-α), a cytokine that can produce OS by simulating the generation of reactive oxygen species (ROS) such as superoxide ion (O2) and hydrogen peroxide (H2O2). ROS can damage cells by causing lipid peroxidation, and oxidative damage of DNA and proteins, and by depleting ATP stores. In the presence of metals (such as Fe3+), O2 can react with H2O2 to generate a hydroxyl radical then become even more reactive and cytotoxic than O2 or H2O2 [4]. Lipid peroxidation is caused by free radicals leading to oxidative destruction of polyunsaturated fatty acids constitutive of cellular membranes and to the production of toxic and reactive aldehyde metabolites such as malondialdehyde (MDA), which is commonly used as an index of lipid peroxidation [5].
Although both HCV and hepatitis B virus (HBV) cause hepatitis, HCV appears to be particularly potent at inducing OS, suggesting there are OS-inducing mechanisms that are unique to this virus [6]. Lipid and protein oxidation occur in CHC, oxidative damage can be demonstrated by increased serum levels of MDA, and MDA correlates with disease activity [7].
We aimed to assess the oxidative stress factors glutathione peroxidase (GPX) and MDA in children with chronic hepatitis C before and after combined interferon and ribavirin therapy.
Material and methods
Study population
One hundred and twenty-five individuals were enrolled in this study, 100 patients with chronic HCV infection recruited from the outpatient clinic and the inpatient department of the pediatric hepatology department, National Liver Institute, Menoufia University. They were divided into the following groups – group I: 50 children with chronic HCV before treatment (naïve HCV), group II: 25 children responding to HCV treatment, group III: 25 children not responding to HCV treatment and group IV: 25 control subjects matched in age and sex.
Signed informed consent was obtained from the parents of all the patients and controls before enrollment in the study. The study was approved by the Research Ethics Committee of the National Liver Institute.
Treatment protocol
Treated children received subcutaneous injections of Peg-IFN-α-2b (60 µg/m2/week) combined with oral ribavirin (15 mg/kg/day). Real-time PCR for HCV-RNA was performed at the baseline (before treatment), 12th, 24th and 48th weeks during treatment, and 24 weeks post-treatment. Complete sustained virological response (SVR) was defined as normalization of serum alanine aminotransferase (ALT) and undetectable HCV-RNA during the course of treatment and persistence during the entire 6 months’ post-therapy follow-up period. Non-responders were defined as HCV-RNA remains detectable and/or ALT fails to normalize throughout the treatment phase.
Etiological diagnosis and group allocation
HCV infection was defined by positive anti-HCV, a positive PCR for HCV-RNA, negative hepatitis B viral markers and absence of any associated liver disease, supported by the histopathological features of HCV infection in liver biopsy. To eliminate the possibility of any renal complications, kidney functions and abdominal ultrasound screening for patients were included. Patients with decompensated liver disease, cirrhosis, and impaired renal functions were all excluded from the study.
Control group subjects were defined as apparently healthy individuals with no signs or symptoms of liver disease or any other diseases, and negative anti-HCV Ab.
Sample collection and laboratory investigations
Blood samples (about 10 ml) were collected under complete aseptic technique from patients. Blood was allowed to clot naturally in the test tube, serum was then separated by centrifugation, divided into small aliquots and stored immediately at –80°C until the time of use for liver function tests (LFTs), kidney function tests (urea and creatinine), viral markers, and HCV-RNA. A second sample was added to EDTA for complete blood count and tested immediately. A third sample was added to Na citrate for prothrombin time and concentration [8] and tested just before performing liver biopsy. A fourth sample was added to EDTA, and then separated by centrifugation; plasma was then separated by centrifugation and stored immediately at –80°C until the time of use for MDA. 100 µl of packed red cells plus 400 µl of distilled water was mixed and centrifuged. Supernatant was taken and stored immediately at –80°C until the time of use for GPX.
Abdominal ultrasonography
To assess the size and echo pattern of the liver, the size of the spleen, and the presence of ascites, abdominal ultrasonography was performed.
Liver biopsy and histopathological evaluation
Liver biopsy was done for patients whenever possible. Liver biopsies were performed using true cut needle. Biopsy specimens were fixed in formalin, embedded in paraffin, followed by a histopathological examination of the specimen using hematoxylin and eosin stains, orcein stain, Masson’s trichrome, reticulin and Perl’s stains and PAS (periodic acid Schiff) stain. Hepatic necroinflammatory activity and liver fibrosis were evaluated according to the Ishak staging and grading score [9]. Necroinflammatory activity was classified as mild (score 1-5), moderate (score 6-8) and severe (score 9-18). Fibrosis was classified as mild (stage 1), moderate (stages 2-3), and severe fibrosis or cirrhosis (stages 4-6) [10].
Determination of malondialdehyde measurement by enzyme-linked immunosorbent assay (ELISA)
The lipid peroxides products were estimated in plasma of chronic HCV-infected children and the control group by determination of the level of thiobarbituric acid reactive substances (TBARS) that were measured as MDA. The later is a decomposition product of the process of lipid peroxidation and is used as a measure of this process.
It depends on colorimetric determination of the pink color resulting from the reaction of TBARS with thiobarbituric acid in acidic medium, at high temperature (100°C). To increase the specificity and sensitivity of the assay, the resultant color product was extracted in n-butanol and measured at 535 nm to exclude interfering substances [11, 12].
Determination of glutathione peroxidase measurement by ELISA
The assay is an indirect measure of the activity of c-GPx. Oxidized glutathione (GSSG), produced upon reduction of an organic peroxide by c-GPx, is recycled to its reduced state by the enzyme glutathione reductase (GR):
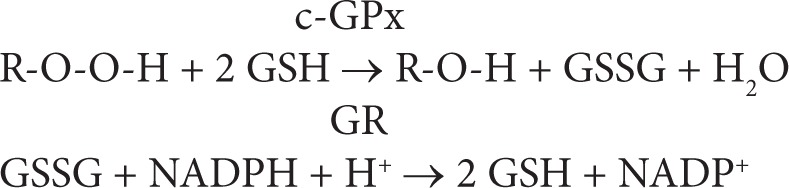
The oxidation of NADPH to NADP+ is accompanied by a decrease in absorbance at 340 nm (A340), providing a spectrophotometric means for monitoring GPx enzyme activity. The molar extinction coefficient for NADPH is 6220 M-1 cm-1 at 340 nm. To assay c-GPx, a cell or tissue homogenate is added to a solution containing glutathione, glutathione reductase, and NADPH. The enzyme reaction is initiated by adding the substrate, hydrogen peroxide and the A340 is recorded. The rate of decrease in the A340 is directly proportional to the GPx activity in the sample.
Statistical analysis
Data were analyzed using SPSS, version 18.0 (SPSS Inc., Chicago, Illinois, USA). Data were entered as numerical or categorical, as appropriate. Quantitative data were shown as median (minimum-maximum).
Qualitative data were expressed as frequency and percent at 95% confidence interval (95% CI). The chi-square (c2) test was used to measure associations between qualitative variables. The Mann-Whitney U test was performed to compare means and SD of 2 sets of quantitative data. The Kruskal-Wallis test was used to compare between the three groups regarding quantitative variables. The post-hoc test was used for multiple comparisons of MDA and GPX levels between multiple groups. Spearman’s correlation test was used for assessing the correlation between two continuous variables. P-value < 0.05 was considered statistically significant.
Results
Both naïve HCV patients and the healthy controls were age and sex matched (p > 0.05). 66% of the naïve HCV patients were male and 34% were female. Their median (minimum-maximum) age was 9 (4-12) years. The control group included 64% males and 36% females. Their median (minimum-maximum) age was 8.5 (5-12) years.
In the present study, we found that there was no statistically significant difference between HCV-treatment responders and non-responders regarding both the gender and the age of patients (Table 1).
Table 1
Clinical examination, laboratory parameters and histopathological finding in HCV group (n = 50)
On assessing the probable risk factors for acquisition of infection, we found that operations and tooth extraction were the most incriminated risk factors for acquisition of infection. On screening for the mode of presentation of HCV infection in our children, 92% children were incidentally discovered, while 8% of children had a history of jaundice.
By examination of the naïve HCV patients, jaundice was present in 8%, hepatomegaly in 14% and splenomegaly in 6% (Table 1). In addition, hepatomegaly was detected by abdominal ultrasonography in 12% of patients while splenomegaly was detected by abdominal ultrasonography in 10% of patients. On assessing the laboratory parameters of the studied group, we found that the mean values of liver function tests, renal function tests, red blood cell count (RBS), complete blood count (CBC) parameters and thyroid stimulating hormone (TSH) were nearly within normal ranges (Table 1).
On comparing the data of the treatment responders and non-responders, it was remarkable in our study that the level of ALT did not significantly affect HCV treatment response. In the current study, it was found that the level HCV viremia in HCV treatment non-responders was significantly higher than responders (p < 0.05) (Table 2). In this study, there was no statistically significant difference between histopathological activity and response to therapy (Table 3).
Table 2
Comparison between clinical, ultrasonographic and radiological findings of the responders and non-responders
| Factor | Responders (n = 25) | Non-responders (n = 25) | p-value |
|---|---|---|---|
| Male Female | 14 (56%) 11 (44%) | 19 (76%) 6 (24%) | 0.248 |
| Age (years) | 10 (4-12) | 8 (4-12) | 0.062 |
| Clinical data | |||
| Weight (kg) | 32 (15-64) | 26 (14-55) | 0.165 |
| Height (cm) | 133 (90-165) | 123 (93-158) | 0.404 |
| BMI | 19 (15.8-26.4) | 18 (14-24.4) | 0.158 |
| Jaundice | 1 (4.0%) | 6 (24.0%) | 0.042* |
| Hepatomegaly | 3 (12.0%) | 4 (16.0%) | 1 |
| Splenomegaly | 1 (4.0%) | 2 (8.0%) | 1 |
| Ultrasonography | |||
| Hepatomegaly | 6 (24%) | 9 (36%) | 0.355 |
| Liver span (cm) | 13 (10-16.2) | 12 (9.5-17) | 0.188 |
| Splenomegaly | 2 (8.0%) | 11 (44%) | 0.004* |
| Splenic length (cm) | 10 (7.5-13.4) | 9.6 (7-15) | 0.668 |
| Laboratory parameters | |||
| Total bilirubin (mg/dl) | 0.55 (0.1-1.9) | 0.8 (0.3-3.5) | 0.004* |
| Direct bilirubin (mg/dl) | 0.16 (0.05-0.65) | 0.2 (0.10-1.10) | 0.390 |
| Albumin (g/l) | 4.2 (3.20-5.20) | 4.1 (3.10-5.10) | 0.376 |
| ALT (IU/ml) | 43 (12-203) | 45 (24-416) | 0.151 |
| AST (IU/ml) | 33 (19-143) | 43 (25-632) | 0.013* |
| ALP (IU/ml) | 188 (71-354) | 171 (24.5-378) | 0.497 |
| GGT (IU/ml) | 25.5 (8-99) | 29 (9-320) | 0.524 |
| PT (s) | 12.9 (10.9-14.5) | 13 (12-15.7) | 0.170 |
| PC% | 93.3 (75-103) | 100 (62.3-100) | 0.864 |
| INR | 1.01 (0.93-1.23) | 1 (1-1.5) | 0.972 |
| Ferritin (ng/ml) | 67.7 (11.4-324.5) | 76.9 (5.98-559) | 0.672 |
| Urea (mg/dl) | 24 (18-34) | 25.5 (11-35) | 0.591 |
| Creatinine (mg/dl) | 0.51 (0.3-0.9) | 0.5 (0.3-0.9) | 0.953 |
| Hb (gm/dl) | 12.3 (9.8-14.7) | 11.9 (10-14.8) | 0.515 |
| WBCs × 103 | 6.6 (3.3-11.5) | 6.8 (4-12.5) | 0.509 |
| Platelets × 103 | 258 (123-472) | 265 (149-636) | 0.548 |
| HCV PCR (IU/ml) | 164000 (651-2980000) | 810000 (1448-21100000) | 0.033* |
Table 3
Comparison between histopathological findings of the responders and non-responders
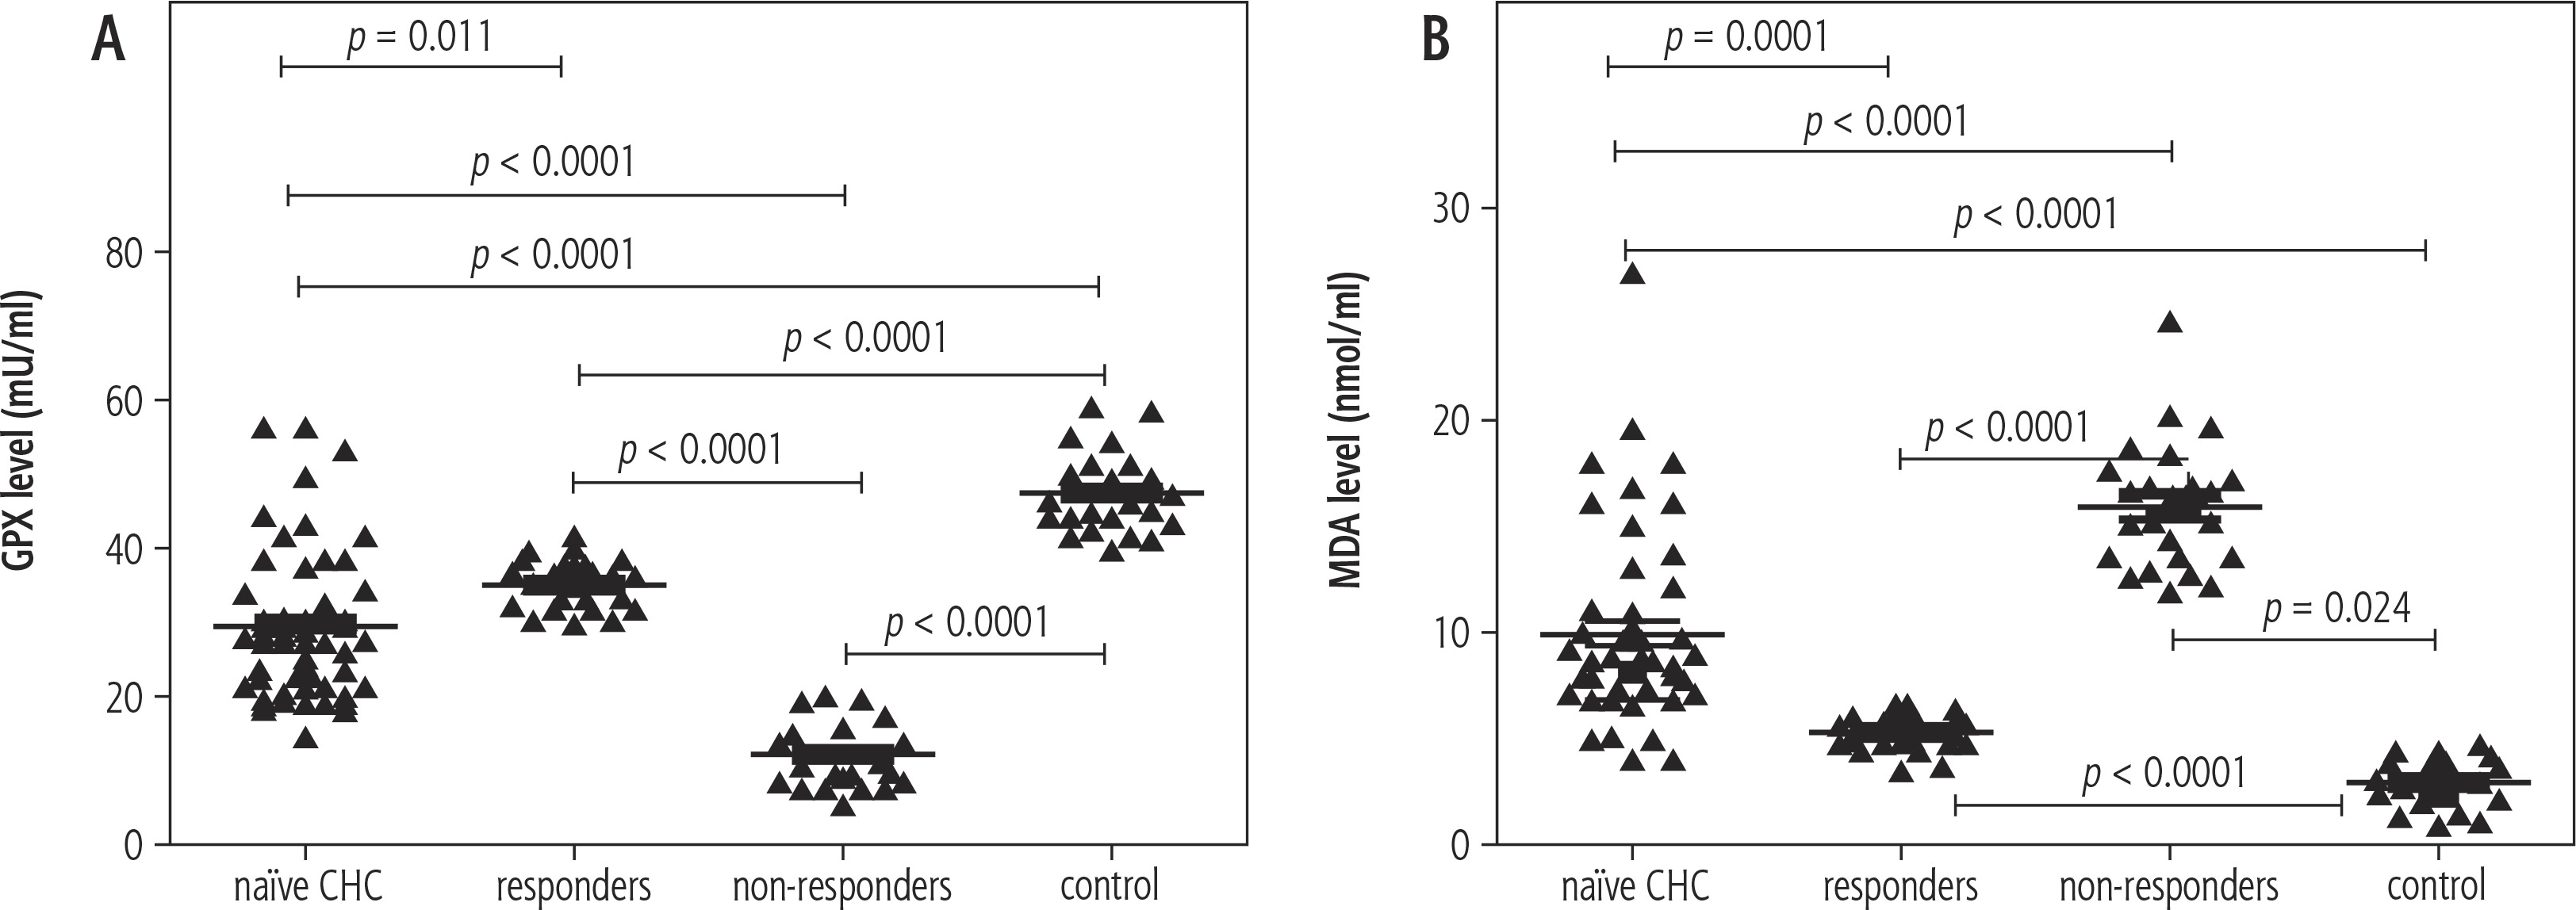
In the current study, the median (minimum-maximum) GPX activity in erythrocytes of naïve CHC patients was 27.1 (14.5-56.2) mU/ml. It was statistically significantly lower than the activity of GPX in erythrocytes of the healthy control group, 46.63 (39.45-58.63) mU/ml (p < 0.05). The GPX activity in erythrocytes of the responder group was 35.8 (29.9-41.3) mU/ml. It was statistically significantly higher than the average activity of GPX in erythrocytes of the non-responder group, 11 (5.4-20) mU/ml (p < 0.05) (Fig. 1).
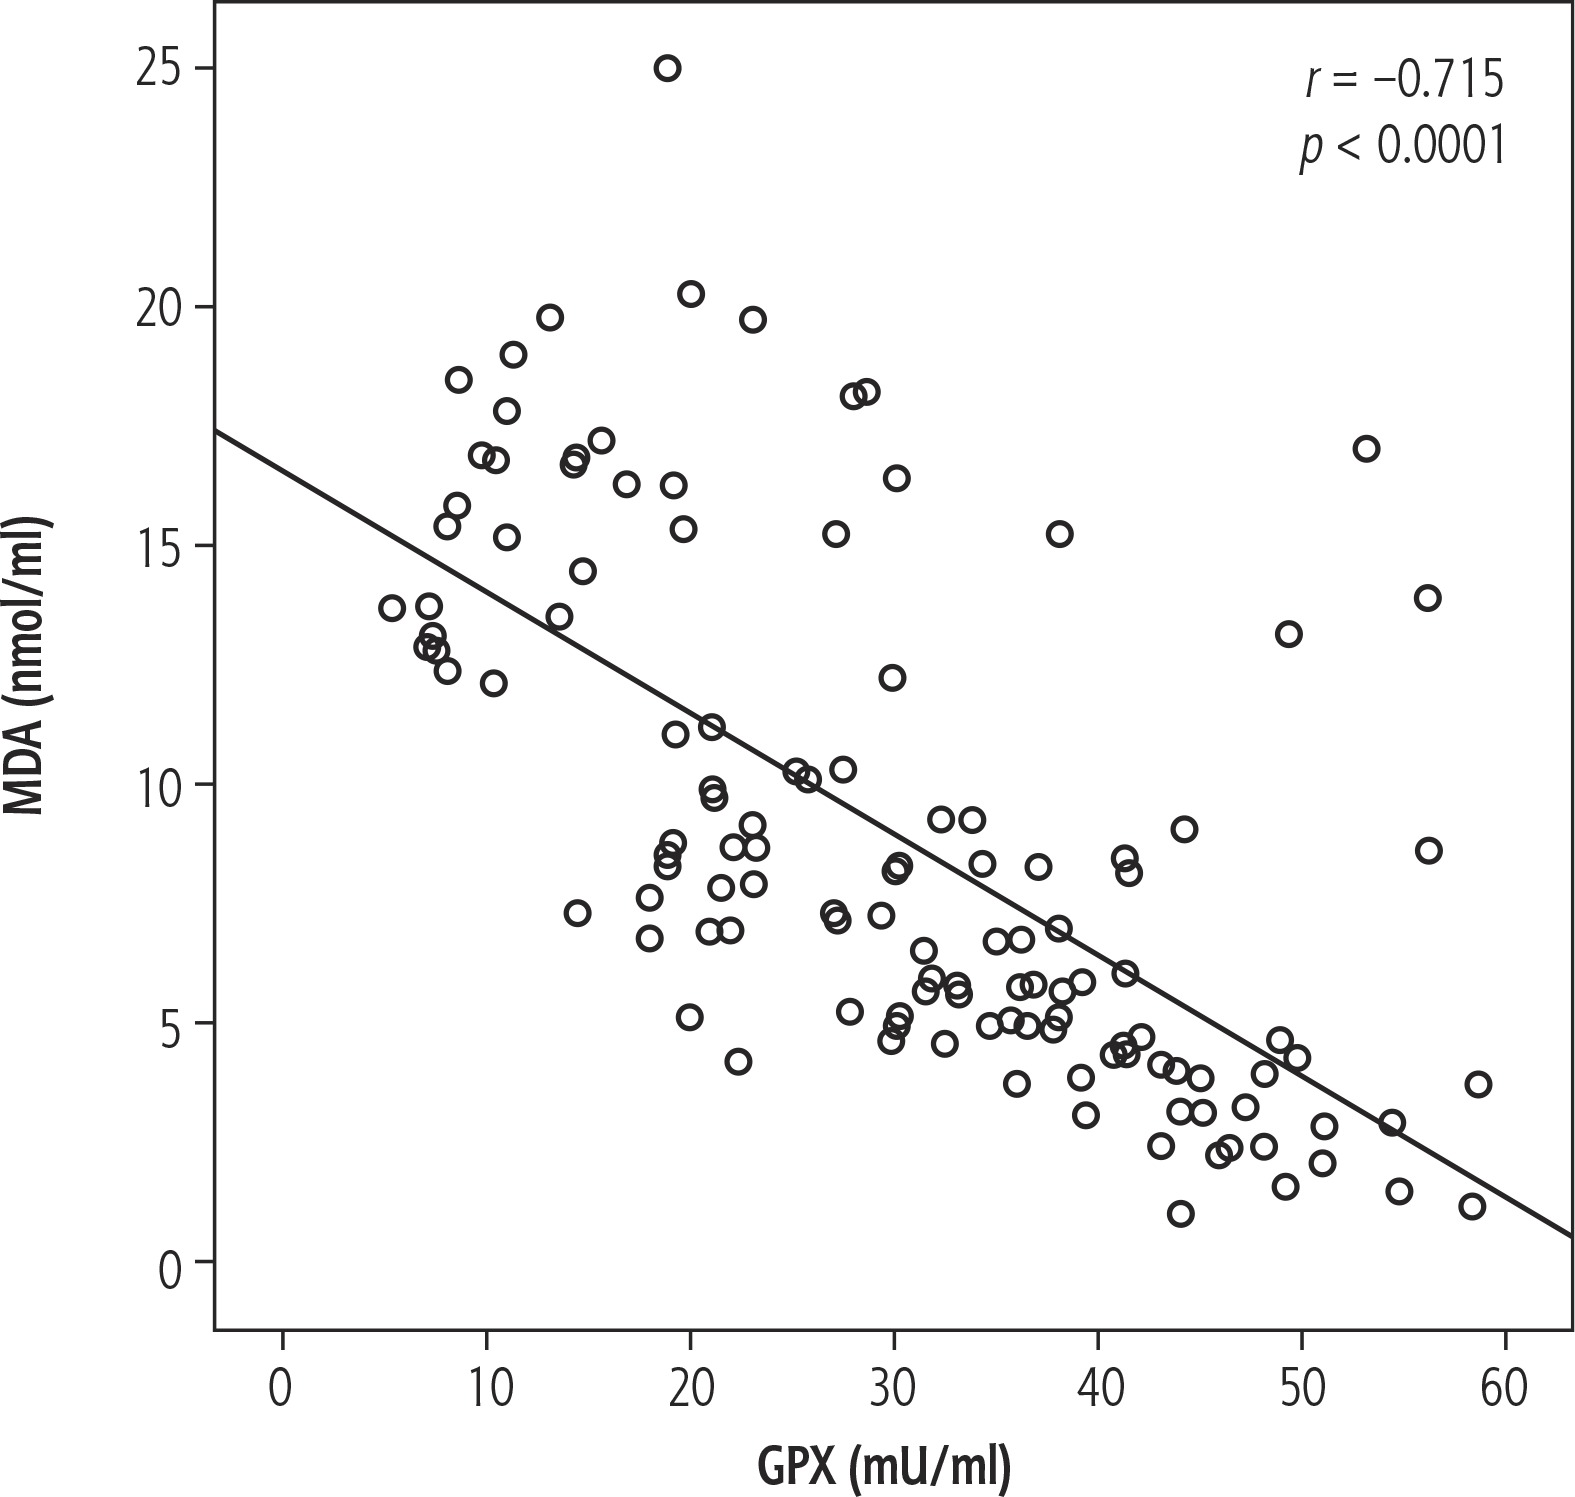
Fig. 1
Scatter plot showing the correlation between MDA and GPX, with the reference line implying a negative correlation
In this study, plasma MDA was significantly higher in naïve CHC patients than in healthy controls: 8.6 (4.1-19.7) nmol/ml vs. 3 (1-4.7) nmol/ml, p < 0.0001). Furthermore, plasma MDA concentration was significantly decreased in the responder group, 5.6 (3.7-6.7) nmol/ml, and elevated in the non-responder group, 15.8 (12.1-24.9) nmol/ml (Fig. 2).
In the current study, there was a negative correlation between levels of MDA and GPX in all studied groups (Fig. 1).
Lastly, there were no statistically significant correlations between MDA and GPX levels and other parameters: age, height, weight, body mass index, liver span, splenic length, LFTS, RFTS, TSH, ferritin, HCV-RNA PCR, CBC, degree of activity, or stage of fibrosis (p > 0.05).
Discussion
Hepatitis C virus is an important global health problem that causes acute and chronic hepatitis. The virus was discovered in the USA in 1989 and about three to four million people are infected every year worldwide. Humans are the natural hosts of HCV and the virus can eventually lead to permanent liver damage and HCC [13].
Hepatitis C virus infection in children is different from that in adults in many aspects, such as natural course of the disease, duration of infection, therapeutic response, side effects of drug therapy and prognosis [14].
Our study showed predominance of males over females with CHC. Most of the patients with HCV infection were incidentally discovered. The significant association between operations and tooth extraction alerts us to the importance of checking on surgical tools’ sterilization. In a study performed by Barakat and El-Bashir [15], they found that the most common potential risk factor for HCV infection in children was surgery (sutures, abscess draining, tonsillectomy and appendectomy), and the second highest risk factor was the use of IV catheters.
The HCV level of viremia in HCV treatment non-responders was significantly higher than responders. This finding agreed with El-Zayadi [16], who reported that the lower baseline HCV RNA level in adults is an important predictor of response to IFN-based therapy.
Patients with a high degree of fibrosis showed a poor end treatment response and SVR. On the other hand, histopathological activity was not a predictor for response to therapy. This was in accordance with Derbala et al. [17], who found no significant relation between histopathological activity and response.
Glutathione peroxidase catalyzes the reduction of hydroperoxides, including H2O2, by reduced GSH and functions to protect the cell from oxidative damage. The enzyme uses GSH as the ultimate electron donor to regenerate the reduced form of selenocysteine [18].
Malondialdehyde is the principal and most studied product of polyunsaturated fatty acid peroxidation. This aldehyde is a highly toxic molecule and should be considered as more than just a marker of lipid peroxidation. Its interaction with DNA and proteins has often been referred to as potentially mutagenic and atherogenic [19].
The average GPX activity in erythrocytes of naïve CHC patients was significantly lower than its activity in the healthy controls. In addition, it was significantly higher in the responder group than the non-responder group. These findings in naïve CHC patients and the non-responder group demonstrated that antioxidant status was compromised, with several important components of the antioxidant defense mechanism being significantly decreased.
These results agreed with Levent et al. [20], who reported that the average GPX activity in erythrocytes of patients with CHC before treatment was 6.52 ±1.86 U/ml. It was statistically significantly lower (p < 0.05) than the average activity of GPX in erythrocytes of the healthy control group (8.01 ±1.79 U/ml). Chrobot et al. [21], studied a group of 100 individuals with CHC. They demonstrated a GPX decrease in the blood serum of patients who were not treated with IFN. In contrast, GPX concentration was higher in the blood of patients responding to the treatment. This may be explained by the cytopathic effect of a virus causing GSH deficiency.
Contrary to GPX, plasma MDA was significantly higher in naïve CHC patients than in healthy controls. These results showed that the patients with CHC are under the influence of increased oxidative stress. Furthermore, plasma MDA concentration was significantly lower in the responder group than the non-responder group. Persistent HCV viremia may be responsible for the higher levels of MDA in the non-responder group. We suggest the routine use of MDA assay as an additional prognostic laboratory test for CHC patients.
These results agreed with Levent et al. [20], who reported that the serum MDA is significantly higher in CHC patients before treatment than in healthy subjects. Also MDA concentration decreased significantly (p < 0.001) after PEG-IFN-α-2b, and ribavirin treatment.
The negative correlation between levels of MDA and GPX in all studied groups may be explained by the fact that there is a balance between antioxidants (GPX) and oxidants (MDA) so when patients are under oxidative stress MDA increases and GPX decreases.
HCV causes severe antioxidant depletion and elevated levels of peroxidation products secondarily affect immune cells. The increased generation of reactive oxygen and nitrogen species, together with the decreased antioxidant defense, promotes the development and progression of hepatic and extrahepatic complications of HCV infection [6].
Conclusions
Lower pretreatment levels of GPX and a higher MDA level might be markers of oxidative stress occurring in HCV patients. Reversal of these levels with completion of the treatment may indicate a correlation between the oxidative stress and the viral pathogenesis. Hence antioxidant supplement can be added as a mandatory treatment in CHC patients to improve their response to antiviral treatment. However, further investigations to highlight this issue are recommended.


