
Introduction
Osteoporosis is a metabolic bone disease, characterized by a decrease in mineral bone density (BMD) with increased risk of low energy fractures [1]. High personal and social cost make postmenopausal osteoporosis (PMO) one of a major public health problem in the 21st century. Overall 22 million women (21% of aged 50-84 years) across the countries of European Union have PMO [2, 3]. Typical sites for osteoporotic fracture are distal forearm (Colles’ fracture), upper part of the femur and compression fractures of the spine [4]. Especially hip fractures (HF) are the cause of extended, often incomplete recovery, and 8% to 36% one-year mortality [5]. Approximately 20% patients require permanent nursing care or institutionalization [6]. WHO definition of osteoporosis is based on the T-score for bone mineral density (BMD) assessed by dual-energy X-ray absorptiometry (DXA) of the femoral neck or spine and is defined as a value for BMD –2.5 standard deviation (SD) or less [7]. However, 70% of fractures occur in person with lower BMD. National Bone Health Alliance (NBHA) extended the recognition criteria to: low energy HF without a decrease in BMD value; low-trauma major osteoporotic fracture (MOF) and osteopenia or osteoporosis at densitometry examination; fracture risk assessment tool (FRAX) with BMD (FRAX-BMD) > 10% (for Polish population) with or without low-energy fractures [8, 9]. FRAX was developed to assess 10-year probability of MOF and the 10-year risk of HF, based on clinical risk factors, exclusively (FRAX without BMD). The calculator was design as a simple tool to identify patients with risk of fractures, easily applicable by general practitioners [10].
Despite the efforts of popularization of FRAX without BMD, there is a large number of undiagnosed women without history of osteoporotic fractures, that could be eligible based on FRAX values or BMD assessment. A retrospective study performed in the USA among women that experienced HF, showed that only 13-15% of them were previously diagnosed with osteoporosis [11, 12]. Screening test performed in Switzerland among patients referred to the geriatric post-acute rehabilitation unit revealed that 71.5% of women had undiagnosed osteoporosis [13]. The problem of undiagnosed osteoporosis in Poland has not been studied, yet.
In addition to undiagnosed PMO, there is a great number of patients diagnosed with osteoporosis who have not received treatment, worldwide. American cohort study revealed that only 30.4% patients after low-energy fracture received anti-osteoporotic therapy [14]. In 2010 in Europe, only 43% of women with PMO were treated, with significant variation in the frequency between countries. As much as 75% of osteoporotic women were receiving appropriate therapy in Spain, while in Bulgaria about 95% patients remained untreated [15]. Treatment gap in Poland was estimated at 78% [16]. However, according to National Health Fund register, there are 2.25 million women with low-energy fracture, while only about 200 thousands people receive bisphosphonates (or denosumab)-based pharmacological treatment for osteoporosis (National Sales Data). That means that less than 10% have an adequate therapy. The reason of low adherence to the therapy could be explained by frequently asymptomatic course of PMO, delayed effects of the treatment, complicated schedule of oral bisphosphonate administration, and polypharmacy related to comorbidities in older women affected by the fractures [17].
The aim of this study was to assess scale of undiagnosed and untreated osteoporosis in the postmenopausal women in the Upper Silesia Region of Poland. Additionally, we compare estimation of the 10-year probability of MOF and HF based on FRAX with and without BMD.
Material and methods
Four-hundred-fifty postmenopausal women have been enrolled to the survey. It was carried out in primary health care centers (GP’s): NZOZ “Przychodnia” in Chorzów, NZOZ Euromed-M in Mysłowice, SPZOZ in Imielin, Department of Internal Medicine in Clinical Hospital No. 7 of the Silesian Medical University, SPZOZ Railway Hospital in Katowice, Municipal Hospitals Complex in Chorzow, SPZOZ Multispecialty Hospital in Jaworzno, SPZOZ Hospital No. 2 in Mysłowice, and densitometry centers localized in NZOZ ZBM “Zdrowie” in Bytom and Pro & Diagnostic in Sosnowiec, between January 2017 and March 2018. Physicians and medicine students (co-author of this paper) created for the purpose of this the study questionnaire, based on interview with the patient during a routine visit, after receiving a consent to participate in this survey. The study was performed anonymously, without collection patients’ personal data. Premenopausal women were excluded. The study was conducted as a survey that did not fulfill the medical experiment criteria therefore did not require Bioethical Committee approval.
Study questionnaire
The questionnaire was based on the risk factors included in the FRAX calculator and contained the following: demographic data (age, gender); anthropometric data (body mass, height); concomitant diseases: hyperthyroidism, hypothyroidism or premature menopause (< 45 years), type 1 or type 2 diabetes, bronchial asthma, rheumatic diseases, cancers, chronic colitis; family history (family HFs and/or other low-energy fractures); medicines taken (especially oral glucocorticoids – currently or previously for more than 3 months), history of fractures with their locations; alcohol consumption (3 or more units/day); smoking, as well as: occurrence of falls, dizziness, difficulty in moving, vision disorders, supplementation with vitamin D and calcium. The duration and composition of the current anti-osteoporosis therapy, and the utilization of specialist medical care in patients diagnosed with osteoporosis. Outpatients of the densitometry center, at the first visit had been carried out densitometry of the hip. The DXA examinations have been carried out using GE Lunar Prodigy Primo densitometers.
Ten years risk for osteoporotic fractures
The FRAX calculator has been used for estimation of the average 10 years risk for MOF. In addition, in those with measured BMD of the hip, a 10 years risk for HF including HF T-score was calculated. The analysis includes comparison of both FRAX scores values (FRAX-BMD and FRAX without BMD).
Data analysis
Study group was divided into subgroups depending on the previous diagnosis of osteoporosis and history of low energy fractures.
Statistical analysis
Statistical analysis was performed with Statistica 12.0 software (Cracow, Poland). The results were presented as: mean ±standard deviation or the percentages for the data in nominal and ordinal scale. Normality of data distribution was assessed with the Shapiro-Wilk test. Comparison of variables in nominal and ordinal scale was done with the χ2 test. In order to compare analyzed variables among groups the t-test for independent means or the U Mann-Whitney test (in the case of non-compliance with the condition of t-test) were used. In order to compare variables among groups with different T-score values, analysis of variances with the contrast analysis was performed. Homogeneity of variance was assessed with the Levene’s test. In the case of non-compliance with the condition of parametric ANOVA test, nonparametric equivalent – ANOVA Kruskal-Wallis test was used. The results were considered as statistically significant with a p-value of less than 0.05.
Results
Study group characteristics
The study group consisted of 450 postmenopausal women (mean age of 65 ±11 years), including 53 with a premature menopause (in age ≤ 45 years). There were 186 overweight (BMI 25-29.9) and 115 obese (BMI ≥ 30) women. Almost every fourth women (23%) reported that parents have been diagnosed with osteoporosis. The concomitant diseases included: hypertension (51.5%), type 1 or 2 diabetes (38.4%; HbA1c – 7.8 ±0.9%), thyroid diseases (10%), rheumatoid arthritis (RA) (8.4%) and chronic colitis (4%). Falls during a period of last year were reported by 41.7%. Fatigue was declared by 27.3% women. There were 34.9% alcohol consumers and 14.5% active smokers. In addition, 11.3% patients (n = 51) were currently treated with glucocorticoids.
Mean FRAX without BMD for MOF was 8.8 ±7.3% and FRAX without BMD for the HF was 3.4 ±4.9% (Table 1). One-hundred-thirteen of study subjects had a densitometry examination. In this subgroup calculated average 10-year risk for MOF was 14.0 ±9.6 for the FRAX-BMD and 11.1 ±8.8% for the FRAX without BMD. For HF it was 6.2 ±6.1% for FRAX-BMD and 4.6 ±5.8% for FRAX without BMD. Mean BMD T-score value was –2.48 ±0.75 (range: –3.95 to –0.44), and the mean BMI was 26.6 ±3.7. Every 10-year increase in age was increasing the risk of fracture by 3.2% for FRAX-BMD and 6.6% for FRAX without BMD.
Table 1
Study group characteristics (n = 450) and comparison between women diagnosed (n = 111) and undiagnosed with osteoporosis (n = 339)
Low energy fractures in the study group
There were 166 women with previous osteoporotic fractures and 284 women without fractures in the past. Only 70 women with previous fractures (42.2%) had been diagnosed with osteoporosis and 30 (42.8%) of them were treated. The subgroup of women with fractures was significantly older, had lower BMI, higher frequency of diabetes, dizziness and falls during the last year, were more often treated with glucocorticoids and vitamin D, as well as had family history of osteoporosis, than those without fractures.
There were no significant differences in terms of frequency of smoking, declared alcohol consumption, the occurrence of hypertension, RA, thyroid diseases, depression and the age of menopause between women with and without fractures (Table 2).
Table 2
Comparison of women with (n = 166) or without history of passed low-energy fractures (n = 284)
Patients with T-score < –2.5 with bone fractures had significantly higher (p < 0.001) FRAX-BMD MOF, FRAX-BMD HF, FRAX without BMD MOF and FRAX without BMD HF than people with T-score < –2.5 without bone fractures and women with T-score > –2.5 (Table 3).
Table 3
Comparison of BMD and FRAX value for women with T-score ≤ –2.5 (n = 61) and women with T-score > –2.5 (n = 52)
Patients with diagnosed osteoporosis
One-hundred-eleven women (23.7%) had been diagnosed with PMO (mean age 71.4 ±9.2 years). Of those 70 women (63%) had a history of low energy fractures (52% forearm, 28% proximal end of femur, 20% vertebral collapse), 63% over the period of last year experienced a fall, and 57% reported decrease in height by an average of 1.8 ±2.5 cm. Glucocorticoids were currently prescribed to 16.2%. Women diagnosed with osteoporosis were significantly older, more often reported dizziness, and had type 2 diabetes, had a history of osteoporotic fractures in the family as compared to women without osteoporosis (Table 1).
Vitamin D supplementation was declared by 70.2% of patients, but only in one-third, it was prescribed by a doctor. In addition, 27% of them has been taking calcium containing drugs and only 33% of them has been using bisphosphonates (most often alendronate – 51%, ibandronate – 25%, pamidronate – 16% and zoledronic acid – 8%). Patients were frequently managed by orthopedists (56%) and rheumatologists (48%).
Undiagnosed patients
Diagnostic criteria based on the T-Score BMD and interview data allowed the diagnosis of PMO in 103 women. However, only 41% (n = 42) of women declared previously diagnosed osteoporosis.
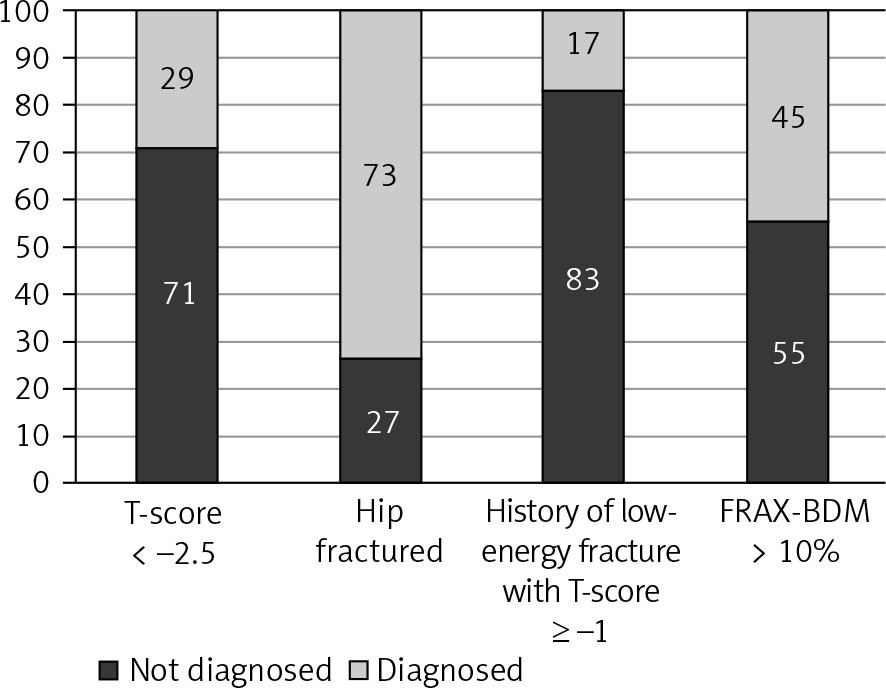
The lack of diagnosis of osteoporosis was declared by 44 out of 61 women with a BMD T-score ≤ –2.5; 7 out of 26 with HF; 5 out of 6 with a history of low-energy fracture with + T-score ≥ –1; and 5 women with FRAX-BMD ≥ 10% in the absence of fractures and BMD T-score > –2.5 (Fig. 1).
The study showed that 25 (24%) women were not diagnosed with osteoporosis despite being managed by orthopedists and 19 (18%) by rheumatologists.
Untreated patients
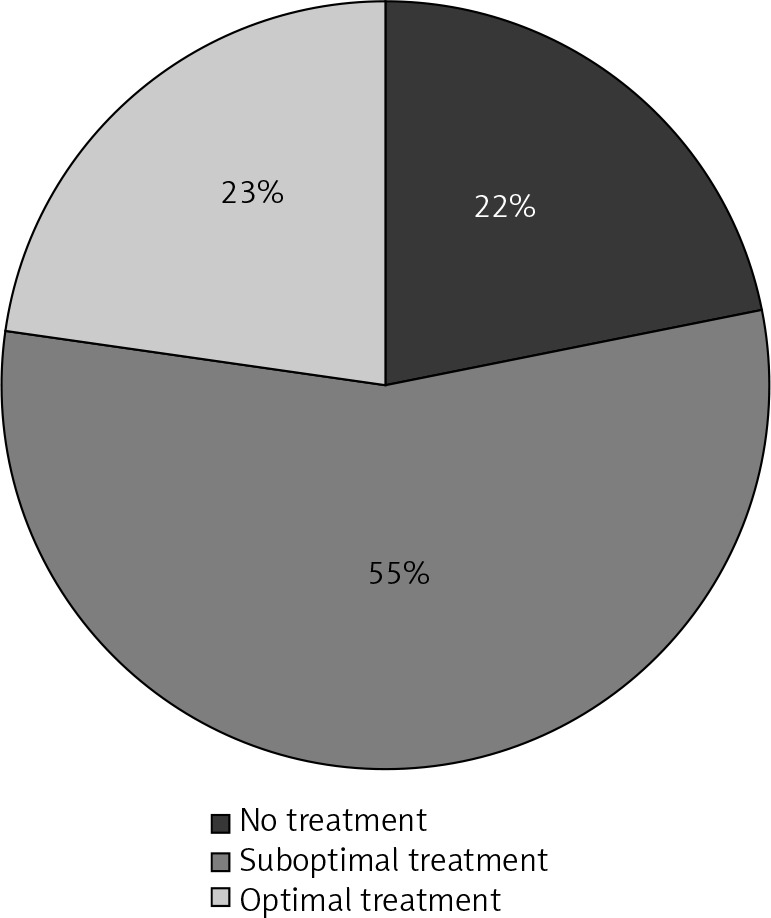
Only 23% of patients diagnosed with PMO received optimal treatment (Bisphosphonates + vitamin D + calcium supplementation). While include-women using vitamin D, the proportion of untreated patients with osteoporosis decreased to 22% (Fig. 2). Notably every fourth (27%) of women taking vitamin D though was not being treated for osteoporosis. In addition, 42% of the group of women without confirmed PMO was taking vitamin D supplementation.
Women with a history of bone fractures and diagnosed with PMO significantly more often had been taking bisphosphonates compared with those without fractures but diagnosed with osteoporosis.
Comparison of FRAX-BMD with FRAX without BMD values
In this study, we made the decision to start osteoporosis therapy and prevention of MOF taking into account FRAX with and without BMD. According to the guidelines therapies of osteoporosis should be introduced at the cut-off point of 10% FRAX-BMD.
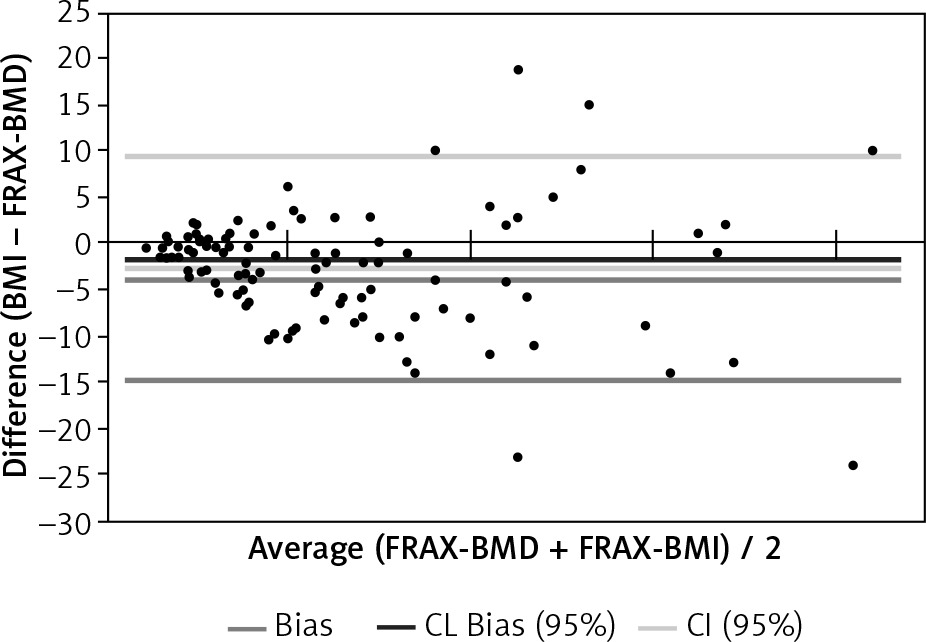
FRAX-BMD ≥ 10% was found in 64 women, in 46 of them, FRAX without BMD was equal to or greater than 10. Group of 18 women who were “missed” in FRAX without BMD were analyzed for the risk factors of osteoporotic fracture: FRAX risk factors were reported in 10 patients: 5 patients’ parents had osteoporosis, 3 had low-energy fractures in the past, 2 were diagnosed with RA. Eight women (12.5%) would not be considered for further diagnosis/prevention if the assessment was based only on the FRAX calculator without knowing the result of the densitometry (Fig. 3).
Discussion
Approximately 30% of all postmenopausal women in the United States [18], 21% in Europe [2], 20% in Poland [19] and 15.1% in Iran [20] suffer from osteoporosis. Similarly, results of our study show that 23.7% postmenopausal women visiting primary health care centers (GP’s), internal medicine wards and densitometry centers localized in the Upper Silesia region, suffers from osteoporosis, and meets the criteria of having already known risk factors of fractures such as older age, family history of osteoporosis, use of the glucocorticoids [3, 4, 15, 21] and chronic fatigue [22].
Of note 59% of the patients that fulfilled the clinical criteria of osteoporosis or in densitometry had not been previously diagnosed with osteoporosis. The number is lower than showed by Major et al. – 71.5% in female patients of the geriatric post-acute rehabilitation unit in Switzerland [13]. In contrary Gillespie and Morin showed much lower rate 15% of previously recognized osteoporosis in patients after first HF [12]. These discrepancies are too large to be explained by differences in the methods of patient recruitment, history of fractures and age. It should be emphasized that 24 and 18% undiagnosed patients were managed by orthopedist and rheumatologists. The highest percentage (83%) of undiagnosed patients were among those with prior low energy fractures and osteopenia in densitometry examination. It is a worldwide problem, GPs do not know about FRAX calculator or they declare that have no time to use it [23] .
Densitometry examination of femoral neck is a gold standard of the diagnosis of osteoporosis; however, it is impossible and not cost-effective to recommend it for all postmenopausal women. Therefore, various questionnaires including risk factors, have been developed to help physicians to identify patients with high risk of osteoporosis. There are numerous calculators around the world, e.g. Qfracture, Garvan Fracture Risk Calculator, Canadian Risk for Osteoporosis Calculator (CAROC), the Simple Calculated Osteoporosis Risk Index (SCORE), the Osteoporosis Risk Assessment Index (ORAI), the Osteoporotic Self-assessment Tool (OST), ABONE, but the most useful and the most extensive is the WHO FRAX [24]. FRAX is an algorithm that assess the 10-year probability of a MOF and the 10-year probability of HF. Fracture risk is calculated from anthropometric data and validated risk factors. Femoral neck BMD could be optionally used. Probability of osteoporosis fracture differs in various countries so that FRAX is calibrated for those countries where the epidemiology of fracture is known. For Polish population a special version of FRAX calculator was created [25, 26]. Our results of FRAX with and without BMD for MOF and HF were compared in two similar studies in Poland. One of them was conducted by Badurski et al. They examined group of 1608 women at the age of 40-89 [27]. The second one examined 1014 patients at the age of 50-89 and was performed by Strugała et al. [21] We showed the results for 10-year probability of MOF taking into account the value of BMD was 14%, the 10-year probability of HF was 6.2%. For FRAX without BMD it was: 11.1% and 4.6% respectively. Badurski et al. [27] and Strugała et al. [21] had similar results of risk for 10-years risk of MOF. However, they noticed lower risk of HF with known BMD value (3,1% and 3.2% vs. our 6.2%). Also Badurski et al. [27] observed lower value of FRAX without BMD for HF (2.8% vs. 4.6%). The differences between the results can be caused by the fact that Badurski et al. [27] used FRAX calculator for English population, and the examined group was younger, obviously exposed to lower risk [28]. In our real-life cohort, the risk of fracture grows by 3.2% for FRAX-BMD and up to 6.6% for FRAX without BMD. For Polish postmenopausal women population at Upper Silesia area, 5 years risk of fractures assessment calculator was developed, but the study to create useful 10 year risk estimation tool is still ongoing. The results that would be obtained in the future could be compared with the results of our study because both groups come from Upper Silesia and the groups are at similar age [29]. 10% FRAX-BMD is a cut-off point value from which the guidelines for Polish patients recommends the implementation the therapy for osteoporosis [26]. In our study we compared values of FRAX with and without BMD. FRAX-BMD ≥ 10% was found in 64 women, and in 72% the risk was similar using FRAX without BMD. Ten of 18 women who had been “missed” in FRAX without BMD had however risk factors of osteoporotic fractures. This suggest that patient with FRAX without BMD slightly below 10% may most benefit from referral to densitometry.
In should be pointed out that the diagnosis of PMO is not the only reason to start antiosteoporotic therapy. Even though the PMO diagnosis is established, a great percentage of patients not receiving treatment, especially an optimal one. 23% of patients in our survey were treated according to recommendations and next 55% received incomplete therapy, for example only with vitamin D supplements, advertised by Polish multimedia for last few years. As compared to USA 30.4% of patients received an optimal treatment [14]. According to the report prepared in the collaboration with International Osteoporosis Foundation (IOF) and the European Federation of Pharmaceutical Industry Associations (EFPIA) – 43% women in the EU and 27% in Poland, suffering from osteoporosis are receiving treatment [15]. As mentioned before it is caused by low adherence related to an asymptomatic course of osteoporosis, delayed effects of the treatment, complicated schedule of oral bisphosphonates administration, and polypharmacy related to comorbidities of older women experiencing low energetic fractures [17].
We would like to emphasize that the one of study limitations could be the recruitment method of patients, that might cause over-representation of patients with risk of fracture who receiving medical services more often. So, the recognition and implementation of treatment for osteoporosis could be better.
The results might vary from other regions of Poland due to differences in lifestyle, employment, diet, leisure time habits and environment of Upper Silesian Region.
Conclusions
In summary, osteoporosis often remains undiagnosed and untreated in the population of postmenopausal women. There is a great need to encourage physicians, especially GPs for using FRAX without BMD calculator, as reliable data source for the start of treatment. Women with burden of risk factors of fractures (i.e. familial osteoporosis, RA or glucocorticoid therapy) and borderline FRAX without BMD values, should be referred to a densitometry examination, as having greater risk of fracture than shown by FRAX without BMD.