
Introduction
The global public health challenge posed by hepatocellular carcinoma (HCC) persists. In particular, more than 700,000 cases of HCC are diagnosed each year [1]. Some risk factors that lead to HCC international burdens have been determined, such as chronic infection, alcoholic fatty liver disease, non-alcoholic steatohepatitis (NASH), diabetes mellitus (DM), hepatitis C virus (HCV), obesity, smoking, and genetic diseases, such as α1-antitrypsin deficiency [2].
Type 2 diabetes mellitus (T2DM) is a metabolic disorder characterized by hyperglycemia. Because insufficient endogenous insulin secretion is not sensitive to the receptor, high blood sugar may cause the liver to suffer from relative insulin resistance. In recent years, T2DM has been related to the increase in the risk of a variety of malignant tumors, including breast cancer, colon cancer, liver cancer and pancreatic cancer [3]. Some recent reports showed that no matter whether there is liver cirrhosis, the existence of T2DM will increase the development of HCC and lead to a poor prognosis for these patients [4, 5]. Since the liver plays a vital role in glucose metabolism, it is not surprising that T2DM is a complication of many chronic liver diseases, such as fatty liver disease, liver failure and cirrhosis [6]. The available evidence suggests that T2DM has become a distinct risk factor for the development of HCC.
The underlying mechanisms involved in T2DM and HCC are complicated, including hyperglycemia, insulin resistance, and inflammation [7]. Endogenous insulin acting on the liver activates a number of signaling pathways, and persistently high blood glucose and circulating insulin levels accelerate the secretion of inflammatory factors and the accumulation of metabolites such as free fatty acids (FFA) and advanced glycation end products (AGEs). Although the metabolic disorders of T2DM have been reported to play crucial roles in stimulating liver cancer growth, the specific pathological mechanisms and key genes of these processes remain vague.
The latest developments in sequencing technology and bioinformatics have enabled us to investigate the shared underlying mechanisms of various diseases at the genetic level [8]. Thus, to fully understand T2DM and HCC, we utilized this method to search for genes acting on metabolic disorders in T2DM and the development of HCC. Furthermore, we explored the functions, prognostic roles, and potential mechanisms of hub genes in HCC.
Material and methods
Data source
The gene expression datasets GSE15653 (9 samples with T2DM and 4 samples with non-T2DM), GSE64998 (7 samples with T2DM and 8 samples with non-T2DM), GSE84402 (14 paired samples with HCC and adjacent non-tumor), and GSE65372 (18 paired samples with HCC and adjacent non-tumor) were obtained from the Gene Expression Omnibus (GEO) database (http://www.ncbi.nlm.nih.gov/gds/).
Identification of differentially expressed genes (DEGs)
We downloaded the series matrix files of datasets from GEO. For GSE15653, GSE64998, GSE84402 and GSE101685, all data in different samples were normalized by quantity prior to performing gene differential analysis using the limma R package [9]. DEGs with Benjamini-Hochberg adjusted p-value < 0.05 were screened. Genes identified as significantly differentially expressed had an absolute log2fold change (FC) value > 1.0 in HCC and log2FC value > 0.2 in T2DM datasets. The online Venn diagram tool was used to obtain their common DEGs (http://www.bioinformatics.psb.ugent.be/webtools/Venn/).
Functional and pathway analysis of DEGs
To further reveal the functions of common DEGs, the Gene Oncology (GO) database (http://www.geneontology.org/) and Kyoto Encyclopedia of Genes and Genomes (KEGG) database (https://www.genome.jp/kegg/) were used to gain detailed information on biological processes and signaling pathways. P-values < 0.05 were used as standardized metrics to quantify the top functional items and pathways. GO is a database established by the Gene Ontology Federation, which provides simple annotations of gene products from functions, biological pathways involved, and location in cells [10]. KEGG is a database dedicated to storing information on gene pathways in different species [10].
Protein–protein interaction (PPI) network construction and hub gene identification
The Search Tool for the Retrieval Interacting Genes (STRING) (https://www.string-db.org/) [11] is a public online database that can be used to search for known proteins and predict the PPI network, including direct physical interactions between proteins and indirect functional interactions detected through correlation analyses. After common DEGs among different comparison groups were uploaded to STRING’s official website, interrelationships between DEGs and STRING database proteins were determined based on a minimum required interaction score set to 0.4. Resulting PPI interaction networks were visualized using Cytoscape (version 3.6.1) [12]. CytoHubba (version 0.1), a plugin for Cytoscape, was used to identify hub genes based on the Degree algorithm. In addition, the molecular complex detection (MCODE, version 2.0.0) plugin for Cytoscape software was used for the identification of important molecules in PPI networks to screen the modules of hub genes [13].
Transcription level of the hub genes in LIHC
The transcription levels of hub gene expression in liver hepatocellular carcinoma (LIHC) tissues and normal liver tissues were analyzed by the online software UALCAN based on the TCGA database (http://ualcan.path.uab.edu/analysis.html). In this study, we analyzed the differences in hub gene expression levels according to tumor grade.
RNA extraction and qRT-PCR of the hub genes
Quantitative real time-polymerase chain reaction (qRT-PCR) assays were performed on the normal liver cell (LO2) and liver cancer cells (HepG2 and SNU-449) to verify the reliability of bioinformatics-based prediction results. Trizol reagent (Invitrogen, Carlsbad, CA, USA) was used to extract total RNA from the LO2 cells, HepG2 cells and SNU-449 cells according to the manufacturer’s protocol. Superscript II reverse transcriptase and random primers were used to synthesize cDNA. qRT-PCR was conducted on the Light-Cycler 480 Sequence Detection System with SYBR-Green dye (Applied Biosystems, Foster City, CA, USA). All primers are shown in Table 1. The reaction parameters included a denaturation program (10 min at 95°C), followed by an amplification and quantification program over 45 cycles (15 s at 95°C and 34 s at 60°C). Each sample was tested in triplicate, and each sample underwent a melting curve analysis to check for the specificity of amplification. The expression level was determined as the ratio between the hub genes and the internal control β-actin in the same mRNA sample, and calculated by the comparative CT method. Expression levels of hub genes were calculated by the 2−δδCt method.
Table 1
Primer sequences of qRT-PCR
Construction of the TFmiRNAtarget gene regulatory network (GRN)
The findings of DEG-miRNA, TF-DEG, and TF-miRNA interaction networks are part of the GRN analysis. Hub genes were selected and analyzed using the miRWalk database (http://mirwalk.umm.uni-heidelberg.de/) to predict TFs and targeted miRNAs. All networks were built and visualized using Cytoscape software 3.6.1. The networks were filtered with a betweenness value of 100 and degree centrality of 0 to 10 to remove unnecessary information.
Results
Identification of DEGs between T2DM and HCC
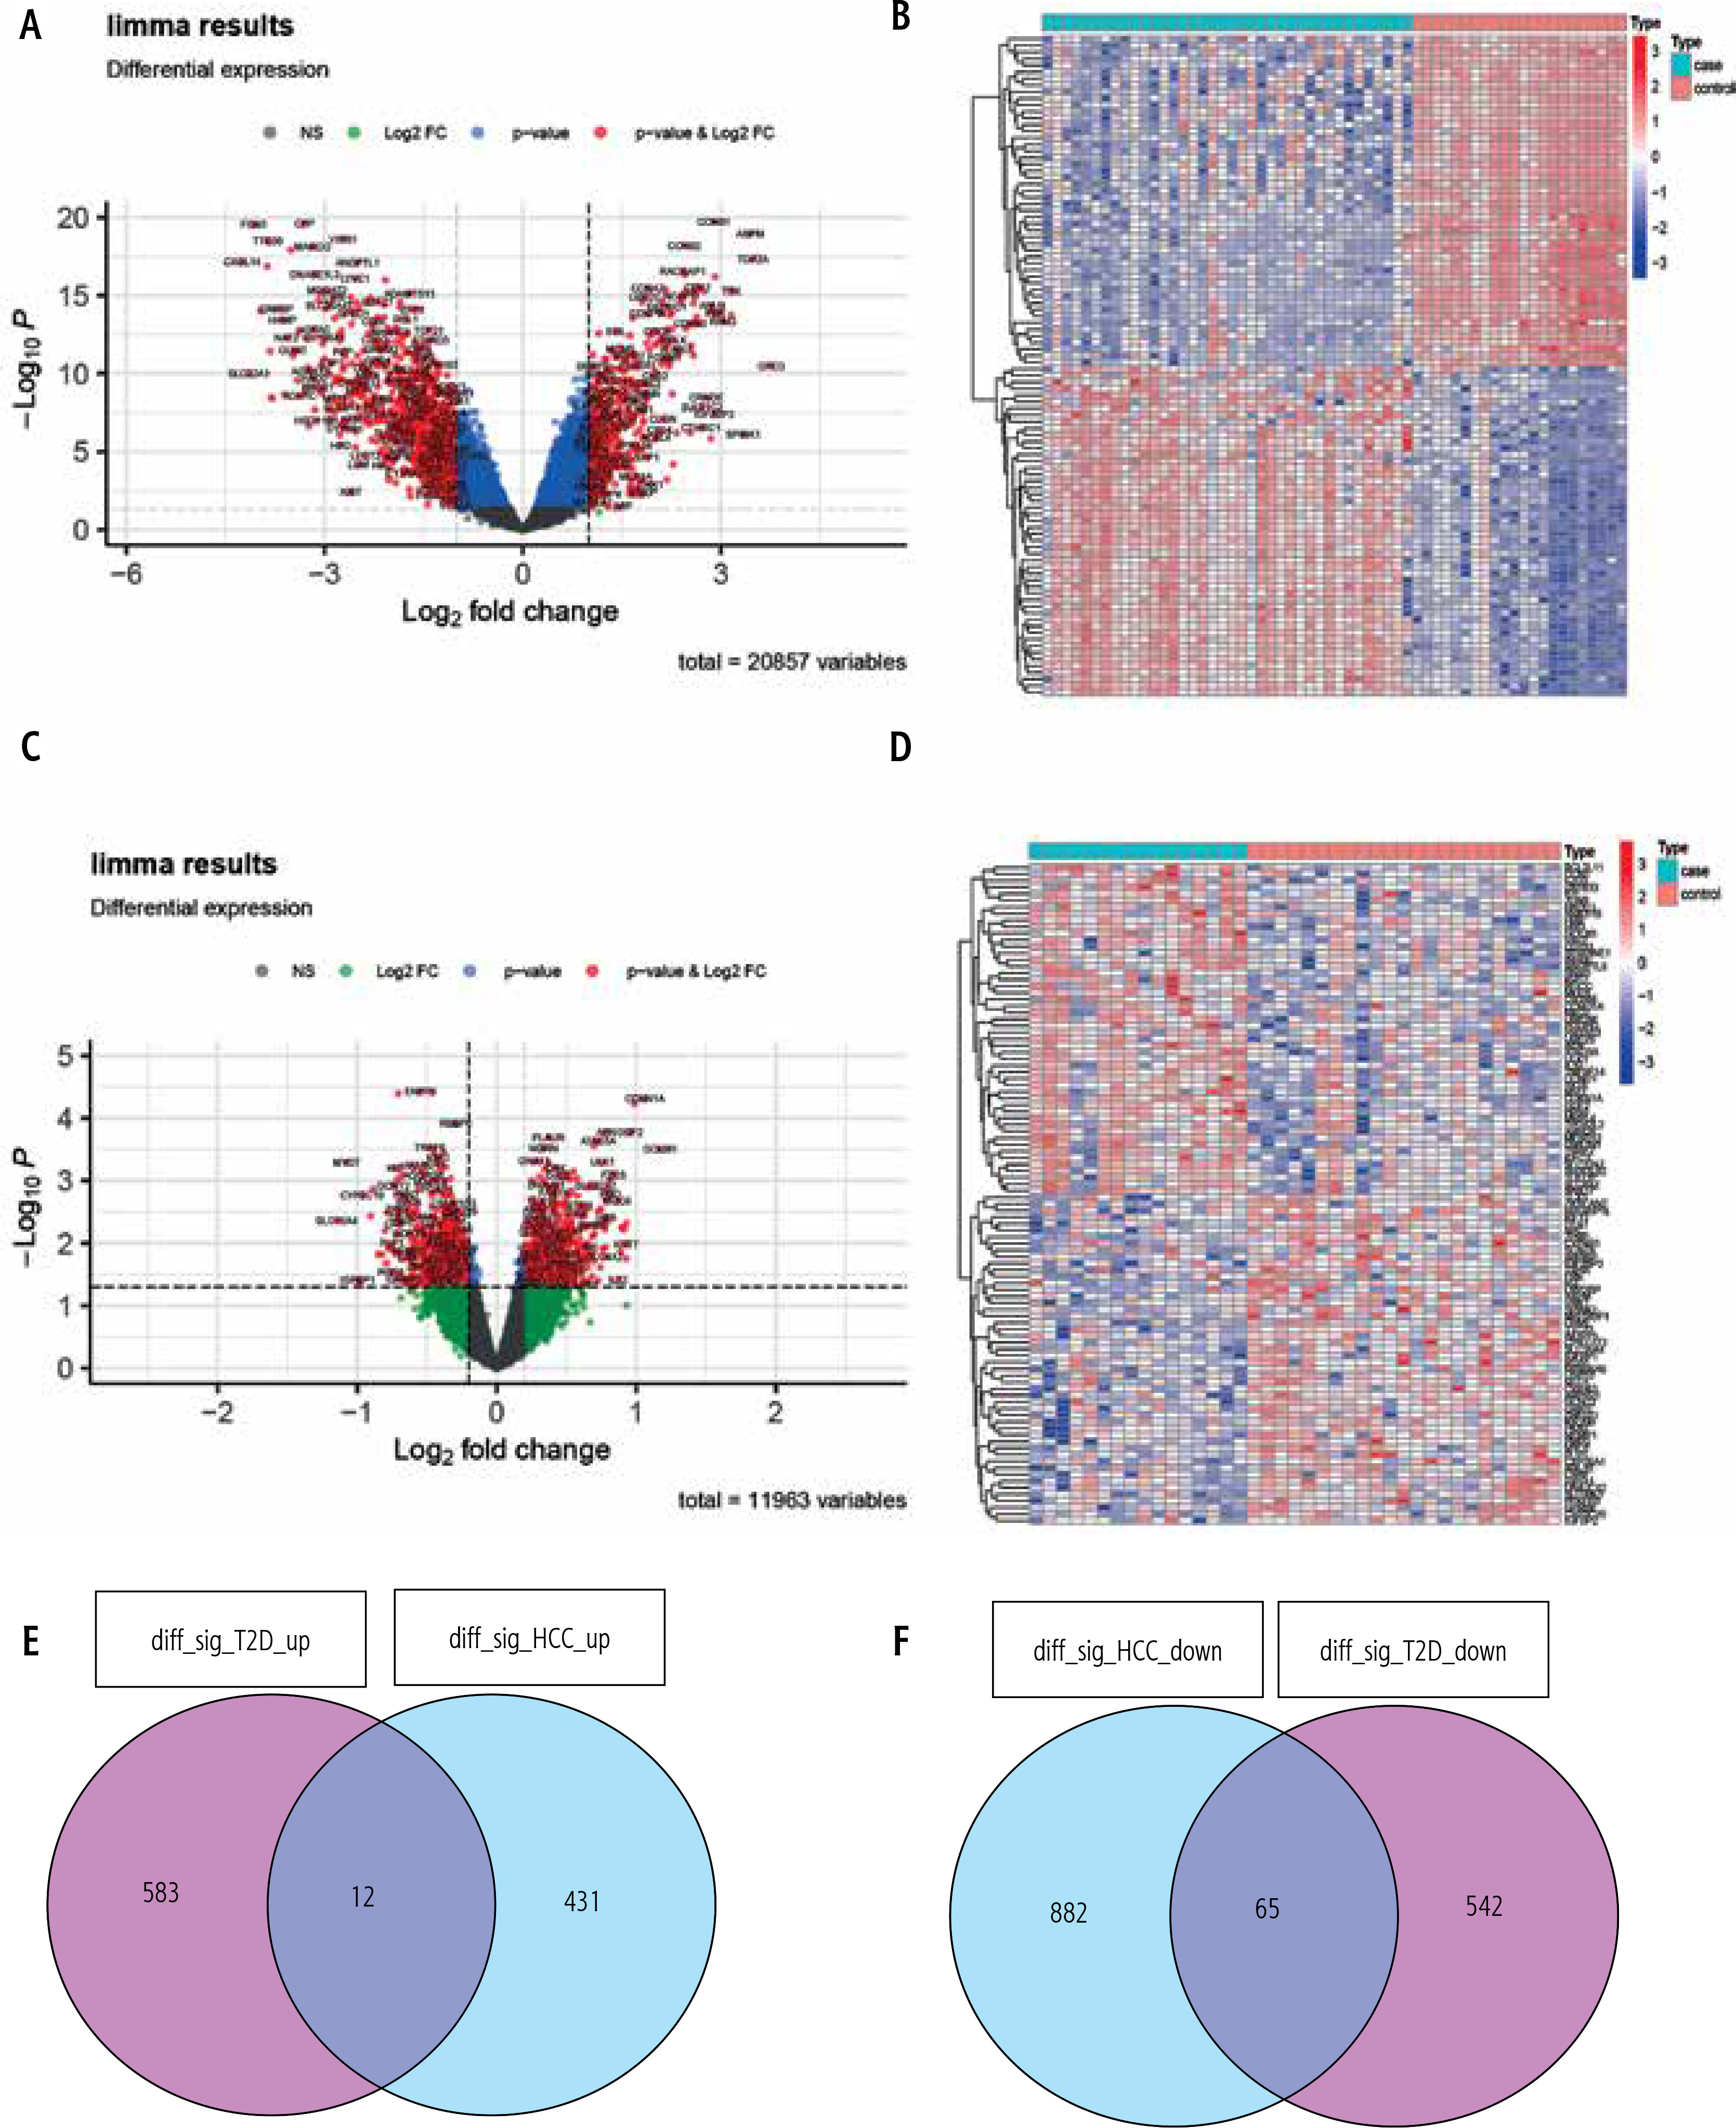
A total of four GEO datasets numbered GSE15653 (T2DM), GSE64998 (T2DM), GSE84402 (HCC) and GSE65372 (HCC) were selected to examine shared pathogenesis between T2DM and HCC in this study. We coupled the GSE15653, GSE64998, GSE84402 and GSE101685 datasets as discovery cohorts for the DEG analysis, and used qRT-PCR to evaluate the expression of the studied hub genes. Based on the cut-off criteria – absolute log2FC > 1 in HCC, log2FC > 0.2 in T2DM, and adjusted p-value < 0.05 – DEGs were extracted after standardizing the microarray results. There were 595 upregulated genes and 947 downregulated genes among T2DM patients compared to normal individuals. Meanwhile, 443 upregulated genes and 607 downregulated genes were identified in HCC patients compared to healthy controls. To provide a better visualization, the dysregulated genes (upregulated genes: red dots; downregulated genes: green dots) for T2DM (Fig. 1A, B) and HCC (Fig. 1C, D) were presented as volcano plots and heat maps. After taking the intersection of the Venn diagram, 77 shared DEGs were obtained and were integrated into the downstream analysis (Fig. 1E, F).
Fig. 1
Identification of common differentially expressed genes (DEGs). DEGs in type 2 diabetes mellitus (T2DM) (A) are shown in the volcano plot. The top 50 DEGs are shown in the heat map (B), with red color representing significantly upregulated genes and green dots representing significantly downregulated genes. DEGs in hepatocellular carcinoma (HCC) (C) are shown in the volcano plot, and the top 50 DEGs are shown in the heat map (D), with red color representing significantly upregulated genes and green dots representing significantly downregulated genes. E, F) Venn diagram depicting the shared genes from intersection of two diseases
Analysis of the functional and pathway characteristics of common DEGs
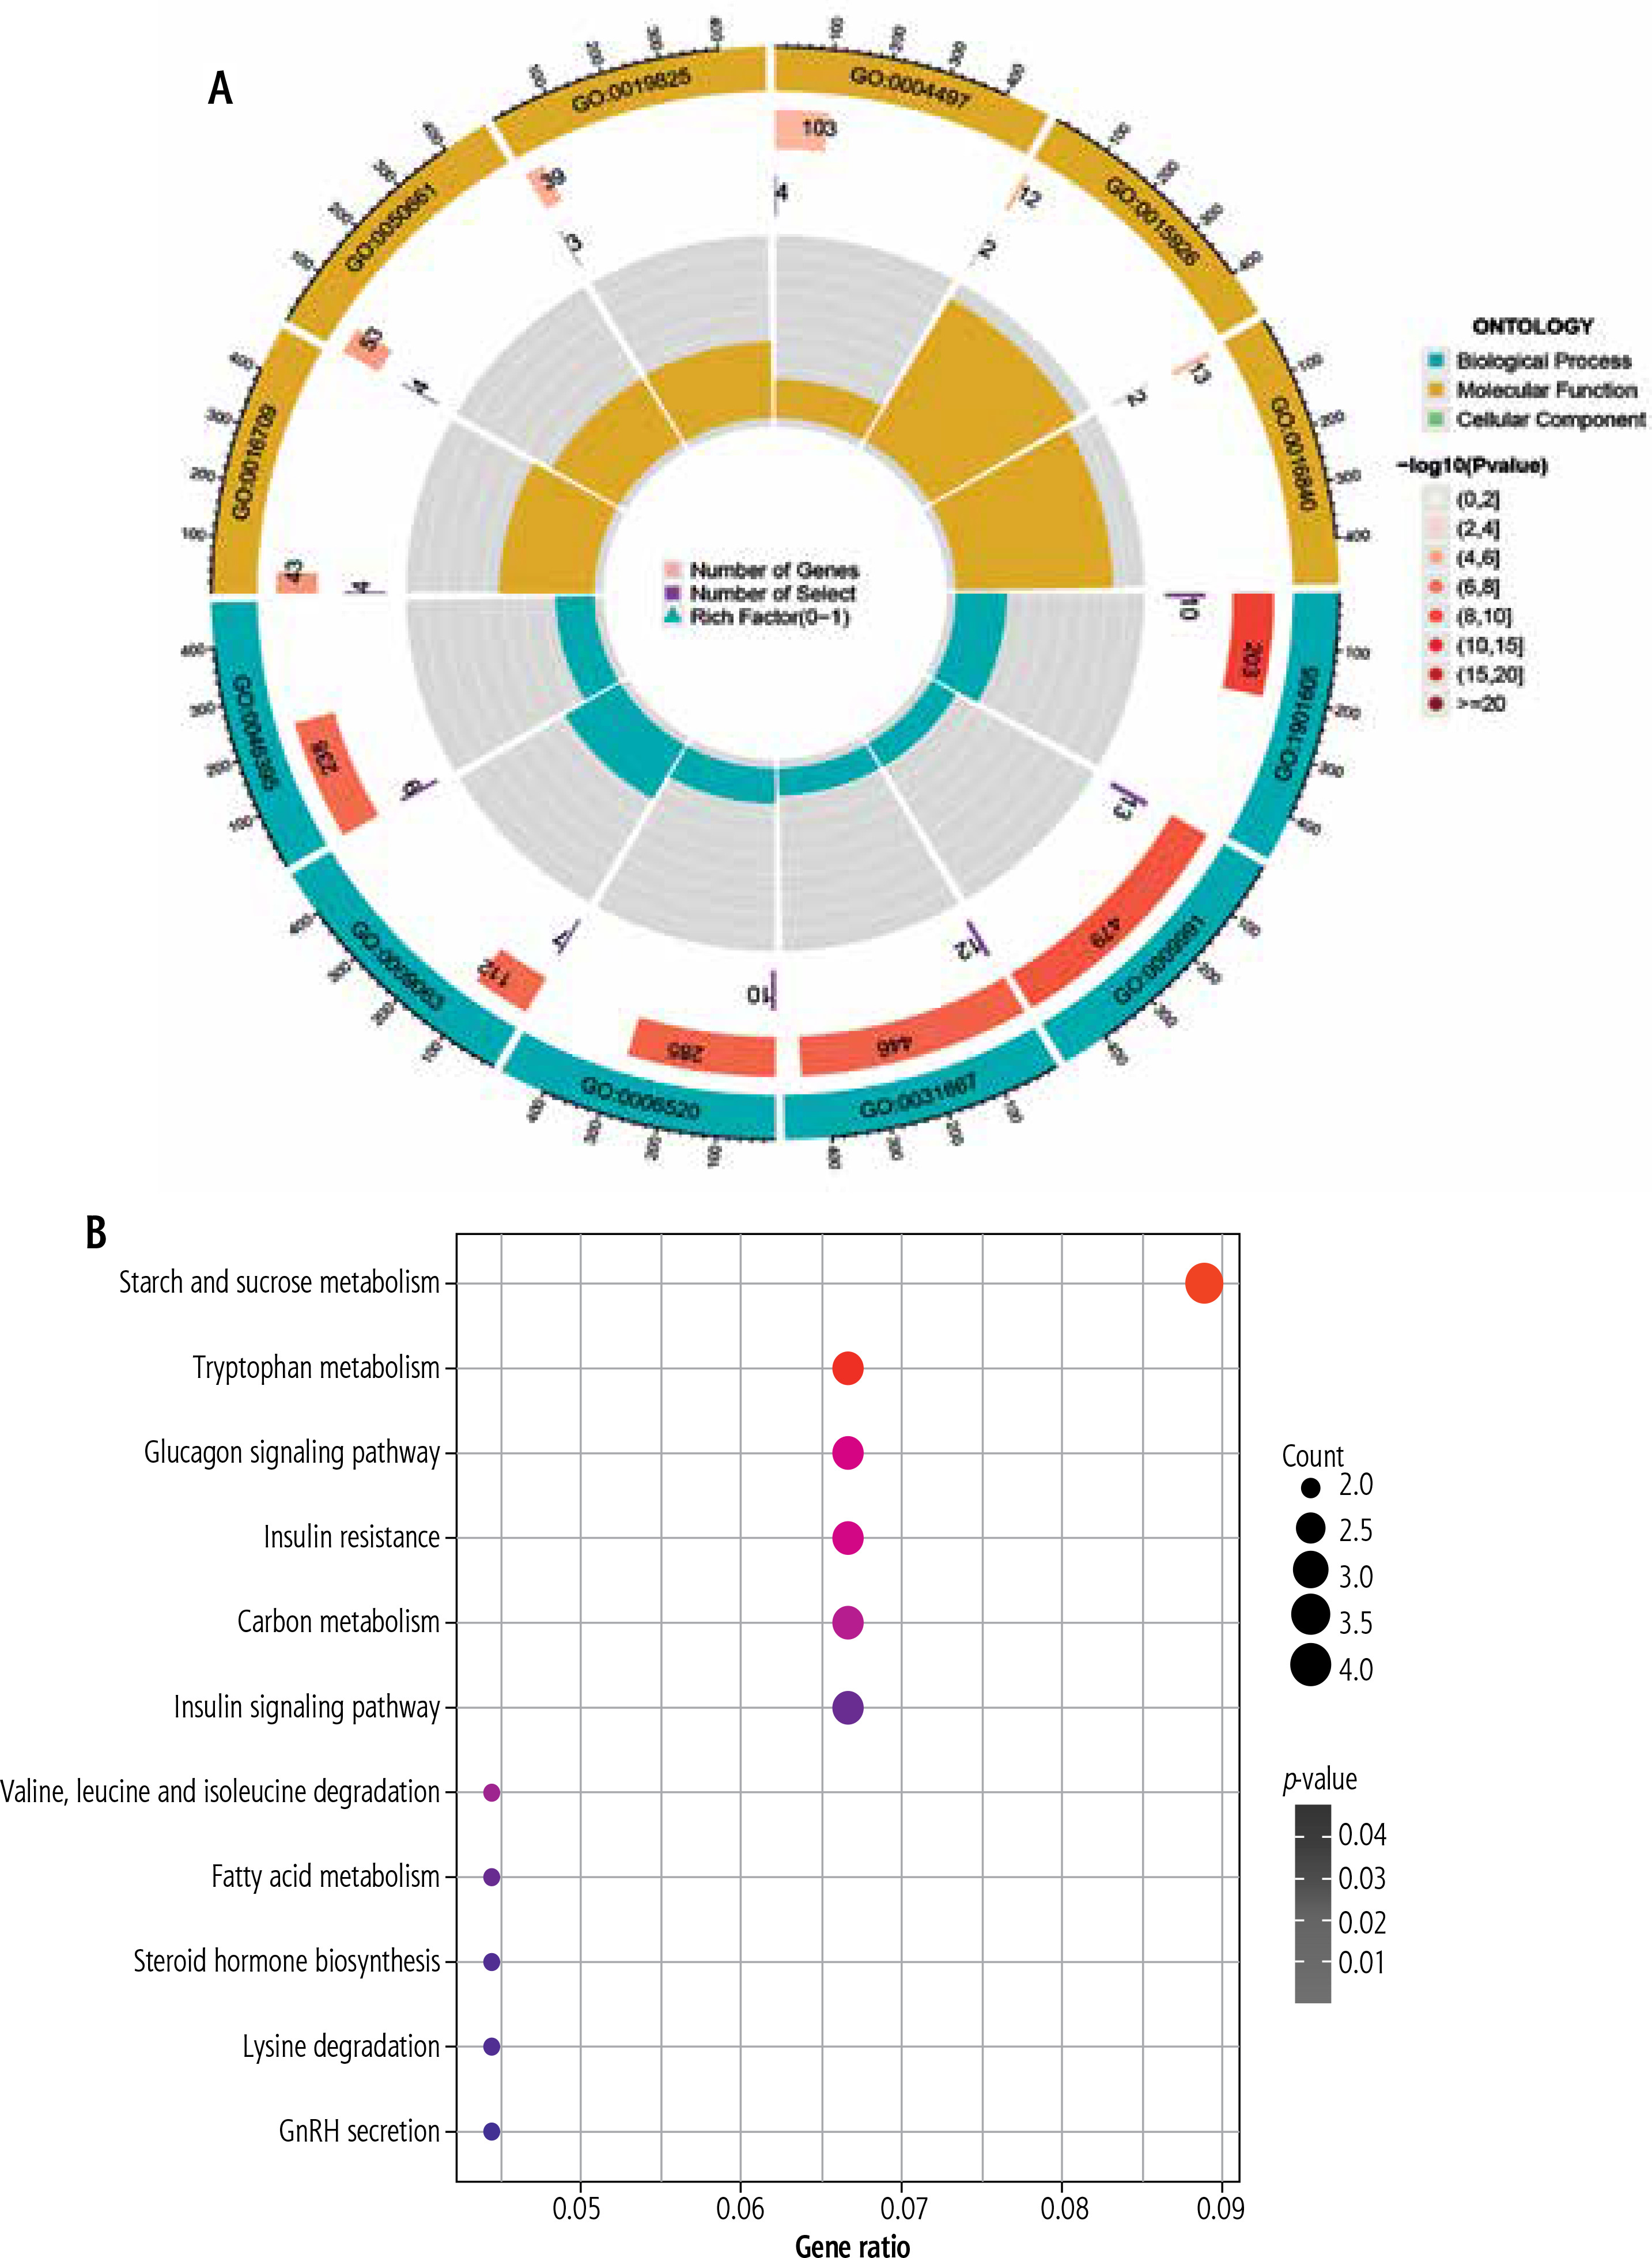
To further explore the underlying biological information of these common DEGs, the set of databases (GO, KEGG) was utilized to identify enriched functional terms. Using the GO database as an annotation source, the GO analysis of common genes was divided into three categories (biological process, cellular component and molecular function). The GO terms for each of the six predominant categories are presented in Figure 2A. The most impacted pathways of the common genes among T2DM and HCC were gathered from the KEGG databases. KEGG pathway analysis revealed the following top 11 pathways: Starch and sucrose metabolism, Tryptophan metabolism, Glucagon signaling pathway, Insulin resistance, Carbon metabolism, Insulin signaling pathway, Valine, leucine and isoleucine degradation, Fatty acid metabolism, Steroid hormone biosynthesis, Lysine degradation, and GnRH secretion (Fig. 2B). We also explored the mutation of some genes in HCC in the genome through TCGA (Suppl. Fig. 1A, B).
Fig. 2
Functional analysis of common genes between type 2 diabetes mellitus (T2DM) and hepatocellular carcinoma (HCC). A) Gene Ontology (GO) analysis of common genes between T2DM and HCC. B) Kyoto Encyclopedia of Genes and Genomes (KEGG) pathway enrichment analysis of common genes between T2DM and HCC. The size of the dot represents gene count, and the color of the dot represented the p-value
PPI network formation
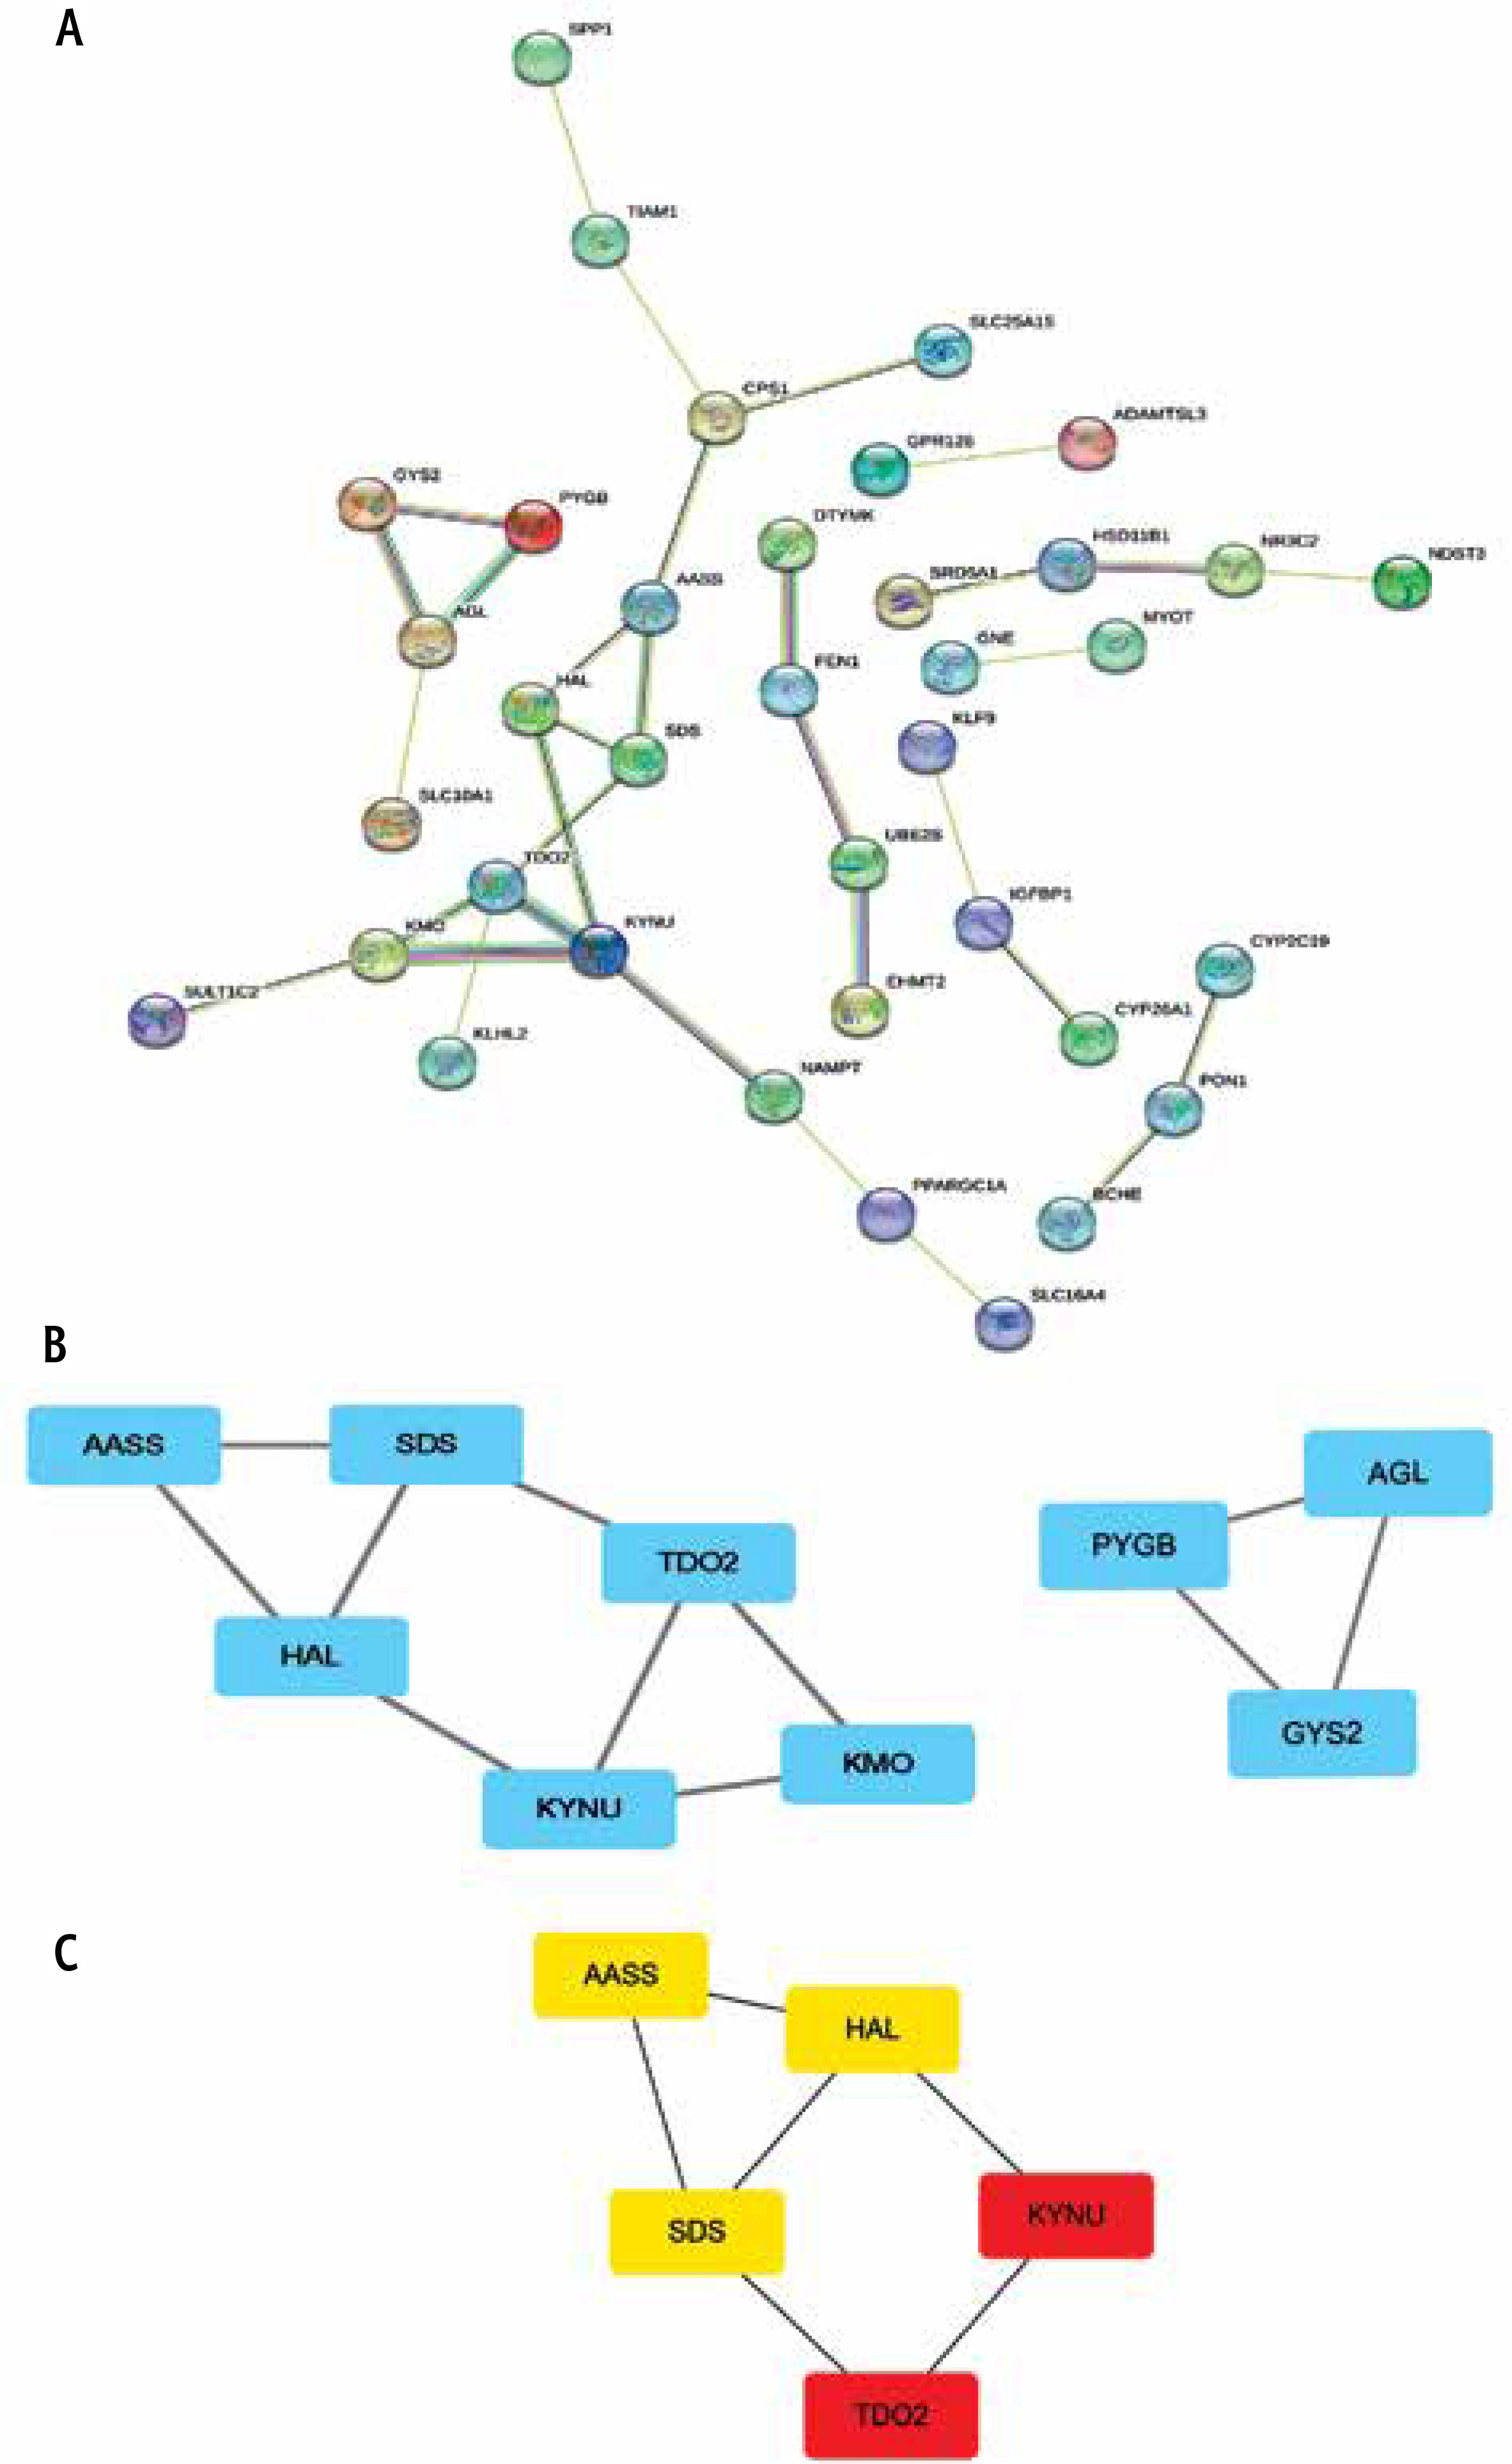
We uploaded 77 DEGs to the STRING online database to generate a PPI network, of which a total of 77 DEGs were extracted for network analysis using an interaction score set to 0.40. The resulting PPI network contained a total of 77 nodes and 33 edges (Fig. 3A). Subsequently, the MCODE plugin was used to identify the most significantly enriched module (Fig. 3B). Then, a significant module was subsequently constructed, which gained the highest MCODE score. After combining the results of MCODE and CytoHubba plugins based on degree scores, five hub genes (AASS, HAL, SDS, TDO2 and KYNU) were selected. The 5 hub genes were loaded into the STRING database to obtain the PPI data among them, and PPIs with the highest interaction score (confidence > 0.4) were selected. In total, there were 5 nodes and 6 edges in the network (Fig. 3C).
Fig. 3
PPI Network Construction of Common differentially expressed genes (DEGs). A) Protein–protein interaction (PPI) network of the common DEGs constructed by Search Tool for the Retrieval of Interacting Genes (STRING). The nodes represent the proteins, and the edges represent the interactions across the proteins. Proteins having more edges are highly expressed, and thickness between the edges indicates the strength of interactions. B) Key subnetworks were identified by using the plugin Molecular Complex Detection (MCODE) for Cytoscape. MCODE identified the most significantly enriched module. C) After combining the results of MCODE and CytoHubba plugins based on degree scores, five hub genes were selected. Red to yellow color gradients indicate the higher ranking of hub genes
Transcription levels of 5 hub genes in LIHC tissues and normal liver tissues
AASS, HAL, SDS, TDO2 and KYNU were found to be negatively correlated with tumor stage based on the TCGA database (Fig. 4A). The online database UALCAN was used to analyze the expression of the 5 hub genes in LIHC tissues and normal liver tissues. The results showed that, compared with normal liver tissues, the expression levels of 5 genes were downregulated in LIHC tissues based on Edmondson Steiner tumor grade. TDO2 expression level in normal liver tissues was higher than in grade 1, grade 2, grade 3 and grade 4 tissues (all p < 0.001).
Fig. 4
A) The expression of five hub genes in liver hepatocellular carcinoma (LIHC) patients based on tumor grade (UALCAN database). B) Quantitative real-time polymerase chain reaction (PCR) results for the five hub genes. Expression of hub genes was normalized against β-actin expression. The statistical significance of differences was calculated by Student’s t-test. **p < 0.01, ***p < 0.001
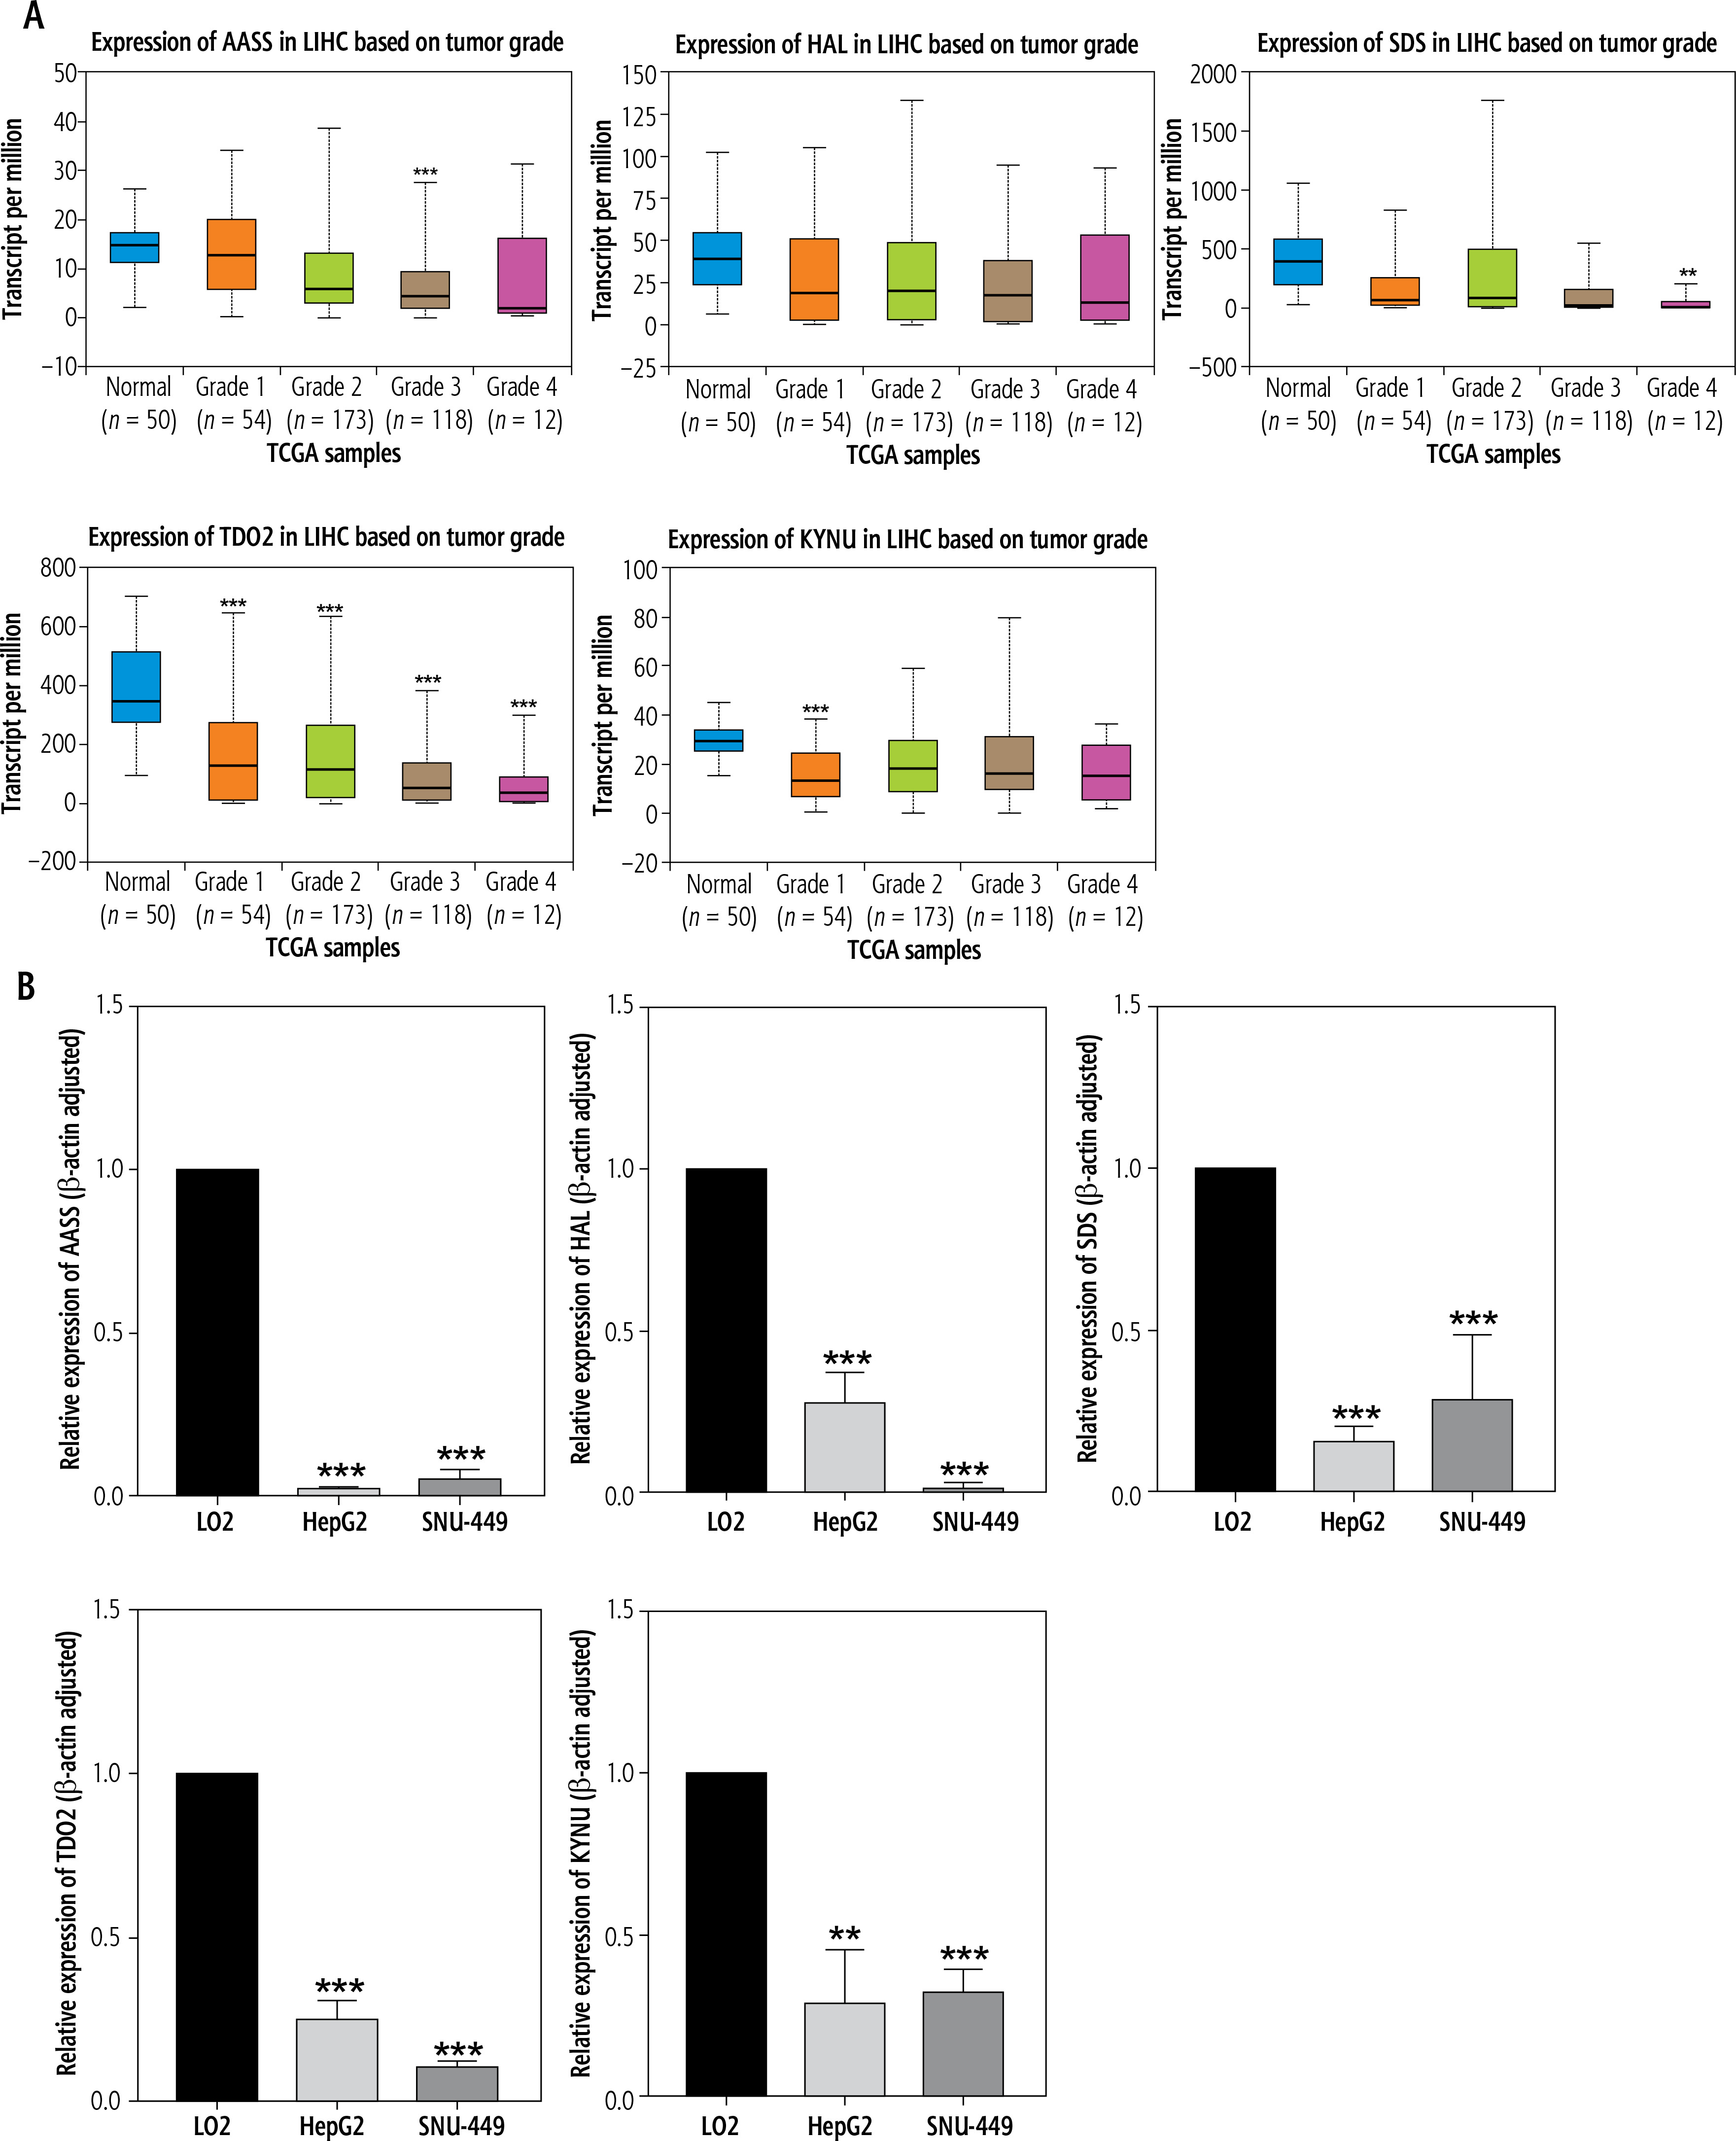
To further verify the results of bioinformatics analysis, the mRNA levels of the 5 hub genes were determined in LO2 cells, HepG2 cells and SNU-449 cells with qRT-PCR. As illustrated in Figure 4B, the 5 hub genes were significantly downregulated in HepG2 cells and SNU-449 cells compared with LO2 cells (all p < 0.05), as predicted by the bioinformatics analysis.
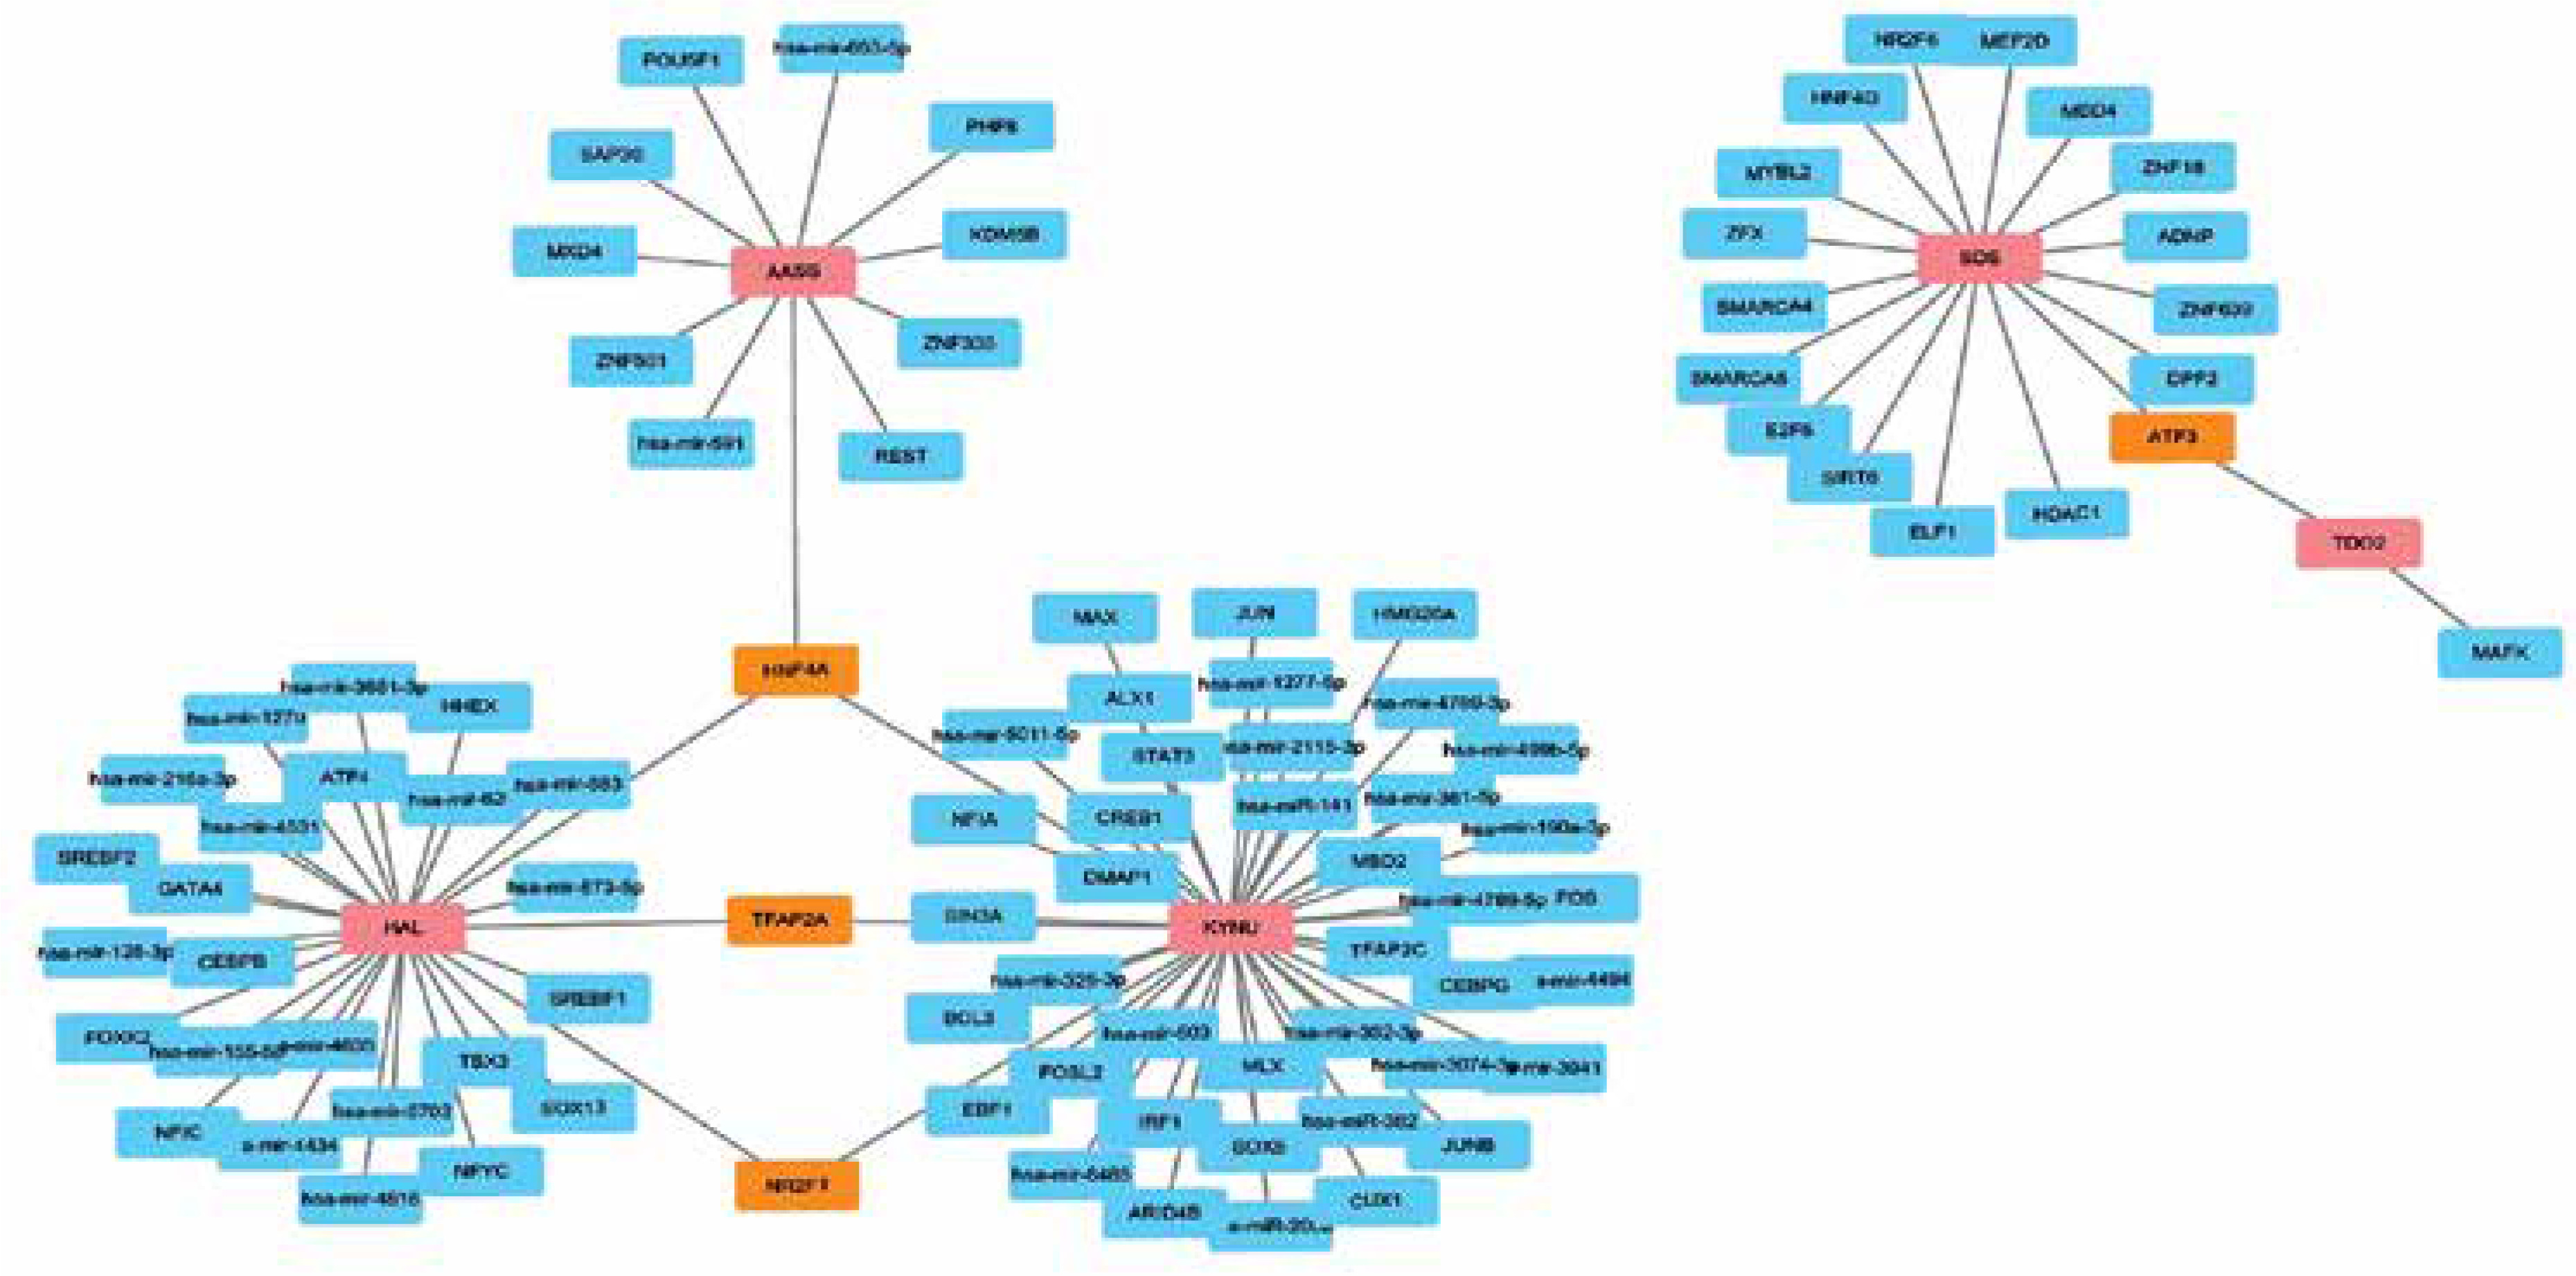
GRN analysis identified TF-miRNA-gene interactions
In order to determine the major changes at the transcriptional level and better understand the regulatory hub protein, Figure 5 depicts the interaction network between TFs and hub genes. The gene GRN interaction network consists of 100 nodes. The dysregulated genes are represented by the pink blocks in the picture, while the blue blocks represent the miRNAs. The association among different nodes of hub genes and miRNA is represented by different lines linking them. Among them, transcription factor HNF4A jointly regulates the expression of AASS, HAL, and KYNU genes, transcription factors TFAP2A and NR2F1 jointly regulate the expression of HAL and KYNU genes, and transcription factor ATF3 regulates the expression of SDS and TDO2 genes. This result suggests that there are multiple different pathways of mutual influence between these hub genes.
Discussion
Based on epidemiological research, it has been observed that people with T2DM may have a higher risk of developing various types of cancer, particularly when diabetes remains uncontrolled. The American Diabetes Association and the American Cancer Association have concluded that there is a convincing correlation between T2DM and various types of cancer such as colorectal cancer, pancreatic cancer, liver cancer, breast cancer, endometrial cancer, and bladder cancer [14]. In a recent review of 27 meta-analyses, Tsilidis et al. also confirmed that some cancers have strong associations with T2DM [15]. Within the field of hepatology, epidemiological studies have indicated the presence of synergistic effects among those susceptible to HCC due to chronic liver disease [2, 13]. Given the poor prognosis and substandard life expectancy observed in individuals afflicted with HCC, it is imperative to elucidate the molecular mechanisms that underlie the development of HCC in T2DM patients. However, the molecular mechanism of the complex interaction between T2DM and HCC is unclear, so we aimed to investigate the common genes and characteristics of T2DM and HCC through bioinformatics analysis.
Global gene expression data from the GEO database could aid in our better understanding of the interactive pathogenesis of T2DM and HCC. In this study, compared to the normal control group, we identified 443 upregulated genes and 607 downregulated genes in HCC, and 595 upregulated genes and 947 downregulated genes in T2DM. Subsequently, we analyzed the co-driving genes in T2DM and HCC, and found 12 co-upregulated genes and 65 co-downregulated genes, indicating that these genes played an important role in the co-pathogenesis of T2DM and HCC. Enrichment analysis revealed GO and KEGG pathways. Notably, the hub shared genes found in T2DM and HCC, namely aminoadipate-semialdehyde synthase (AASS), histidine ammonia-lyase (HAL), serine dehydratase (SDS), tryptophan 2,3-dioxygenase (TDO2), and kynureninase (KYNU), warrant special consideration as they could potentially serve as therapeutic targets for detecting HCC in T2DM patients. Furthermore, we also predicted potential miRNAs and transcription factors (TFs) regulating the hub genes and pathways. In addition, the expression levels of some potentially crucial genes were confirmed at the mRNA levels. Our findings provide novel insights into targeted T2DM and HCC therapy.
Among these genes, AASS was found in this study to be a new candidate gene that could predict the risk of refined diabetes and intervention response. Lutter et al. [16] studied the potential candidate genes influencing insulin resistance, diabetes risk and intervention response in a cross-sectional study. They obtained a total of 15 candidate genes, among which AASS was found in this study to be a new candidate gene that could predict the risk of refined diabetes and intervention response [16]. In addition, Barzi et al. found that AASS played an important role in the brain-liver metabolic axis [17], which is involved in the lysine catabolism pathway closely related to diabetes. The complicated energetics in tumors may be the cause of these results, and it seems that the anti-tumor effect of AASS needs to be further investigated. The protein encoded by the SDS gene, serine dehydratase, is mainly present in the liver and is responsible for participating in the metabolism of serine and glycine, which play important roles in the pathogenesis of diabetes [18]. Serine dehydratase plays an important role in mitochondria but was not found to be involved as a metabolic enzyme in the tricarboxylic acid cycle (TCA) cycle and electron transfer chain [19]. These changes may facilitate the biosynthesis and proliferation of cancer cells, which are known as metabolic reprogramming in cancer. Metabolic reprogramming is a hallmark of malignancy, and precedes liver cancer with oncogene mutation [20]. Currently, research suggests that SDH is a tumor suppressor and an oncometabolite [21]. Changing the expression or activity of SDH could cause various diseases. The result was consistent with several studies [20]. Among these genes, the HAL gene encodes histidine lyase. Histidine lyase is the first reaction that catalyzes the metabolic breakdown of histidine [22]. Histidine is considered to be a risk factor for various complications of diabetes. The constitutive activation of Wnt signaling caused by histidine breakdown plays an important role in the development of colorectal and liver tumors. Tsuneo et al. observed that HAL was affected by negative regulation of β-catenin/TCF dependent transcriptional activity [23]. KYNU is associated with various diseases, such as psoriasis [24], neovascular diseases [25], cancer [26] and others. Al-Mansoob et al. found that KYNU can serve as a novel potential target for supporting breast tumor cell invasion [26]. Zhao et al. found that inhibiting KYNU can inhibit the progression of colorectal cancer [27]. Zhou et al. found that indoleamine 2,3-dioxygenase (IDO) promotes the proliferation and invasion of prostate cancer cells through KYNU [28]. Ci et al. found that the depletion of KYNU may be mediated by regulating the PI3K/AKT pathway to inhibit the growth and progression of T2DM and cutaneous squamous cell carcinoma (cSCC) cells [29]. TDO2 is also closely related to various cancers. Knocking down TDO2 could inhibit the progression of colorectal cancer [27]. In addition, TDO2 modulated liver cancer cell migration and invasion via the Wnt5a pathway [30]. The TCGA database also indicated that abnormal expression of TDO2 has an impact on the survival of liver cancer patients [31]. Additionally, myocardial angiogenesis in diabetic myocardial ischemia mice is achieved by inhibiting Wnt5a/JNK signaling [32]. This further confirmed the role of TDO2 in T2DM and HCC.
However, there are still some limitations to this study. First, the available clinical information in the public database is limited. Second, further in vitro experiments are needed to better understand the shared mechanism of T2DM and HCC. By considering hub genes as molecular biomarkers, the diagnosis and treatment of HCC in T2DM patients might become an easy task [33-36]. Progression in pathogenesis of both diseases might be due to the genes that disturb the pathways which ultimately lead to disease conditions, such as KYNU and TDO2. The dysfunctions of AASS, SDS and HAL may affect the anabolism and catabolism of substances such as glucose, fatty acids and amino acids, leading to changes in energy sources in cells, and further contributing to the proliferation and migration of HCC. These findings may provide a rational explanation for the higher morbidity and poorer prognosis of HCC in T2DM patients. Finally, there is not enough evidence that 5 hub genes are good predictors for T2DM and HCC patients, and it still needs to be verified in future clinical trials.
In summary, this study elucidated the common genetic characteristics of T2DM and HCC, and demonstrated that AASS, SDS, HAL, KYNU, and TDO2 are potential therapeutic targets for T2DM and HCC patients through prognostic analysis and qRT-PCR experiments.


