
Introduction
Autoimmune liver diseases (AILDs) constitute a rare group of chronic disorders mediated by autoimmunity, featuring inflammation in the liver or bile ducts. These diseases, distinguished by their unique clinical, pathological, and epidemiological characteristics, can be categorized into three types: primary biliary cholangitis (PBC), primary sclerosing cholangitis (PSC), and autoimmune hepatitis (AIH) [1]. The incidence of PBC has risen over the last four decades, affecting 1 in 1000 individuals, with 92% of cases occurring in females. In established studies, diagnosis of PBC is only possible when a patient exhibits elevated levels of alkaline phosphatase and AMA (anti-mitochondrial antibody) [2].
In contrast, PSC is less prevalent than the former condition; however, it is closely linked with autoimmune diseases of the gastrointestinal tract and exhibits a poorer prognosis. A majority of patients ultimately require liver transplantation, with no specific autoantibodies or effective treatments identified [3]. In contrast to autoimmune biliary diseases, AIH manifests as chronic autoimmune liver injury characterized by elevated serum transaminases and immunoglobulin G, histological liver inflammation, and the presence of circulating autoantibodies [4].
Autoimmune liver diseases, as a subset of autoimmune disorders, are less frequently associated with autoimmune diseases affecting other organ systems. Despite ample research supporting the immunological mechanisms underlying AILDs [5, 6], the rarity of these conditions results in limited availability of etiological and genetic evidence pertaining to AILDs [7]. Moreover, clinical guidelines and research concerning autoimmune liver diseases underscore the importance of early identification and management of extrahepatic autoimmune diseases, which can improve patient quality of life and alleviate the treatment burden [8, 9].
Type 1 diabetes mellitus (T1DM) is a chronic autoimmune disorder with global prevalence, characterized by the autoimmune destruction of islet function, causing β-cell damage due to reactive T lymphocytes, resulting in absolute insulin deficiency and a hyperglycemic state [10]. Prolonged hyperglycemia can result in a spectrum of acute and chronic complications. Acute complications encompass diabetic ketoacidosis and coma necessitating urgent intervention, while chronic complications encompass vascular diseases such as diabetic nephropathy and neuropathy [11]. Improved living standards and increased consumption levels have contributed to the global rise in the prevalence of T1DM, especially evident in both developed and developing nations, as indicated by numerous studies [12-15]. Additionally, research indicates that individuals with T1DM face an elevated risk of developing other autoimmune disorders, imposing a substantial societal burden and exerting a considerable psychological impact on affected individuals [16]. In recent decades, significant progress has been made in investigating the comorbidities of T1DM with diverse autoimmune conditions [17]. Nevertheless, the causal relationship between T1DM and AILDs remains elusive. Investigating the causality between these conditions is pivotal, as it may deepen our understanding of the pathogenesis of T1DM and AILDs and facilitate the development of tailored therapeutic interventions.
Findings from conventional case-control or cross-sectional studies are susceptible to interference from potential confounders and reverse causation. Mendelian randomization, a novel statistical approach, assesses the genetic causal relationship between exposure and outcome by employing single nucleotide polymorphisms (SNPs) as instrumental variables (IVs), which arise during the process of base pairing [18]. MR analyses can mitigate the impact of confounding factors and reverse causation commonly encountered in traditional epidemiological approaches [19]. Hence, this study aimed to assess the causal relationship between T1DM and AILDs through a two-sample MR analysis.
Material and methods
Data sources and research design
Genetic association datasets for T1DM
Significant SNPs (P < 5 × 10⁻⁸) obtained from the genome-wide association study (GWAS) database are utilized as instrumental variables for studying AIH, PBC, and PSC. The GWAS data for T1DM were from the latest update of the FinnGen consortium R9 version (https://storage.googleapis.com/finngen-public-data-r9/summary_stats/finngen_R9_AB1_ACTINOMYCOSIS.gz). The FinnGen Biobank is a comprehensive open dataset containing genotype and phenotypic data from approximately 20,000 Finnish individuals.
Genetic association dataset of 3 autoimmune liver diseases
Summary-level GWAS data for AIH and PBC were retrieved from the European Bioinformatics Institute (EBI) database [20, 21], an internationally renowned, innovative, interdisciplinary, and open dataset for the life sciences [22]. The European Bioinformatics Institute (EBI. The European PSC GWAS data were obtained from the IEU OpenGWAS Project database. This database is managed by the Integrative Epidemiology Unit (IEU) at the University of Bristol, UK, with the aim of creating and maintaining resources, facilitating epidemiological studies, and integrating diverse data types to address complex research questions (https://gwas.mrcieu.ac.uk/).
The detailed diagnostic criteria and participant recruitment methods, including both male and female individuals of primarily European ancestry, are outlined in the original publications of these GWAS. There is no substantial overlap of samples among these GWAS datasets. Table 1 provides an overview of the GWAS datasets for T1DM and autoimmune liver disease.
Table 1
GWAS datasets used in the present study
Informed consent statement and ethics approval statement
As informed consent and ethical approval have already been obtained for each individual study, the present study does not necessitate additional informed consent or ethical approval. Additionally, all summary-level GWAS data are derived from publicly available datasets (https://gwas.mrcieu.ac.uk), and can be accessed via the respective GWAS identifiers “GWAS ID”: AIH (PMID: 34594039) ebi-a-GCST90018785, PBC (PMID: 34033851) ebi-a-GCST90061440, PSC (PMID: 27992413) ieu-a-1112, T1DM (PMID: 36653562) finn-b-T1D_WIDE1.
Selection of instruments
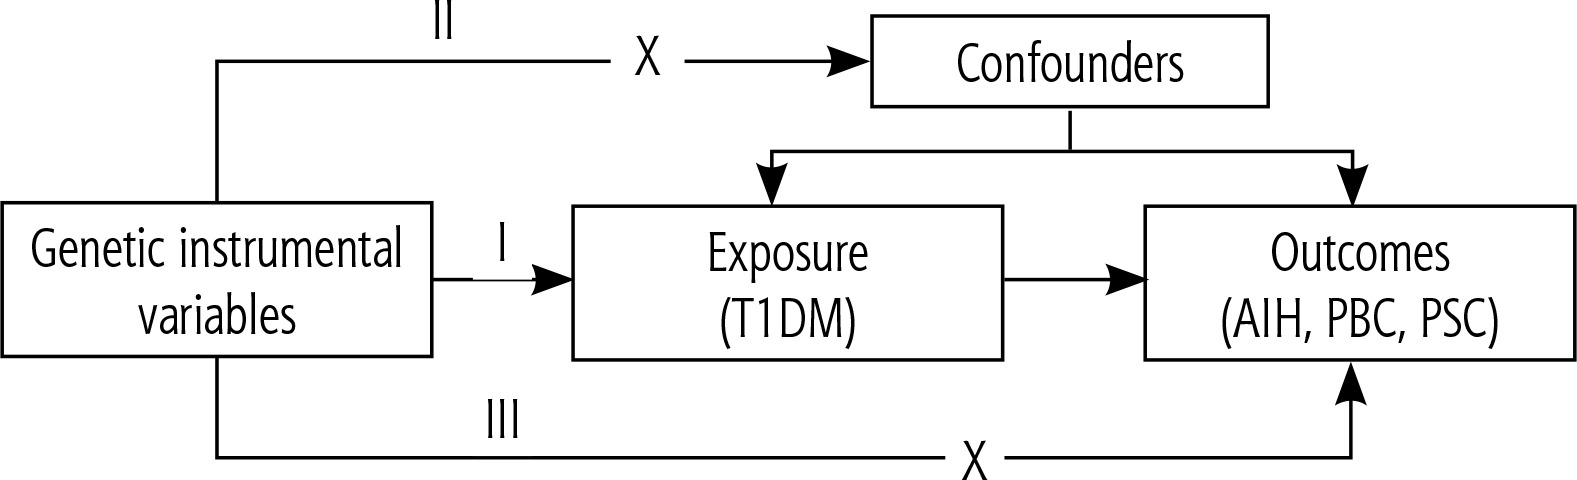
The potential causal association between T1DM and AILDs was assessed using the two-sample MR method, adhering to the STROBE-MR guidelines [23]. The study design is depicted in Figure 1. To enhance the estimation of causal effects, SNPs employed as IVs in MR analysis should satisfy three crucial assumptions [24]: 1. The selected IVs must exhibit a close association with T1DM; 2. IVs should be independent of confounding factors; 3. IVs should exclusively influence AILDs through T1DM without involving other pathways [18].
Fig. 1
Schematic diagram of the Mendelian randomization framework. The three core assumptions were as follows: (I) the single nucleotide polymorphisms (SNPs) should be strongly as associated with type I diabetes, (II) the SNPs should not be related to confounders, and (III) the SNPs should not be directly associated with autoimmune liver disease
The IVs utilized in this two-sample Mendelian randomization (MR) analysis consisted of SNPs that exhibited significant associations with both the exposure and outcome [25]. To bolster the statistical robustness of genetic variation, we performed a series of quality control procedures to identify eligible SNPs. Initially, we employed IVs to identify genetic variants meeting the genome-wide association threshold during the preprocessing of exposure data. Subsequently, to mitigate linkage disequilibrium, we excluded variants located within a physical distance of less than 10,000 kb and possessing an r 2 < 0.01. Thirdly, we manually inspected each selected SNP and its corresponding proxy secondary phenotype using PhenoScannerV2 (http://www.phenoscanner.medschl.cam.ac.uk) to additionally exclude potential pleiotropic effects. Lastly, we computed the F statistic for each IV-SNP pair (F = bet2/se2) [26]. Instrumental variables with an F statistic below 10 are deemed to have weak predictive capability for AILDs and thus were excluded.
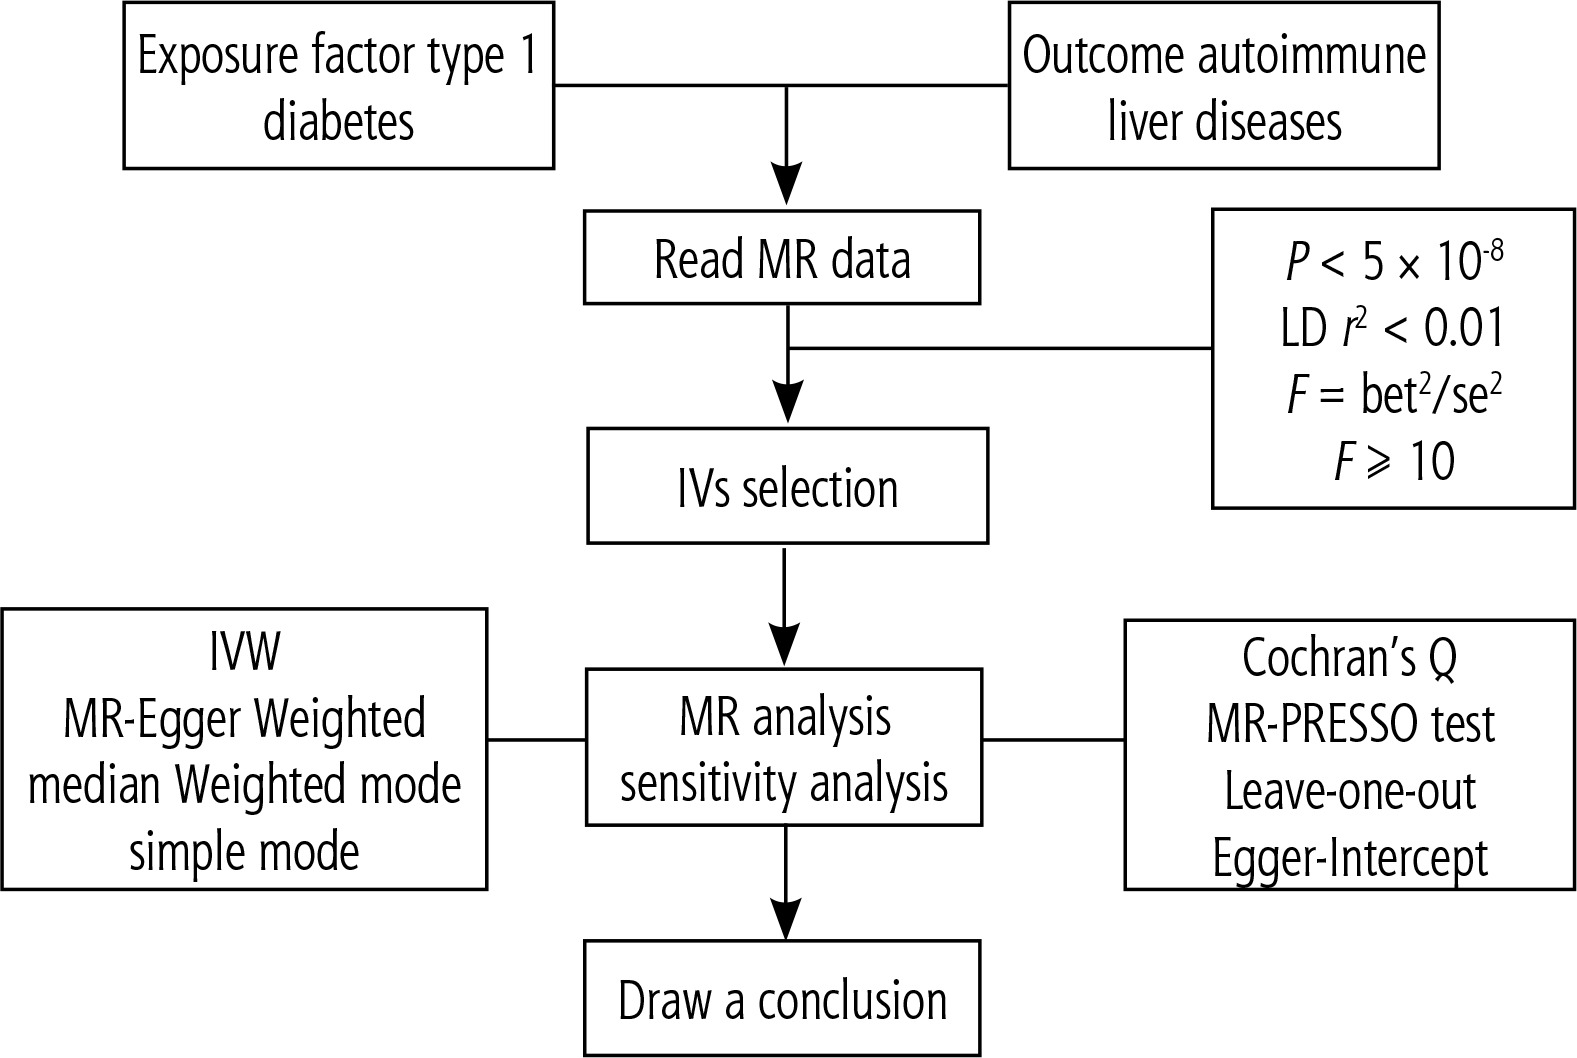
Statistical analysis
The statistical analysis process is illustrated in Figure 2. To ensure consistent allele referencing, we harmonized the exposure and outcome datasets. The primary analytical approach employed was the inverse variance weighting (IVW) method [27], supplemented by four additional sensitivity analysis methods (MR-Egger, weighted median, weighted mode, and simple mode) to assess result robustness [28]. The MR-Egger sensitivity test was conducted to assess direct pleiotropic effects and verify adherence to the fundamental assumptions of MR analysis by the instrumental variables [29]. Sensitivity analysis was performed using the leave-one-out method to assess effect size stability and identify potential SNPs that might unduly influence correlations. This involved sequentially removing each SNP and evaluating its impact on the remaining SNPs using the IVW method [30]. All statistical analyses were conducted using R (version 4.3.2) with the Two-Sample MR package (R Foundation for Statistical Computing, Vienna, Austria). Statistical significance was defined as p < 0.05.
Results
This study comprehensively evaluated the relationship between T1DM and the risk of AILD development, employing MR analysis to confirm associations with a p-value < 0.05. Additionally, the exposure data pertain to AIH, PBC, and PSC.
Impact of T1DM on AILDs
In investigating the causal link between T1DM and AIH, we identified 24 SNPs associated with AIH (Supplementary Table 1). Genetic variants of T1DM are causally linked to the risk of AILDs. Based on IVW estimation (Fig. 3A, Table 2), the presence of T1DM may elevate the risk of AIH by 16.8% (OR = 1.168, 95% CI: 1.060-1.287, p = 0.001). The MR-Egger method (OR = 1.223, 95% CI: 1.050-1.426, p = 0.017) and weighted median method (OR = 1.109, 95% CI: 0.974-1.261, p = 0.118) also produced consistent findings (Table 2). Sensitivity analysis performed using the leave-one-out method further validated the reliability of the MR analysis results (Supplementary Figure 1A). MR-Egger regression analysis depicted in Figure 3B and Table 2 revealed no significant directional horizontal pleiotropy between T1DM and AIH (intercept = 0.025, p = 0.451).
Table 2
MR results of causal associations between T1DM and AILD risk
Fig. 3
Plots of Mendelian randomization (MR) estimates of the causal relationship between type 1 diabetes mellitus (T1DM) and autoimmune liver diseases (AILDS). The log odds ratio of risk is demonstrated, and five different methods – inverse variance weighted (IVW) approach, MR-Egger, weighted median, weighted mode, and simple mode – were used. A) Forest plot of single nucleotide polymorphisms (SNPs) associated with T1DM and risk of autoimmune hepatitis (AIH). B) Scatter plot of SNPs associated with T1DM and risk of AIH. C) Forest plot of SNPs associated with T1DM and risk of primary biliary cholangitis (PBC). D) Scatter plot of SNPs associated with T1DM and risk of PBC
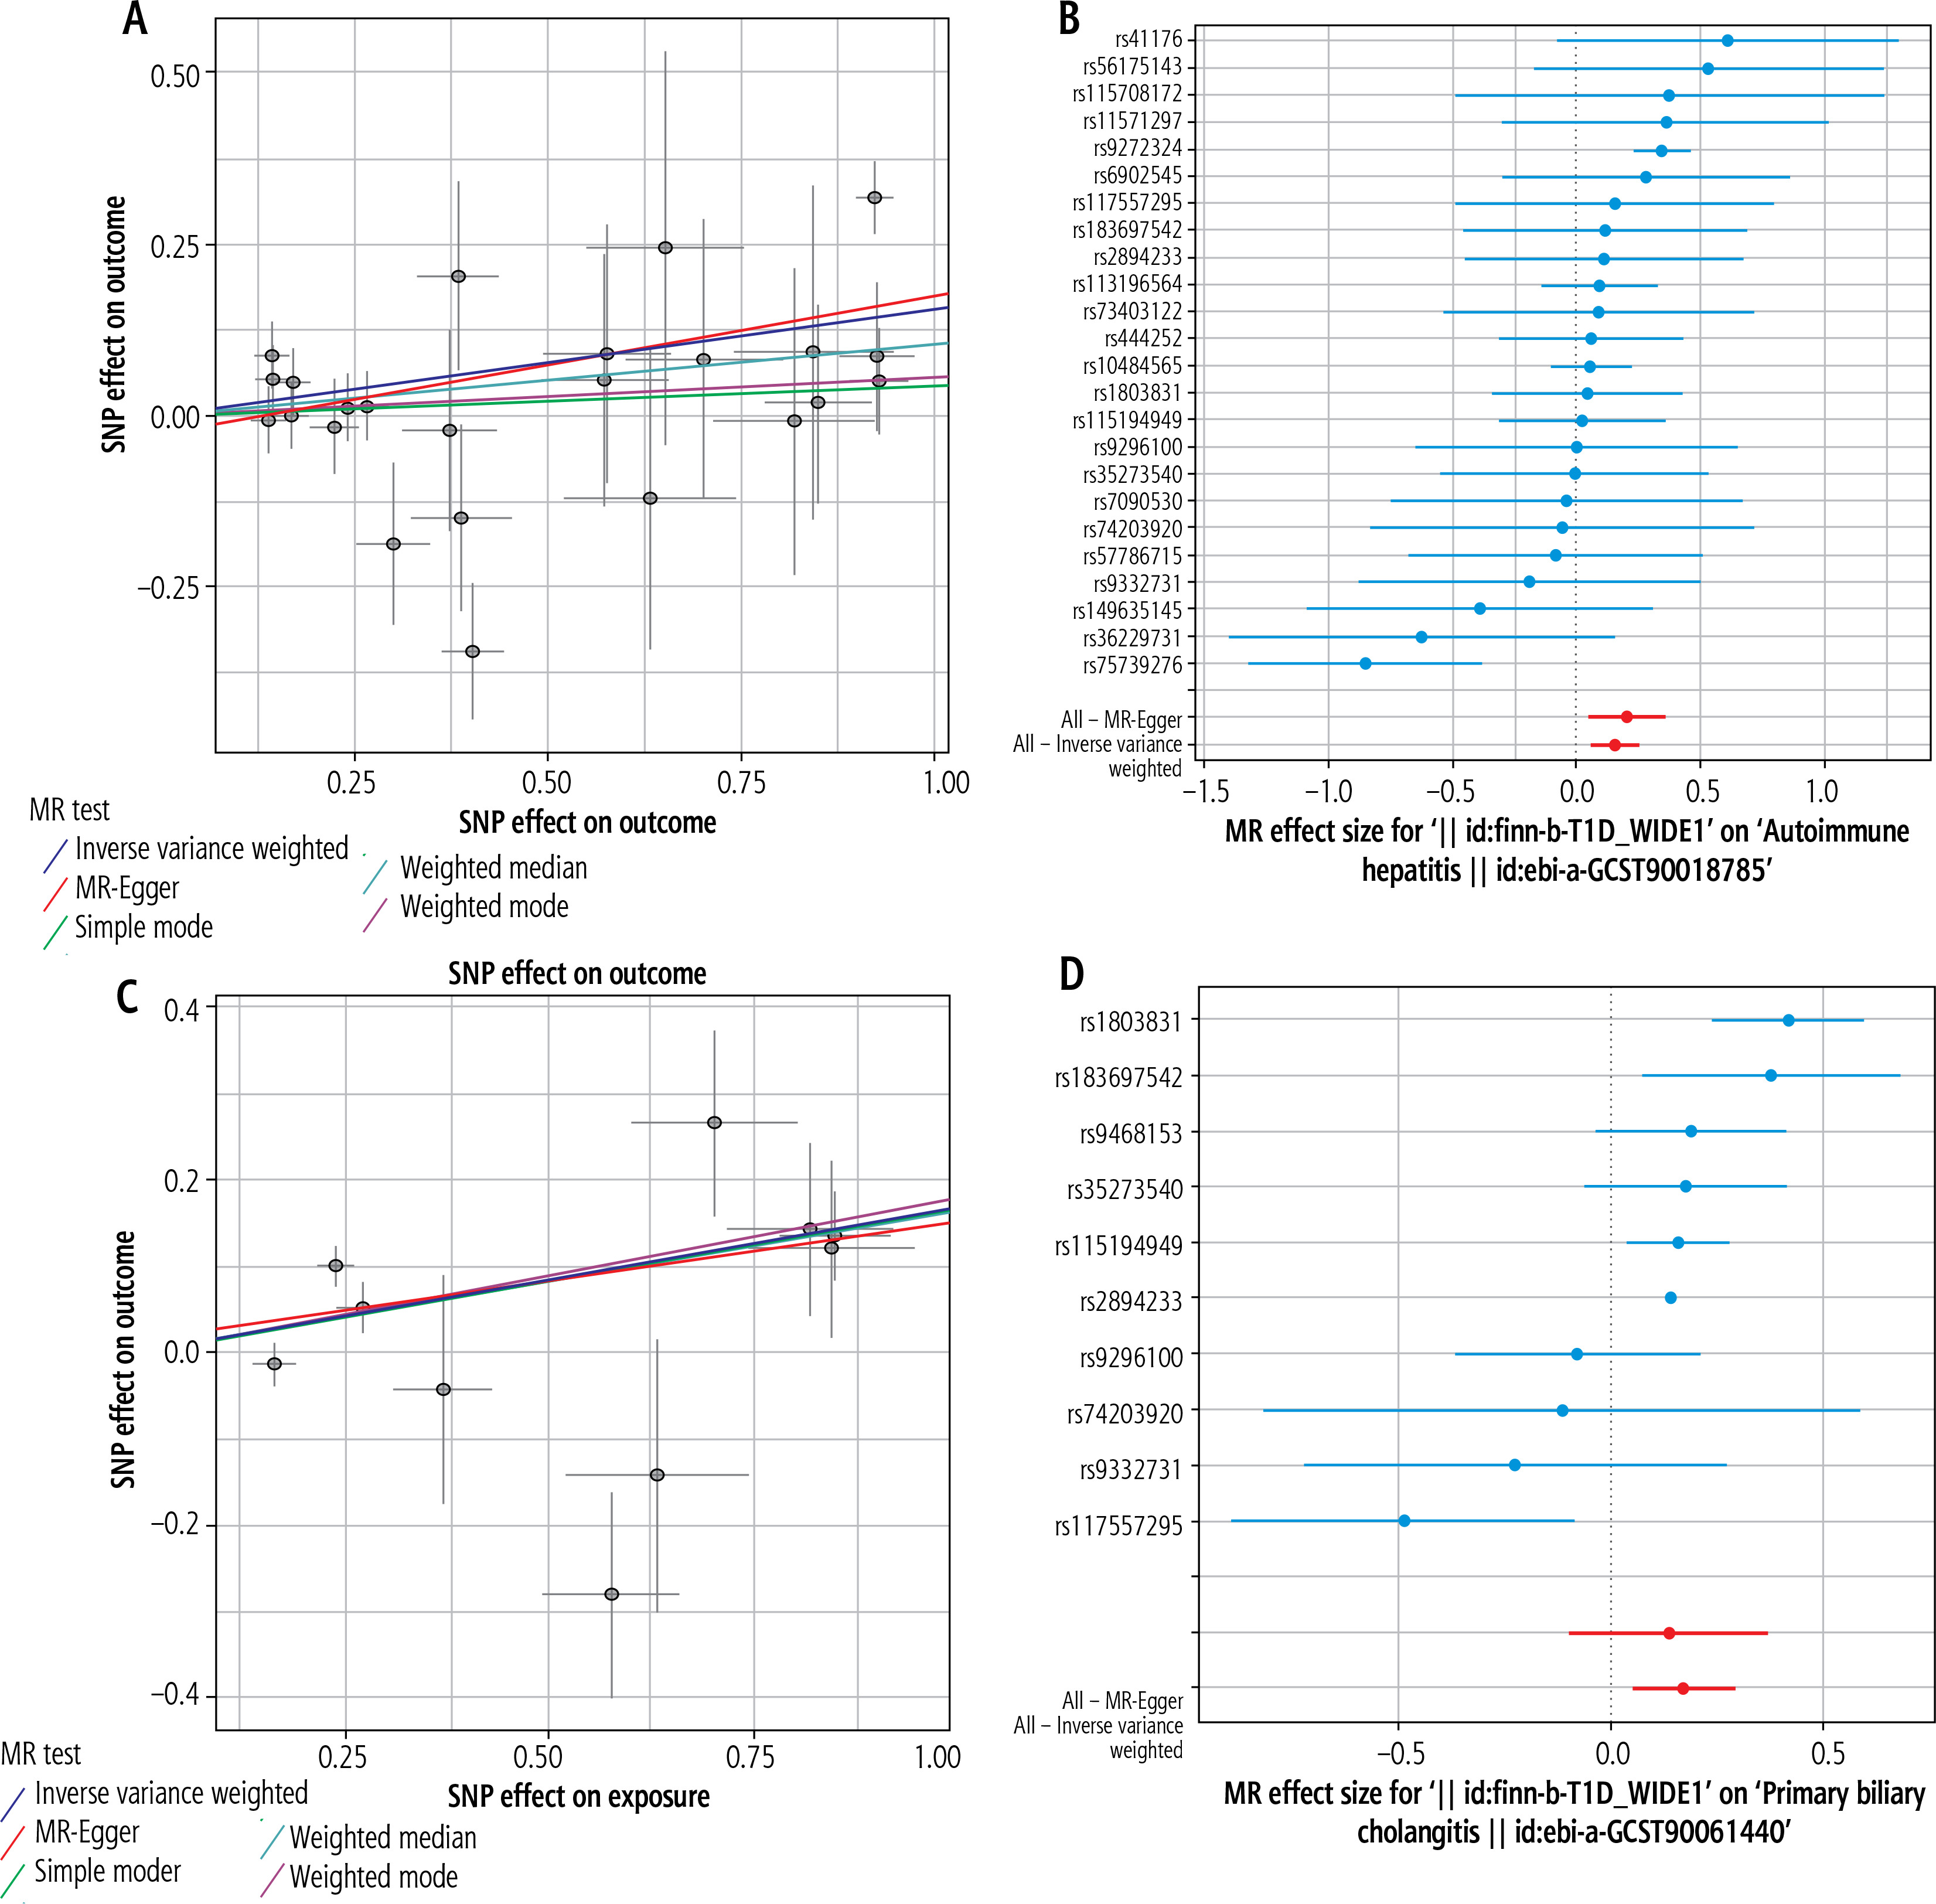
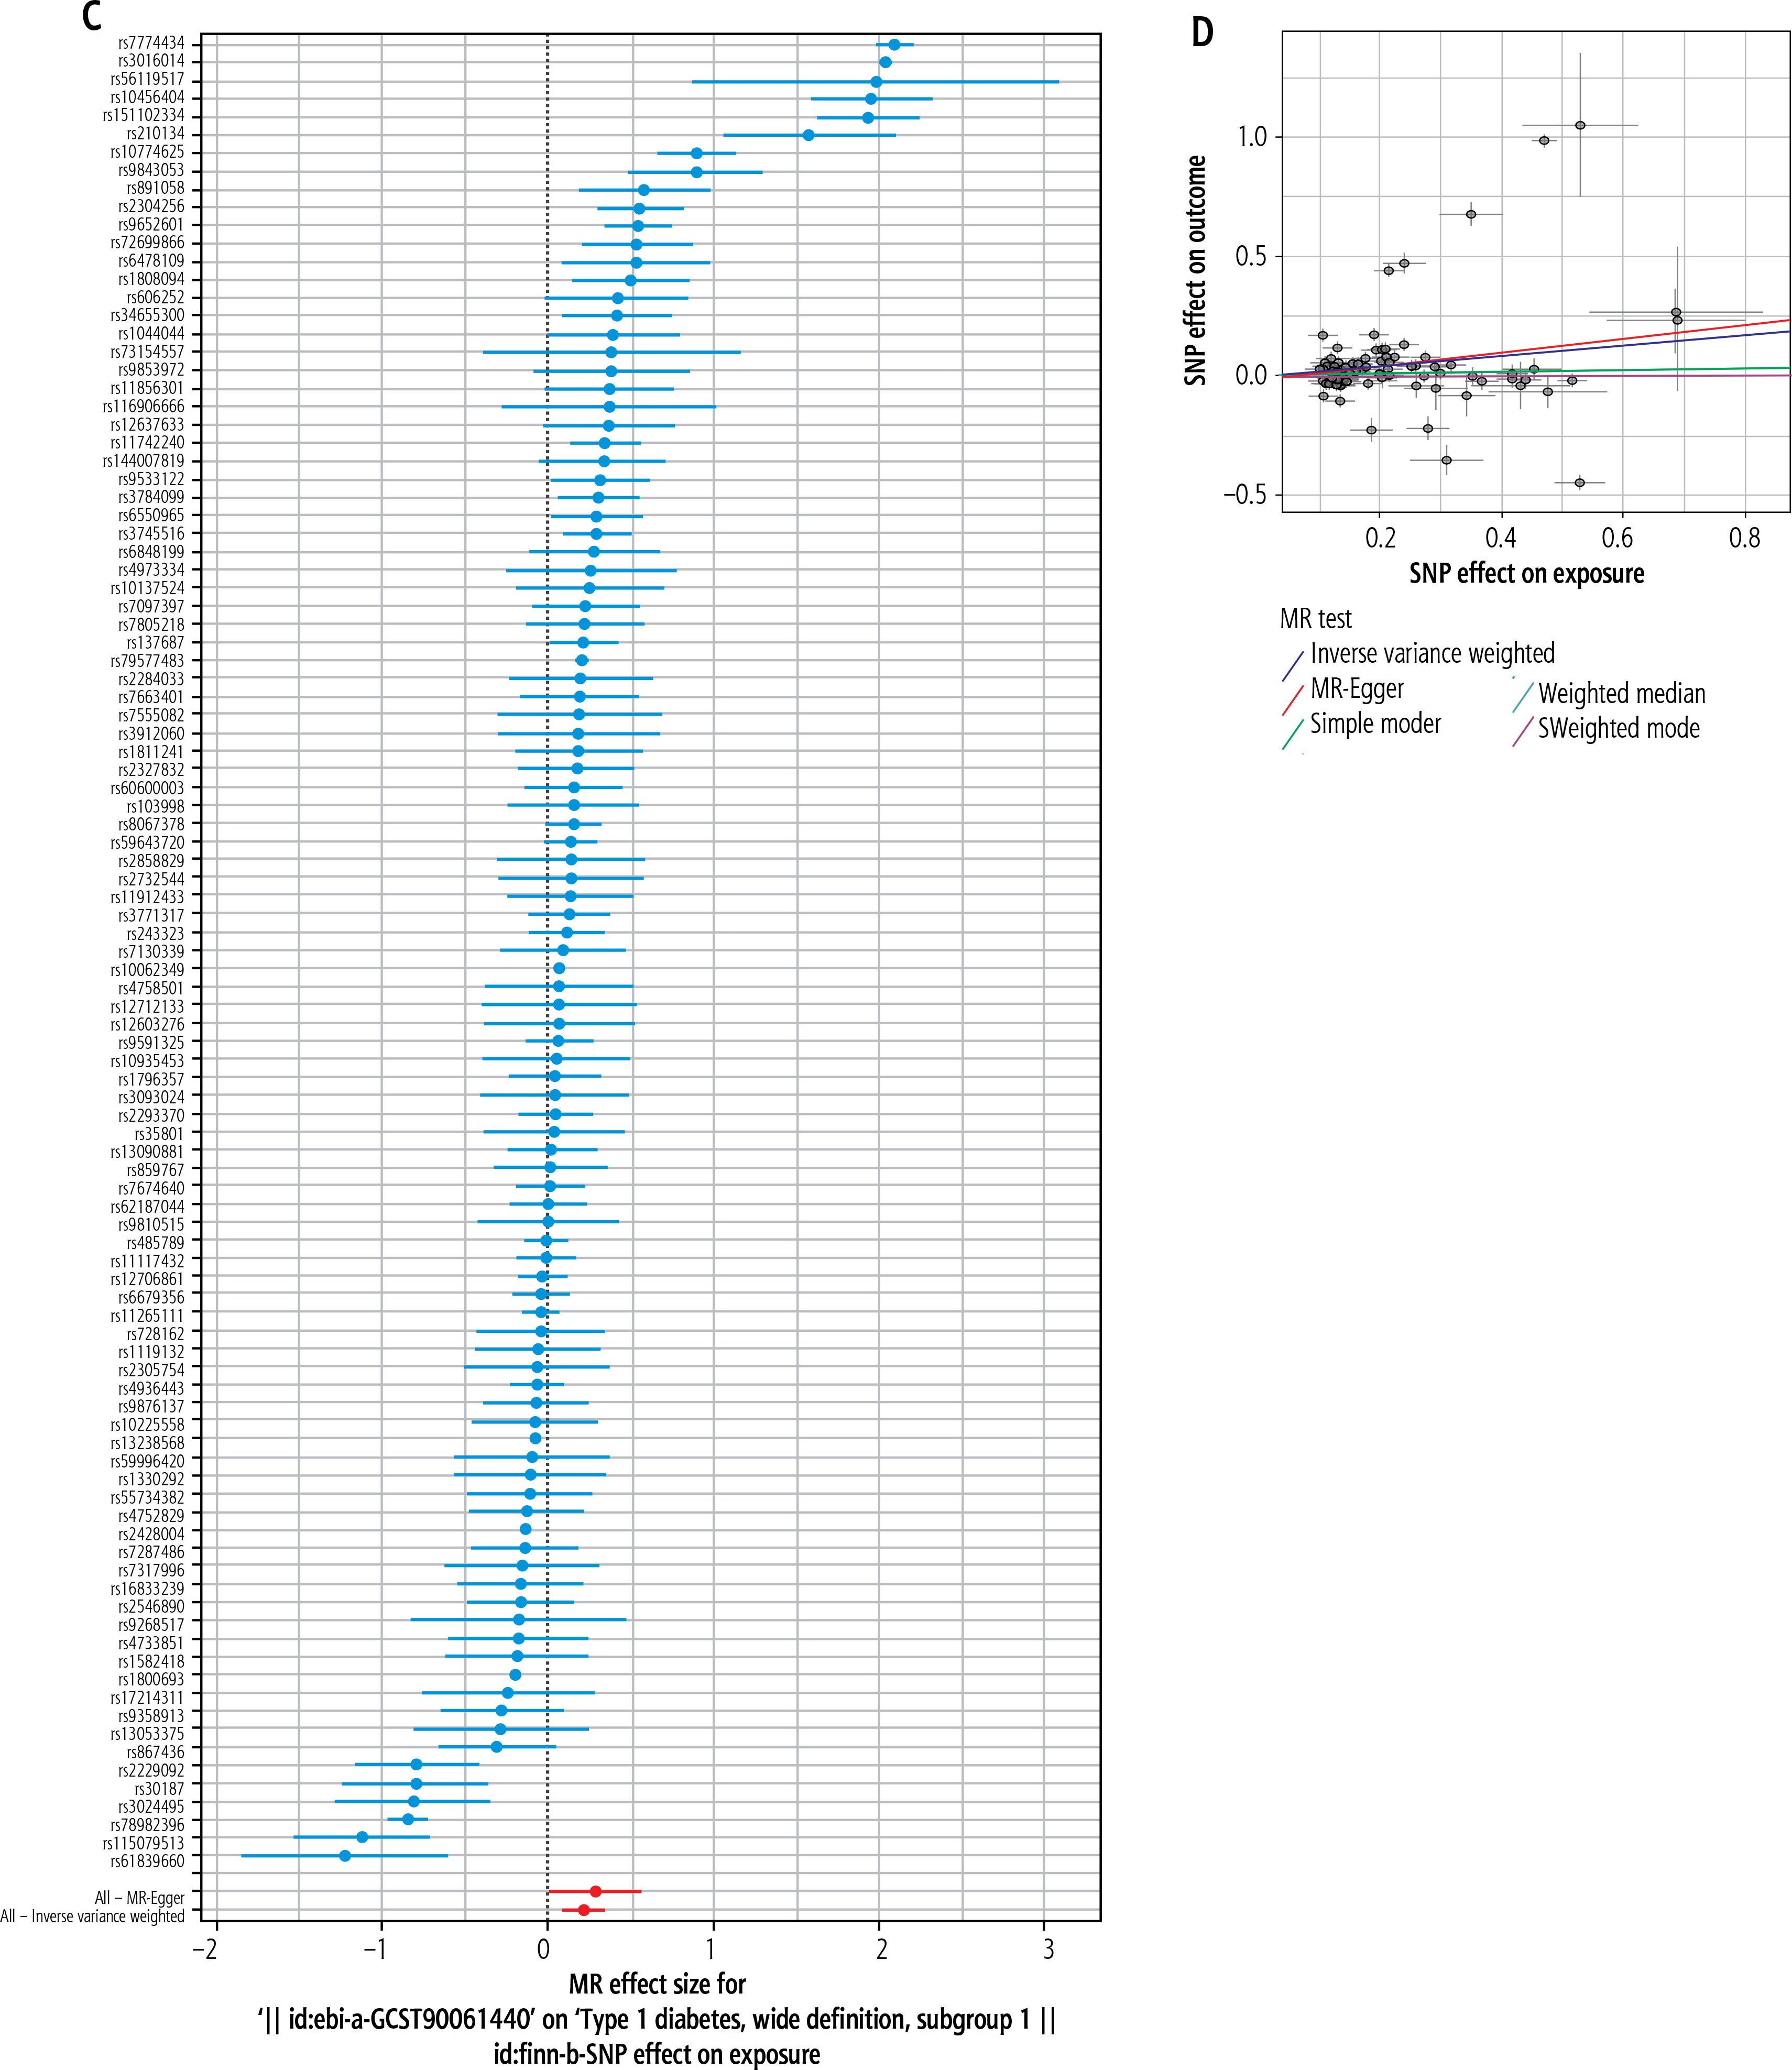
In the MR analysis, 10 independent SNPs were utilized as IVs (Supplementary Table 2). IVW-estimated results indicate that T1DM might elevate the risk of PBC (OR = 1.186, 95% CI: 1.050-1.341, p = 0.006) (Fig. 3C, Table 2). Furthermore, MR-Egger (OR = 1.148, 95% CI: 0.910-1.448, p = 0.279) and weighted median (OR = 1.180, 95% CI: 1.065-1.308, p = 0.002) analyses yielded consistent findings (Table 2). Sensitivity analysis employing the leave-one-out method confirmed the reliability of the MR analysis results (Supplementary Figure1B). Horizontal pleiotropy between IVs and outcomes was assessed via MR-Egger regression, revealing no significant intercept (intercept = 0.014, p = 0.745) (Fig. 3D, Table 2).
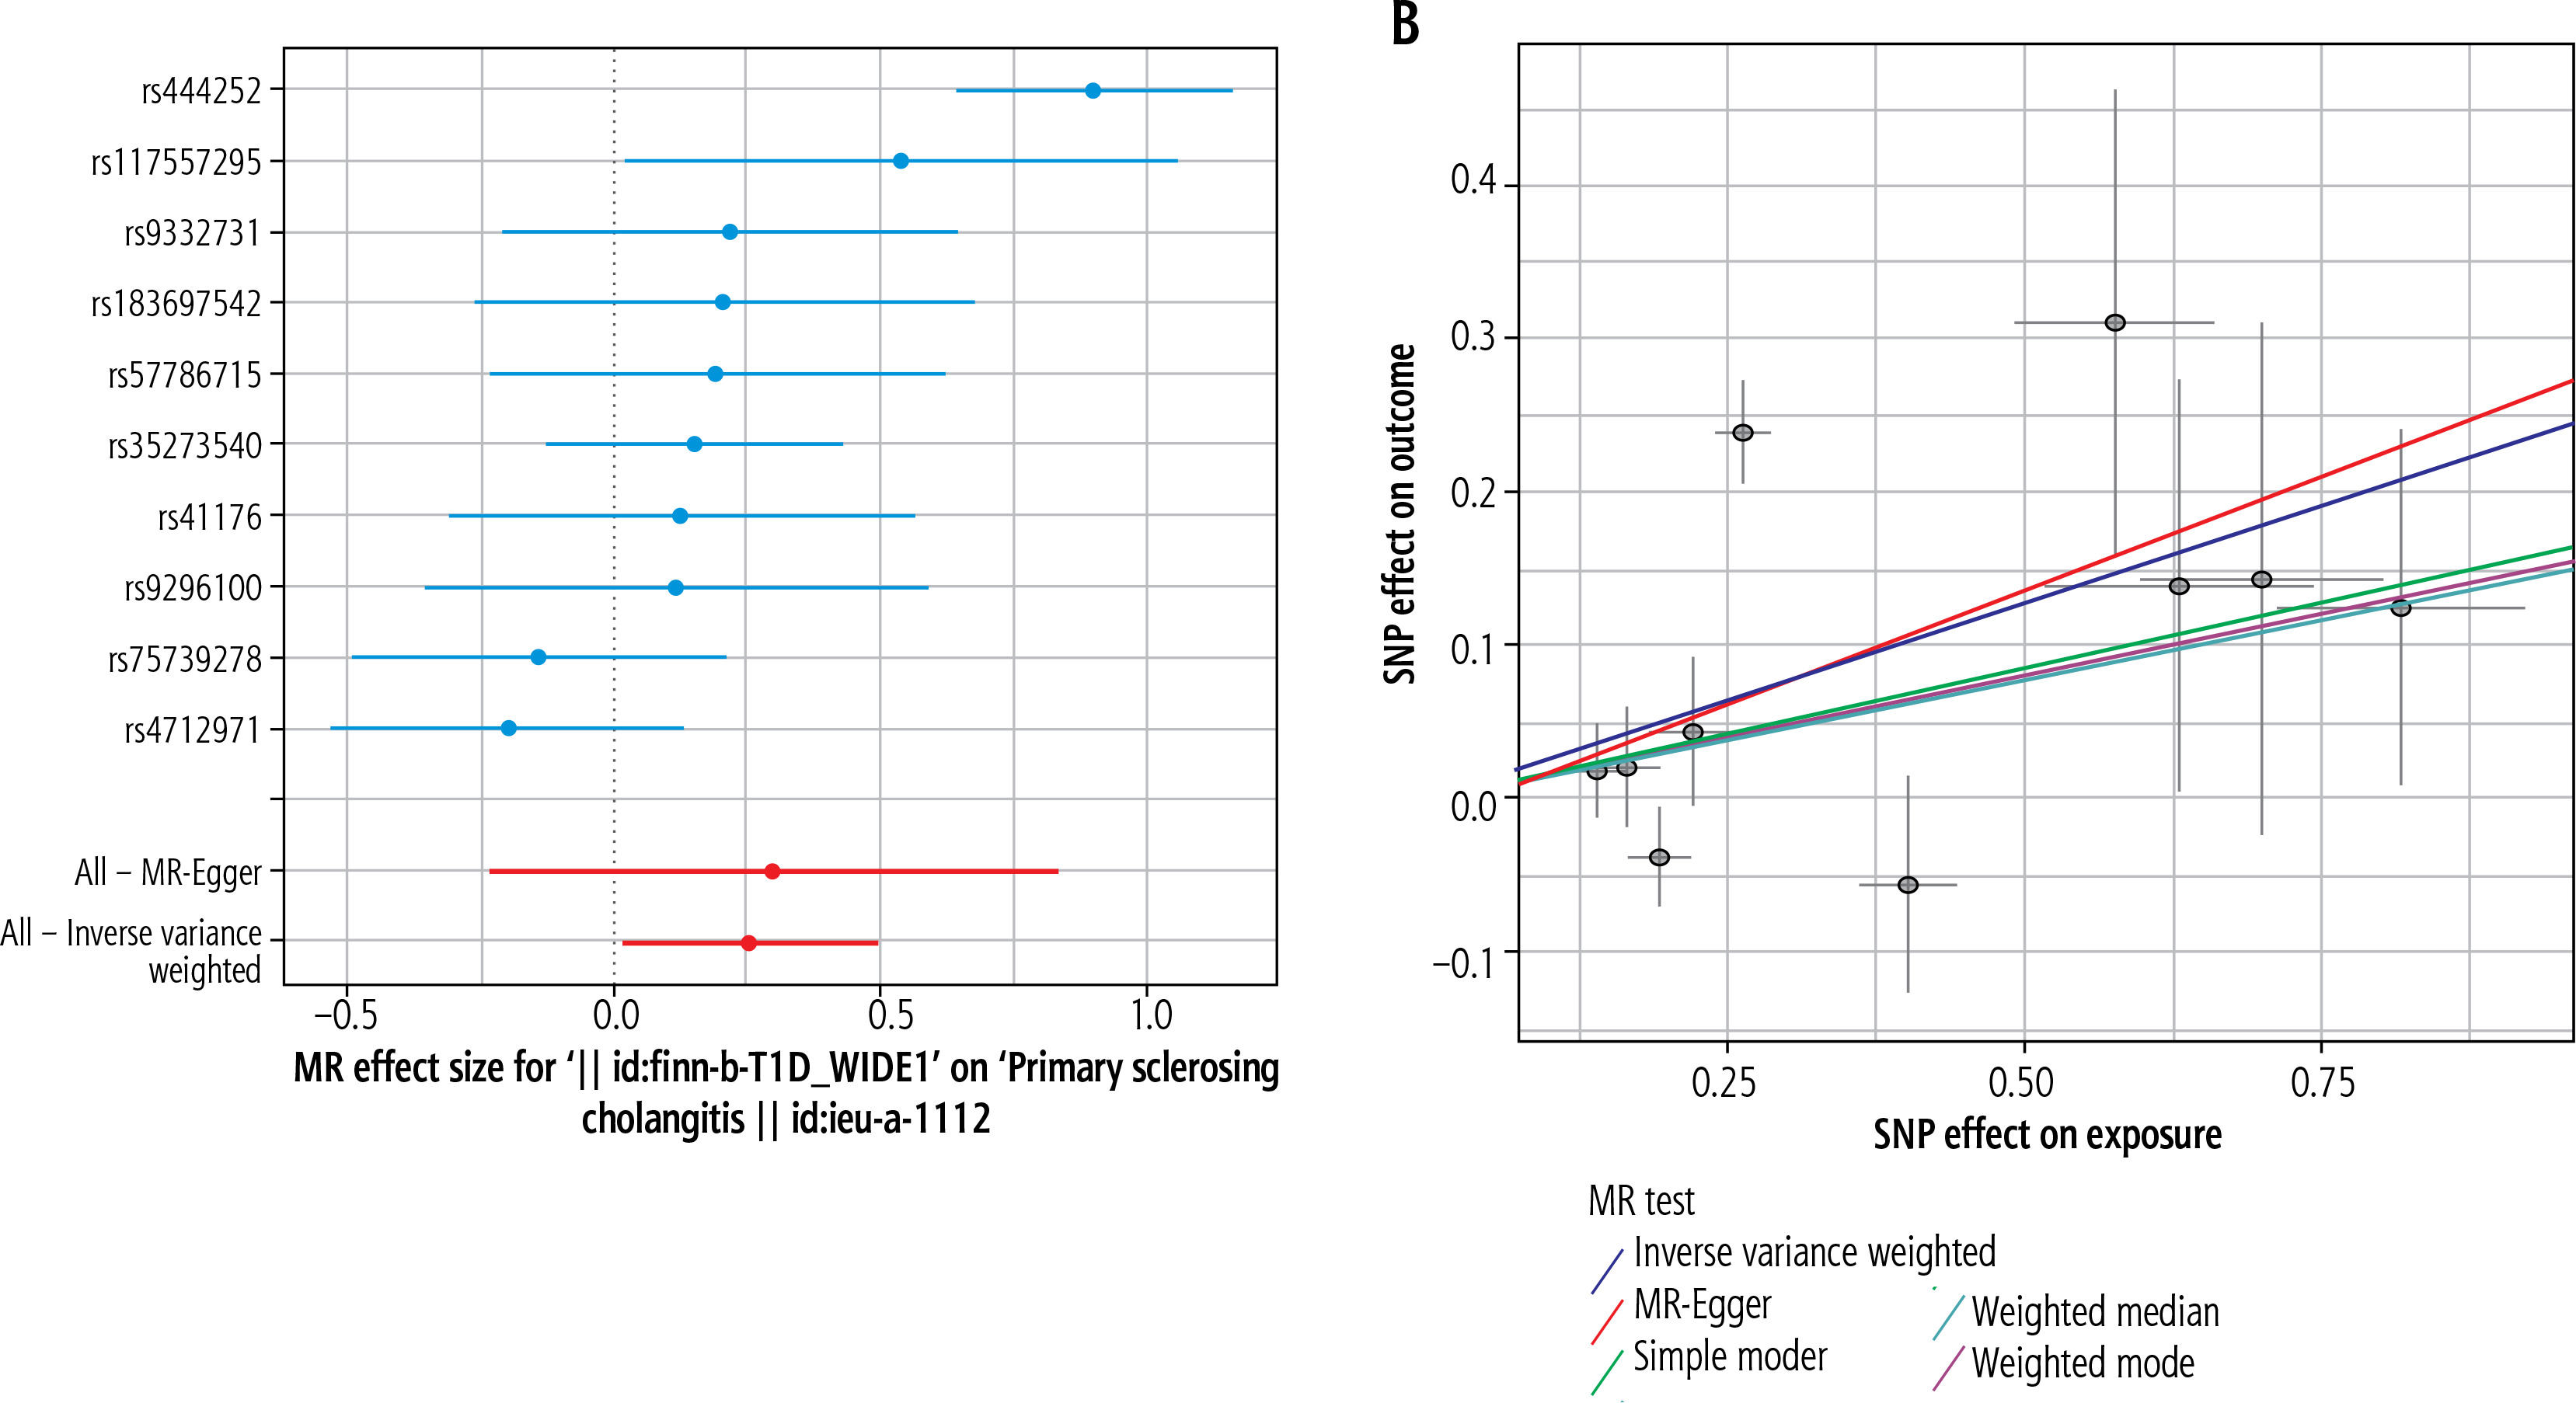
To further validate the causal association between T1DM and PSC, 10 eligible SNPs were utilized as IVs (Supplementary Table 3). IVW analysis revealed that T1DM might elevate the risk of PSC (OR = 1.291, 95% CI: 1.016-1.642, p = 0.037) (Fig. 4A, Table 2). Additionally, MR-Egger (OR = 1.348, 95% CI: 0.791-2.295, p = 0.303) and weighted median (OR = 1.171, 95% CI: 0.976-1.405, p = 0.089) analyses corroborated this finding (Table 2). Sensitivity analysis employing the leave-one-out method further validated the reliability of the MR results (Supplementary Figure1C). Subsequent MR-Egger regression analysis also indicated no significant directional pleiotropy between T1DM and PSC (intercept = 0.012, p = 0.862) (Fig. 4B, Table 2).
Fig. 4
Plots of Mendelian randomization (MR) estimates of the causal relationship between type 1 diabetes mellitus (T1DM) and autoimmune liver diseases (AILDS). The log odds ratio of risk is demonstrated, and five different methods – inverse variance weighted (WW) approach, MR-Egger, weighted median, weighted mode, and simple mode – were used. A) Forest plot of single nucleotide polymorphisms (SNPs) associated with T1DM and risk of primary sclerosing cholangitis (PSC). B) Scatter plot of SNPs associated with T1DM and risk of PSC. C) Forest plot of SNPs associated with primary biliary cholangitis (PBC) and risk of T1DM. D) Scatter plot of SNPs associated with PBC and risk of T1DM
Impact of AILDs on T1DM
Similarly, we examined the causal effect of AILDs on T1DM, with AILDs as the exposure and T1DM as the outcome. Detailed information regarding the included SNPs is provided in Supplementary Table 4. Summary data obtained from IVW analysis indicated that the presence of PBC also increased the risk of T1DM (OR = 1.236, 95% CI: 1.085-1.407, p = 0.001) (Fig. 4C, Table 2). MR-Egger (OR = 1.336, 95% CI: 1.012-1.464, p = 0.043) and weighted median (OR = 1.036, 95% CI: 0.984-1.092, p = 0.179) tests also confirmed the conclusion (Table 2). Sensitivity analysis conducted using the leave-one-out method further demonstrated the reliability of reverse MR results (Supplementary Figure 1D). Horizontal pleiotropy between IVs and outcomes was assessed through MR-Egger regression, which showed no evidence of a significant intercept (intercept = 0.017, p = 0.535) (Fig. 4D, Table 2).
However, there is no evidence supporting the causal relationship between AIH and T1DM (OR = 1.032, 95% CI: 0.983-1.084, p = 0.207) (Supplementary Figure 2A) or between PSC and T1DM (OR = 0.989, 95% CI: 0.849-1.152, p = 0.888) (Supplementary Figure 2C). MR-Egger regression was used to assess pleiotropy, and the results showed that the presence of horizontal pleiotropy was unlikely to deviate from the causal relationship between AIH and T1DM (intercept = 0.004, p = 0.841) (Supplementary Figure 2B) and between PSC and T1DM (intercept = 0.067, p = 0.117) (Supplementary Figure 2D). Finally, single SNP analysis and leave-one-out analysis showed that no individual genetic variant had an impact on the overall results (Supplementary Figure 3A,B). In conclusion, there is no evidence to suggest that the increased risk of AIH and PSC is causally related to the change in T1DM risk.
Discussion
We conducted a bidirectional two-sample MR study using the most comprehensive available GWAS data to overcome a common limitation in epidemiological research. This may provide important insights into the genetic correlation between T1DM and AILDs. Our results highlight the causal impact of T1DM as a specific autoimmune disease on the risk of three subtypes of AILDs.
To our knowledge, this is the first study to demonstrate the causal relationship between T1DM and AILDs using MR analysis and large-scale GWAS datasets. Our study found that T1DM has a positive causal effect on the risk of AIH, PBC, and PSC, suggesting that T1DM itself plays a causal role in the pathogenesis of AILDs. However, in the opposite direction of the relationship between AILDs and T1DM, only PBC has a positive causal effect on the risk of T1DM, while AIH and PSC do not have a causal effect on T1DM.
Existing studies have shown that the prevalence of concomitant AILDs in T1DM increased by 0.1% compared to the global prevalence of T1DM in 2021 [31]. Furthermore, there is a growing trend in the proportion of concurrent T1DM and AILDs in some European countries. A report from Germany showed that among 278 AIH patients, 2 cases (0.7%) were found to have T1DM [32]. A study on the prevalence of liver function test abnormalities and other autoimmune diseases in T1DM patients concluded that hepatomegaly and elevated liver enzyme levels in type 1 diabetes patients can be caused by viral hepatitis, autoimmune hepatitis, or metabolic liver diseases [33]. An epidemiological article covering 15 countries pointed out that high-risk populations for AILDs include T1DM patients, and it suggested routine screening for autoimmune-related diseases in T1DM patients [34].
Current research indicates a close relationship between both conditions and autoimmune and genetic factors. By uncovering the causal relationship between these diseases, this study contributes to advancing prior research. A retrospective study with 168 Asian T1DM patients demonstrated a 60% higher likelihood of PBC cirrhosis among diabetic patients compared to the control group [35]. A 20-year study on AIH highlighted associations between T1DM, Addison’s disease, autoimmune thyroiditis, hypoparathyroidism, and pediatric autoimmune hepatitis [36]. Currently, the pathophysiological mechanisms of T1DM leading to AILDs remain incompletely understood. However, recent genetic studies suggest the haplotype DRB103-DQA105:01-DQB1*02:01 as a potential risk factor for T1DM development in both Caucasian and Asian populations. Additionally, this haplotype has been associated with an elevated risk of PSC in the Norwegian population [37, 38]. From an autoimmune standpoint, researchers such as F. Susan Wong have observed the concurrent presence of autoreactive T cells and autoantibody-producing B cells in both T1DM and AILDs [39]. Additionally, numerous significant risk loci associated with PBC and PSC overlap with those linked to autoimmune disorders like type 1 diabetes, multiple sclerosis, and rheumatoid arthritis. This suggests common genetic underpinnings and potentially similar molecular pathways across diverse autoimmune conditions [40].
This study employed a genetic approach utilizing large-scale GWAS summary statistics. The substantial sample size enhanced our statistical power to identify causal relationships, marking it as the inaugural comprehensive investigation revealing the bidirectional causal link between T1DM and AILDs. Moreover, the conclusive determination of whether T1DM elevates the risk of AILDs cannot solely rely on observational studies. The Mendelian randomization (MR) method, a recent innovation in epidemiology, offers notable benefits. Firstly, genetic variations arise independently of lifestyle and social factors, thus reducing confounding effects; secondly, genetic variations precede exposures and outcomes, preventing reverse causality; moreover, MR utilizes public databases, reducing research expenses and time. Nonetheless, this study faces limitations. The constraints of MR analysis hinder precise acquisition of the second and third hypotheses, possibly introducing biases. Consequently, we employed MR-Egger analysis to detect horizontal pleiotropy. Moreover, our data originate from multiple large-scale GWAS. The absence of specific demographic details and clinical symptoms precluded stratified analyses by age, gender, medical history, etc. [41]. Furthermore, this study utilized a restricted number of SNPs as instrumental variables, explaining only a small fraction of variance, possibly lacking adequate power to detect the relationship between T1DM and AILDs. Finally, MR analysis offers directionality for the etiology of T1DM and AILDs, yet lacks elucidation of the underlying biological mechanisms. Subsequent experimental investigations are imperative to validate these findings.
We conducted the inaugural investigation into the association between T1DM and AILDs, revealing that T1DM elevates the risk of AIH, PBC, and PSC. Subsequent longitudinal studies and clinical trials are imperative to corroborate these findings and improve the diagnosis and prevention of concurrent AILDs in T1DM patients.


