
Introduction
Menopause is an integral part of the life of every woman resulting from the physiological process of aging of the body. It is considered as a transitional period between being an entity with reproductive capabilities and a period when this activity ceases [1-3]. This period triggers a series of unpleasant long-term and short-term symptoms among women [4]. The main changes taking place in the female body at this time include a change of the hormonal profile that affects the psyche and functioning of the female organism [1,2, 5,6]. A decrease of the estrogen level in a post-menopausal female body is related to the suppression of ovarian function during this period [6-8]. Too low amount of this hormone contributes to sleep disorders (interrupted sleep, unstable sleep) and frequent night sweats. In consequence, it may result in excessive fatigue, irritability, poor concentration and focusing ability during the day [1, 5-7, 9]. Research suggests that obese women have an increased predisposition to the occurrence of negative menopause symptoms [7]. Moreover, the estrogen deficiency within this period is related to a tendency of different accumulation of adipose tissue in the organism, favoring an increase of the visceral adipose tissue, unlike in the case of pre-menopausal women – when the adipose tissue accumulates mainly in the hips, subcutaneously [3, 10, 11].
Another noticeable change during the post-menopausal period is a modification of nutritional behaviors [3]. The estrogen deficiency entails not only an increased appetite but also a much harder metabolization of certain nutrients because oestradiol inhibits the activity of lipoprotein lipase in the organism. It was stated that among pre-menopausal women, the level of estrogens is directly proportional to the level of leptin known as the “satiety hormone”. Furthermore, it was stated that estrogens increase the organism’s sensitivity to leptin, and this relationship changes during the perimenopausal period [12]. Research also shows that an increase of leptin concentration after menopause contributes to negative changes in nutritional behaviors, indirectly leading to the android-type obesity [3, 11, 13]. Moreover, we can observe an increase of the galanin level at the expense of neuropeptide Y (NPY), which results in preferring a fat-rich diet [13]. The research carried out among post-menopausal women showed that their daily food rations are characterized by a low intake of fiber, calcium, vitamin D and vegetable fats, whereas an excessive intake is usually stated in the case of animal protein, simple carbohydrates, saturated fats, cholesterol, sodium, phosphorus, zinc, copper, and vitamin A [3, 11, 14].
The above-mentioned observations were a basis for undertaking the present study, whose aim was to study the frequency of the consumption of specific foodstuffs by post-menopausal women. Additionally, the influence of nutritional behaviors on the occurrence of obesity in the studied group of women was assessed.
Material and methods
The research was carried out among 103 post-menopausal women at the age of 60.1 ±9.0 years in the western part of Poland from January to July 2016. To protect research integrity, simple random sampling (dependant) was used to select the sample randomly. Anthropometric measurements were performed in the studied group of women (body mass and height, waist and hip circumference), and a short survey prepared by the authors concerning the socio-economic data and lifestyle of the studied group of women was carried out. To evaluate overweight and obesity in the studied group of women the body mass index (BMI) and waist-to-hip ratio (WHR) were calculated. The validated Food Frequency Questionnaire – FFQ-D10 was used to assess the nutritional behaviors of women through the determination of the frequency of consumption of foodstuffs [15 – Supplementary Material 1]. The women were asked to indicate the frequency of consumption of specific foodstuffs within the last 12 months, choosing one of the following options: never, once a month or less often, 2-3 times per month, 1-2 times per week, 3-4 times per week, 5-6 times per week, once a day,2-3 times a day, 4-5 times a day, at least six times a day. The obtained results, according to the category of consumption frequency, were converted to a daily frequency indicating how many portions of a specific product were consumed by a woman taking part in the study within one day. To facilitate the analysis of the obtained results, the foodstuffs were divided into 25 groups for which the number of portions consumed within 24 hours was assessed. The analyzed groups of foodstuffs were the following: milk and milk drinks, quarks and flavored cottage cheeses; cheeses; eggs and egg dishes; sweets; salty snacks; whole wheat products (unrefined); refined cereal products; ready-made cereal breakfast products; oil; butter, cream and sour cream; margarine, mayonnaise and dressings; other animal fats; fresh and dried fruits; processed fruits and candied fruits; vegetables; legume plant seeds; potatoes; nuts and grains; sausages and cold meats; fish, fruit and vegetable juices; sweetened carbonated beverages; alcoholic beverages.
The study did not require the consent of the Poznan University of Medical Sciences Bioethical Committee bioethics committee because it included surveys using standardized questionnaires – according to their intended use, and surveys were conducted with statistically selected questionnaires. Each of the women was informed about the purpose of the research and its voluntary nature, and the consent to participate in the study was confirmed by the signature on the “Consent statement”.
The obtained results were subjected to statistical analysis using the statistical software Statistica, version 12 (StatSoft Polska, Kraków, Poland). Basic descriptive statistics were used for the initial analysis. During the analysis of variables obtained in foodstuff consumption frequency assessment, multi-dimensional logistic regression models were built to correct the impact of particular factors on the risk of occurrence of overweight and obesity in the studied group of women.
Results
The analysis of the socio-economic situation of the studied group of women indicated that 66% of those surveyed were inhabitants of big cities (over 100 thousand inhabitants), 20% of them were inhabitants of small towns (up to 50 thousand inhabitants), whereas the least representative group included women living in rural areas (10%) and women from medium-sized towns (4%). Furthermore, it was found that 61% of women participating in the survey had a tertiary education, 31% had a secondary education, 5% had a vocational education and only 3% of women had an elementary education. The analysis of professional activity indicated that the majority of these women were white-collar workers (58%), 16% were physical workers, whereas 22% of them were already retired and 4% on a disability pension. Taking into account the selected parameters of lifestyle and nutritional habits of the studied group of post-menopausal women showed that the majority of those interviewed were characterized by an active lifestyle and did not smoke cigarettes.
This research showed that 68% of the studied women reported no change in nutritional preferences and nutritional behavior (64%) during the post-menopausal period; however, almost 75% of surveyed women had noticed a body weight change. In the studied group of women, the time of weight change or waist circumference was also checked. The results showed that 45% of surveyed women indicated that changes were observed in the last 5 years and 48% in 5-10 years. Only 7% of women reported over 15 years. Among the women who had observed a change in nutritional preferences, as many as 61% were overweight and 12% had obesity of the 1st degree. Overweight women also dominated among those who had observed a change in body weight (59%). The further analysis of results concerning the number of consumed meals indicated that 69% of women participating in the study consumed 3-4 meals per day; however, almost a half of those interviewed admitted that they were not concerned about their regularity. Women who indicated changes in dietary preferences or nutrition (32% and 36%) did not report significant differences in the size of the meal or the frequency of consumption of food products.
Anthropometric characteristics of the studied group of women are presented in Table 1. Data concerning body height and weight measurements served to calculate the BMI, for which the average value was 26.2 ±3.15 kg/m2. The analysis of the distribution of the BMI values in the studied group of women showed that the majority of women (66%) had a BMI exceeding the value of 24.9 kg/m2. It was stated that in the studied group of women, the majority were overweight and about 10% had obesity of the 1st degree. Those women whose BMI was within the appropriate values constituted a smaller group (33%). It is important to note that a small percentage of underweight women – 1% – was also observed in the studied group of women. The WHR was determined by the waist and hip circumference measurements in the studied group of women with overweight and obesity (66%). Its average value was 0.83 ±0.07. The analysis of the distribution of this ratio revealed that a large percentage of subjects (41%) were characterized by the android distribution of adipose tissue.
Table 1
Anthropometric characteristics of the studied group of post-menopausal women (n = 103)
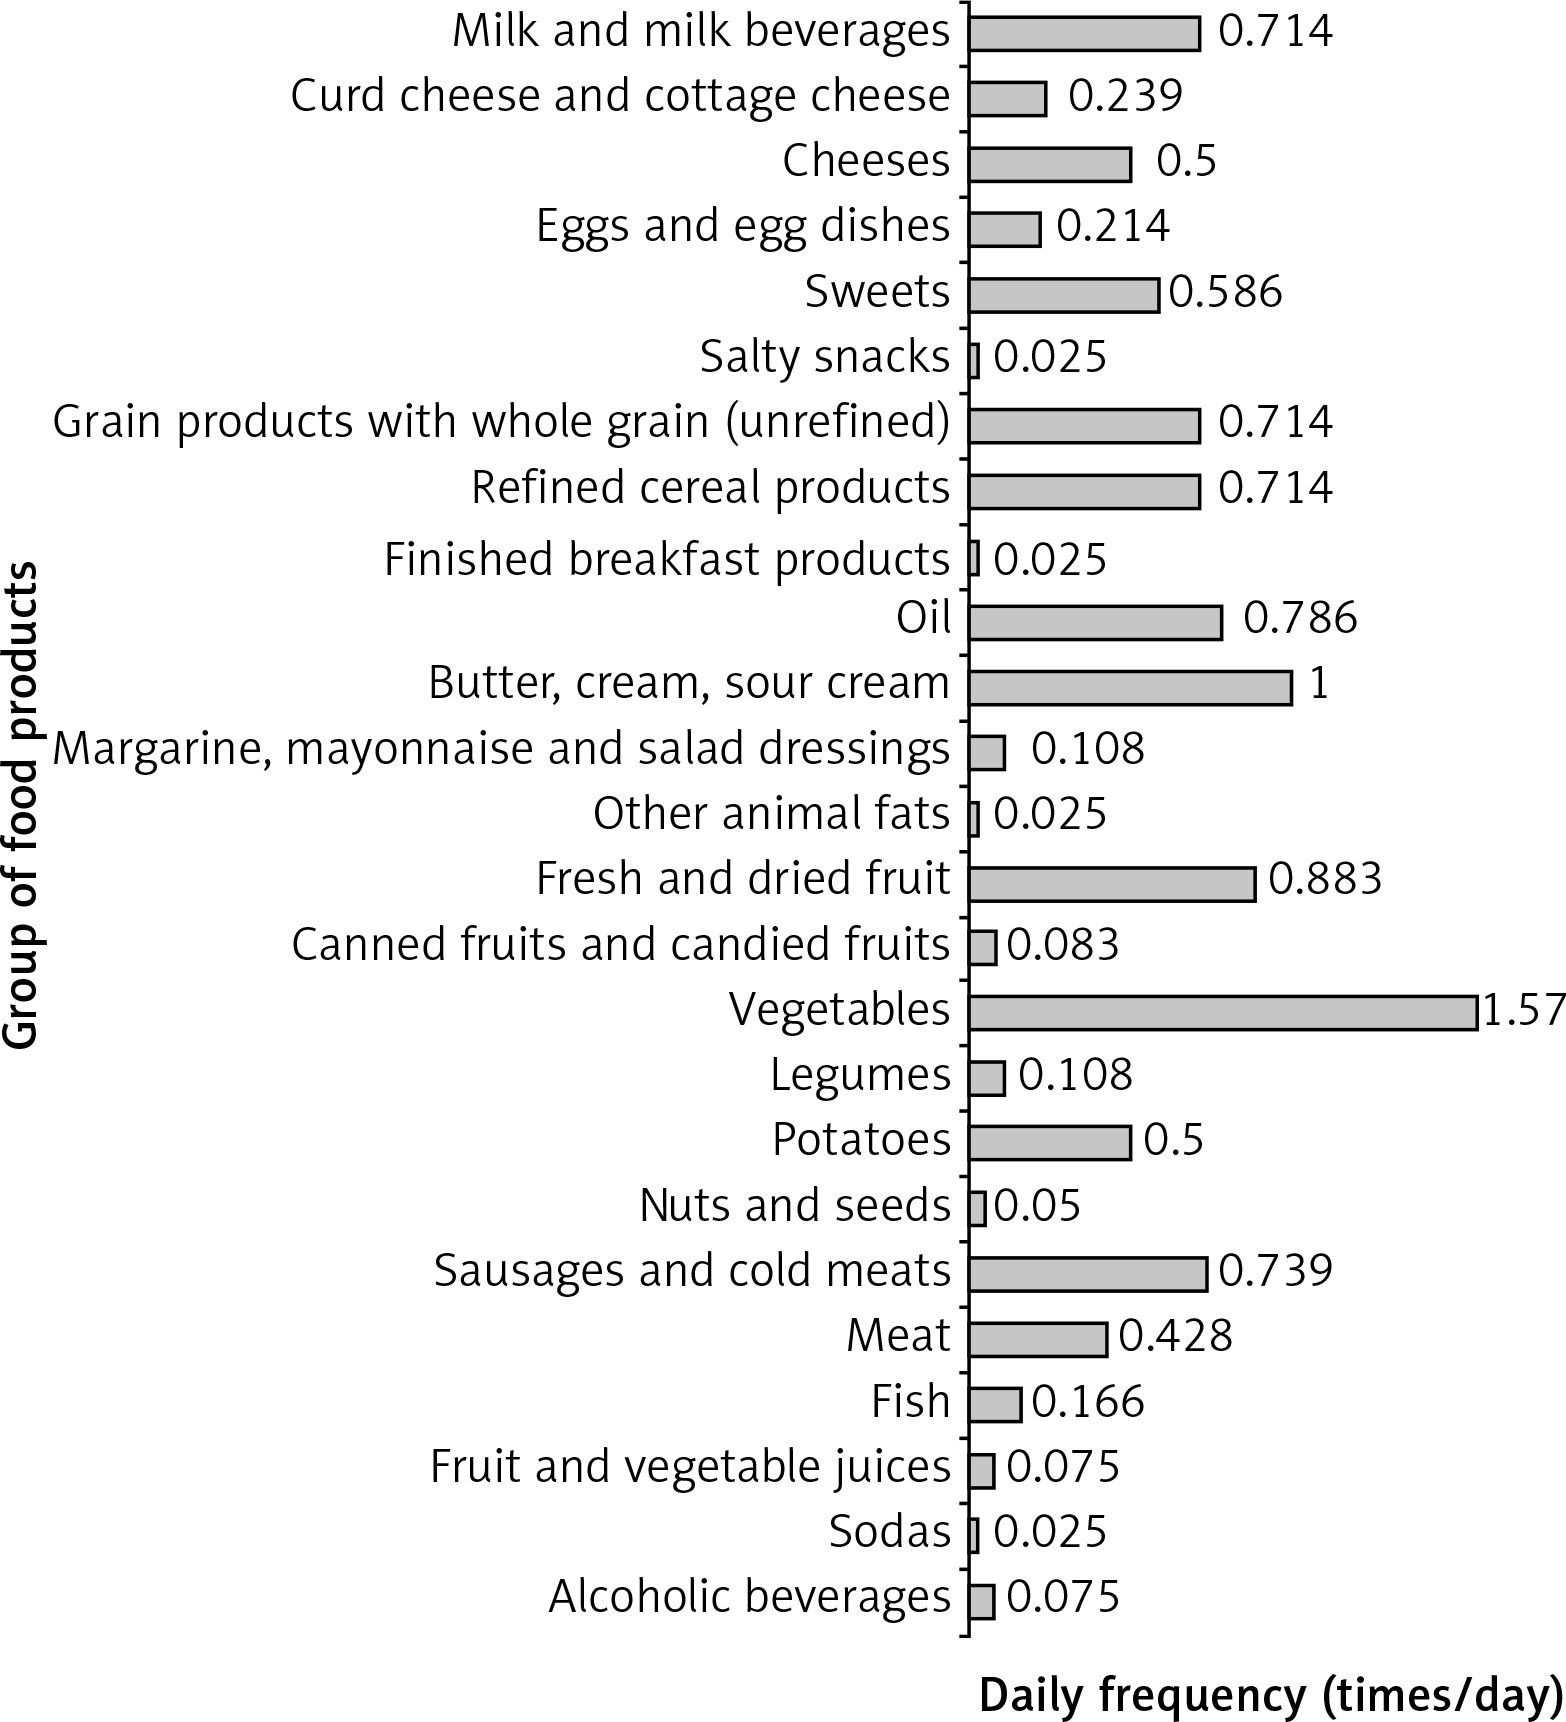
The results of the assessment of nutritional behaviors of the studied group of women carried out by an FFQ-D10 questionnaire concerning the frequency of consumption of particular groups of food are presented in Figure 1. The groups of foodstuffs that were consumed most frequently and in the highest amounts included: high-energy products such as butter, cream, sour cream, oil, sausages, and cold meats; cereal products, both refined and unrefined: milk and milk drinks; sweets; potatoes and meat. The consumption of vegetables amounted to 1.57 portions per 24 hours. A tendency to choose products that are cheap and easily accessible in Polish shops, not necessarily taking into consideration their nutritional value or advantageous impact on health, was observed among the women who took part in the study. The obtained results concerning the daily frequency of consumption showed that the group of products that were the least consumed by post-menopausal women included sweetened carbonated beverages, other animal fats (lard or fatback), ready-made breakfast products and salty snacks. Consumption of these foodstuffs was at the level of 0.025 of a portion per day. Other products consumed sporadically and in small amounts were nuts and grains (0.05 of a portion per 24 hours), alcoholic beverages (0.075 of a portion per 24 hours) and fruit and vegetable juices (0.075 of a portion per 24 hours). Further analysis of the nutritional behaviors of the participating women revealed that the majority of them stated that they never consume energy drinks or foodstuffs with sugar substitutes. Furthermore, alarmingly low consumption of fruits (only 0.883 of a portion per 24 hours) and of legume plant seeds (0.108 of a portion per 24 hours) was observed.
Fig. 1
Daily amount of consumed portions of different foodstuffs among the post-menopausal women who took part in the study
The obtained results also enabled an assessment of the influence of nutritional behaviors on the occurrence of obesity among women who took part in the study. The multi-dimensional logistic regression models were built to correct the impact of particular factors on the risk of occurrence of becoming overweight and obese in the studied group of women. The obtained results are presented in Table 2. The adjusted regression model concerning food consumption frequency, unlike the raw one, was adjusted by the influence of factors that could additionally falsify the obtained results and upon which the development of overweight or obesity could depend in the studied group of women. These factors included: age, place of residence, education, profession, subjective health condition, lifestyle, post-menopausal period, application of hormone replacement therapy and cigarette smoking. While analyzing the influence of the frequency of consumption of particular products or groups of products, their actual impact on the increase of the risk of developing overweight and obesity was not stated. The frequency of food consumption in the raw regression model did not reveal a statistically significant association with development of overweight and obesity (OR [95% CI], p > 0.05). After taking into consideration all additional parameters that could influence the original results, these values remained statistically insignificant (OR [95% CI], p > 0.05).
Table 2
Influence of frequency of consumption of foodstuffs and risk of development of overweight and obesity in the group of post-menopausal women in the raw and adjusted logistic regression model
| Variable | Raw model | Adjusted model* | ||
|---|---|---|---|---|
| OR (95% CI) | p-value | OR (95% CI) | p-value | |
| Milk and milk beverages | 0.82 (0.57; 1.2) | 0.31 | 0.99 (0.61; 1.59) | 0.95 |
| Curd cheese and cottage cheese | 0.84 (0.58; 1.23) | 0.37 | 0.88 (0.59; 1.32) | 0.54 |
| Cheeses | 1.03 (0.69; 1.52) | 0.89 | 1.01 (0.66; 1.55) | 0.96 |
| Eggs and egg dishes | 1.24 (0.47; 3.26) | 0.67 | 1.34 (0.4; 4.49) | 0.64 |
| Sweets | 0.81 (0.64; 1.02) | 0.08 | 0.79 (0.61; 1.03) | 0.08 |
| Salty snacks | 0.01 (0; 14.98) | 0.22 | 0 (0; 5.34) | 0.12 |
| Grain products with whole grain (unrefined) | 1.03 (0.77; 1.37) | 0.85 | 1.15 (0.8; 1.65) | 0.44 |
| Refined cereal products | 1.15 (0.84; 1.58) | 0.39 | 1.11 (0.78; 1.6) | 0.56 |
| Finished breakfast products | 0.73 (0.2; 2.66) | 0.64 | 0.91 (0.19; 4.36) | 0.91 |
| Oil | 1.44 (0.75; 2.77) | 0.27 | 1.93 (0.84; 4.46) | 0.12 |
| Butter, cream, sour cream | 1.03 (0.8; 1.33) | 0.79 | 1.08 (0.82; 1.43) | 0.58 |
| Margarine, mayonnaise and salad dressings | 0.67 (0.42; 1.09) | 0.11 | 0.66 (0.37; 1.17) | 0.15 |
| Other animal fats | 52.49 (0.1; NA) | 0.21 | 37.87 (0.02; NA) | 0.36 |
| Fresh and dried fruit | 0.93 (0.8; 1.09) | 0.36 | 1.01 (0.84; 1.22) | 0.92 |
| Canned fruits and candied fruits | 0.75 (0.26; 2.14) | 0.59 | 0.88 (0.26; 3.03) | 0.84 |
| Vegetables | 0.94 (0.84; 1.06) | 0.31 | 0.99 (0.88; 1.11) | 0.82 |
| Legumes | 0.75 (0.24; 2.37) | 0.63 | 1.63 (0.39; 6.75) | 0.50 |
| Potatoes | 2.06 (0.79; 5.36) | 0.14 | 2.39 (0.81; 7.02) | 0.11 |
| Nuts and seeds | 0.74 (0.32; 1.72) | 0.48 | 1.25 (0.47; 3.35) | 0.66 |
| Sausages and cold meats | 1.14 (0.86; 1.52) | 0.36 | 1.19 (0.86; 1.65) | 0.29 |
| Meat | 0.81 (0.54; 1.21) | 0.30 | 0.83 (0.52; 1.32) | 0.44 |
| Fish | 0.49 (0.13; 1.82) | 0.29 | 0.78 (0.18; 3.3) | 0.73 |
| Fruit and vegetable juices | 0.70 (0.47; 1.05) | 0.08 | 0.66 (0.41; 1.08) | 0.10 |
| Sodas | 1.42 (0.05; 39.65) | 0.83 | 0.73 (0.01; 36.34) | 0.88 |
| Alcoholic beverages | 0.72 (0.24; 2.14) | 0.55 | 0.84 (0.25; 2.79) | 0.77 |
Discussion
The analysis of the place of living and education in the studied group of women showed that most likely this educational distribution results from the fact that the majority of women taking part in the study live in big cities. There is a statistically proven, clear difference between the educational backgrounds of people in big cities and rural areas [6]. Taking into account the level of professional activity in the studied group of women and meta-analysis of the research concerning the influence of socio-economic position and lifestyle on the occurrence of menopause conducted by Australian researchers proved that a higher degree of education and better professional position delay the occurrence of the first negative symptoms of menopause [16]. In this study, the majority of women were characterized by an active lifestyle and did not smoke cigarettes. Research carried out by other authors has demonstrated that the intensity of physical efforts undertaken by women significantly decreases with age, especially after menopause [3, 6, 7, 9, 17]. However, as shown in the research of other authors [5-7, 18], physical activity during the perimenopausal and post-menopausal period mitigates the negative symptoms of menopause. The authors of Brazilian research [5] confirmed the relationship between the level of physical activity and a number of reported menopause symptoms according to the Blatt-Kupperman Menopausal Index, such as vasomotor symptoms, insomnia, paresthesias, nervousness, melancholia, dizziness, weakness, joint pain, muscle pain and headaches, palpitations or tinnitus. The women, along with a higher level of physical activity, reported a decreasing number of menopause symptoms [5]. Research from Chile reached similar conclusions [16].
Analysis in the studied group of women showed that nutritional preferences and nutritional behavior in 50% of them had no change. However, 75% of studied women had higher body mass than before the postmenopausal period. The predominance of overweight in the studied women probably resulted from the fact that the post-menopausal change of body weight in most cases may lead to becoming overweight among women undergoing it. Furthermore, the menopausal period triggered an observable change in their well-being, which may be a result of a combination of emotional problems with somatic symptoms [19]. According to the research of Czarnecka-Iwańczuk et al. [19] carried out on a group of women at the age of 45 to 58 years, the age of women correlated negatively with their well-being after the climacteric. Women with poorer well-being declared a higher intensity of negative menopause symptoms [19]. From other authors’ research, it can be concluded that a higher tendency to regular frequency of consumption of daily meals can be observed among those over 60 years of age [20].
Anthropometric characteristics of the studied group of women showed that the majority of women had a value of BMI exceeding 24.9 kg/m2, which, according to the adopted standards, is considered as the upper limit of the proper values. A similar distribution of BMI among the Polish population was observed in the research of Dąbrowska et al. [6], whereas Jull et al. [7] observed a similar tendency among the population of Canadian women. Taking into account the WHR, it is assumed that at least 58% of the population of Polish women have the WHR exceeding the limit of 0.85, which signifies more frequent occurrence of android-type (abdominal) obesity. Australian research revealed that the frequency of occurrence of abdominal obesity among women is almost twice as high as that of general obesity [10]. Research has also shown that the highest percentage of women with excessive adipose tissue within the abdominal cavity can be found in the group of women who are undergoing or have undergone menopause [12, 13, 21].
The results on frequency of consumption of particular groups of food showed a positive trend, although still insufficient, for the consumption of vegetables. Modern nutritional pyramids suggest consuming at least five portions of vegetables and fruits per day [7, 22]. However, this recommendation was not respected by the women who took part in the study. Further analysis concerning the consumption of meat and fish reflected the results of other authors. The research illustrates that the consumption of meat by women was the highest within the postmenopausal period, especially in relation to young women [20], whereas other authors’ research confirmed low consumption of fish, especially sea fish, which leads to an incorrect ratio between omega-6 and omega-3 acids in their diet and may increase the risk of total and coronary heart disease death [23]. Different results concerning the frequency of consumption of particular groups of foodstuffs were observed by Pot et al. [24] when researching trends in the consumption of food among British people. In 30-year long observations, the authors demonstrated that the frequency of consumption of white bread, whole cream milk, different kinds of fats and oils, meats and meat products, alcoholic beverages, sugar, coffee, and confectionery products decreases with age among the British population (p < 0.001).
An increase in the consumption of whole wheat bread and whole grain bread, semi-skimmed milk, fish, fruits, and vegetables should be listed among the positive changes which were observed by the present authors (p < 0.001) [24]. In this study the women consumed nuts and grains sporadically and in small amounts, although research shows that seeds (e.g., sunflower, pumpkin) are very important during the post-menopausal period, constituting not only a perfect source of unsaturated fatty acids but also having a positive impact on the functioning of the central nervous system, including protection against neurodegenerative diseases occurring with age [22, 23]. Also, low consumption of legume plant seeds was observed in the study group of women; containing phytoestrogens, they are very advisable in the diet of women within this period [22, 25, 26]. The research of other authors has shown that post-menopausal women should follow an adequate-protein, high-fat and low-carbohydrate diet with reduced energy intake [7, 22, 27]. Appropriate intake of vegetables and fruits, sources of EFA (essential fatty acids) and fiber is also very important [22, 27]. Unfortunately, the research results show that the diet of women at this age is often characterized by excessive intake of protein and animal fats, a general imbalance and an insufficient amount of energy derived from carbohydrates. In light of the above, it is also suggested that post-menopausal women consume too little vitamin A and C and fiber [3, 22, 28]. This study confirms the above-mentioned hypothesis – saturated fats (derived mainly from butter, cream, yellow cheese, and pork) and animal protein dominated in the diet of these women. The studied group of women was also characterized by low consumption of vegetables and fruits, which may lead to vitamin deficiencies. It can be concluded that the diversity of consumed products decreases diametrically over the years. The results of other authors suggest that in the post-menopausal period, as well as after retirement, all-day food rations are neither varied nor composed according to general health recommendations. It may increase issues with body weight and predispose one to become overweight and obese within this period of life [11, 28-30]. Furthermore, research suggests that the nutritional value of meals consumed by older adults is much worse than that of meals consumed by women at a younger age [30].
In the multi-dimensional logistic regression models, both raw and adjusted, the research did not prove that an increase of the frequency of food consumption during the post-menopausal period was related to the risk of occurrence of becoming overweight and obese in the study group of women. The analysis based on the multi-dimensional logistic regression models allowed us to conclude that the occurrence of becoming overweight or obese among women taking part in the study could be related to their place of residence and professional activity (work/retirement). The results of the research indicate that the highest percentage of overweight women lived in big cities with some inhabitants exceeding 100 thousand. It may result from the fact of a different lifestyle in big cities, easier access to unhealthy, high-energy food and the lack of time for a healthy meal, usually consumed irregularly. Taking into consideration the group of working women, the white-collar employees dominated among the overweight women (34% of the entire studied group), probably because of a sedentary lifestyle related to their work. It was also found that another dominating group among the overweight women – apart from the white-collar employees – was that of retired women (13% of the group), meaning women who are no longer professionally active. These results are also confirmed by research carried out by foreign authors [18]. Blümel et al. [18], using logistic regression analysis, showed the existence of an additional correlation between occurrence of obesity and intensity of menopause symptoms in the population of Latin American women and their sedentary lifestyle.
Considering all the factors that may affect the development of obesity in menopausal women, it should be remembered that nutrition is also important. Nutritional recommendations in this period of life indicate that a low-energy and low-carbohydrate diet should be used. Particular attention should be paid to the quality of carbohydrates and fats, by limiting the consumption of simple carbohydrates and saturated fatty acids [31, 32]. The diet reducing body mass should take into account the current state of health of each patient.
Some limitations and problems with the current study should be noted. First, the study took a long time, and some of the women were tired of the survey. Second, the study was conducted only in the west part of Poland. Nevertheless, the FFQ-D10 questionnaire was reported to be suitable for use in collecting large-scale data for an adult population.
Conclusions
The studied women declared no change in nutritional preferences and behavior during the post-menopausal period, but 75% of surveyed women noticed a body weight change.
The analyses of the Food Frequency Questionnaire FFQ-D10 revealed that the groups of food products that were consumed most frequently and in the highest amounts, chosen by the post-menopausal women taking part in the study, were the following: vegetables, high-energy products (butter, cream, sour cream, oil); fresh and dried fruits, sausages and cold meats; refined and unrefined cereal products; milk and milk drinks; sweets; potatoes; cheeses and meat.
It could be concluded by multi-dimensional logistic regression models that the development of overweight and obesity among post-menopausal women taking part in the study probably did not depend on the frequency of consumption of foodstuffs; however, the place of residence and professional activity could be significant.