
Introduction
With an increasing incidence rate, hepatocellular carcinoma (HCC) is considered as a major worldwide medical issue. By 2050, more than a million new cases of HCC are forecasted to be discovered yearly [1]. Hepatitis C virus (HCV) or hepatitis B virus (HBV) infections, alcohol use, aflatoxin exposure, nonalcoholic steatohepatitis, and metabolic disorders are among the risk factors associated with HCC [2]. About 80% of cases are caused by infections with the HCV and the HBV [3]. In Egypt, the steep rise in HCC cases can be largely attributed to the country having a high rate of HCV infection [4]. Patients with HCV who also have liver cirrhosis are more likely to develop HCC. The key factor in HCC occurrence is non-alcoholic steatohepatitis (NASH), which has recently been associated with metabolic syndrome and diabetes and metabolic syndrome [5]. Unfortunately, a majority of HCC patients in Egypt receive their diagnosis in the late or advanced stages of the illness [6]. These days, finding new diagnostic and prognostic biomarkers for HCC is essential to achieving early detection and reducing mortality rates associated with HCC [4].
The course of chronic liver disease varies greatly, ranging from minimal histological damage to severe cirrhosis and HCC [7]. Some of this variability is affected by genetic variation. The presence of the G allele in the single-nucleotide polymorphism (SNP) I148M (rs738409) of the adiponutrin gene (PNPLA3) within the context of metabolic, alcoholic, and viral liver diseases acts as a prime example of a gene variant impacting the progression of chronic liver diseases [8]. Indeed, individuals carrying the G allele at this specific site exhibit reduced enzymatic activity of adiponutrin, leading to elevated intracellular triglyceride levels [9], which may raise their likelihood of developing advanced fibrosis, cirrhosis, and HCC.
A non-synonymous single nucleotide polymorphism (SNP) in the transmembrane 6 superfamily member 2 (TM6SF2) gene is linked to non-alcoholic fatty liver disease. Although there are limited data relating to their involvement in other causes, variations of the TM6SF2 gene exert a significant impact on the development of HCC in people with alcoholic cirrhosis [10].
There is still conflicting information available about how these genes affect the risk of HCC; the way the two genes interact may help to explain some of these differences and may be used to determine the risk of HCC in hepatitis C patients. Therefore, the purpose of this study was to assess PNPLA3 and TM6SF2 genetic variants as risk factors for HCC in Egyptian patients with chronic HCV disease.
Material and methods
286 participants who were matched for age and sex were recruited from the National Liver Institute Hospital at Menoufia University in Egypt for this case-control study. Participants were divided into three groups: 100 healthy controls, 89 patients with chronic HCV infection, and 97 cases of HCC with liver cirrhosis and chronic HCV infection.
Hepatocellular carcinoma cases were randomly selected from hospital records of patients who met the inclusion criteria between 2020 and 2024. Eligible patients were contacted, and those who agreed to participate provided written informed consent, after which a blood sample was collected. Chronic HCV patients were recruited from the liver clinics, while healthy controls were randomly selected from individuals visiting the National Liver Institute (NLI) laboratory for non-liver-related services. Healthy controls exhibited normal liver function and were serologically negative for hepatitis B surface antigen (HBsAg) and HCV antibodies (HCVAb).
Participants with HCC or chronic HCV and members of the control group were required to meet the following inclusion criteria: No co-infections with hepatitis B virus (HBV), human immunodeficiency virus (HIV), Epstein-Barr virus (EBV), or cytomegalovirus (CMV); no history of alcohol abuse, bilharzia, autoimmune diseases, or hematological disorders.
Exclusion criteria were as follows: presence of hepatitis B infection or other chronic liver conditions, including autoimmune hepatitis and drug-induced liver disease, and any history of alcohol consumption. HCC diagnosis followed the guidelines of the American Association for the Study of Liver Diseases (AASLD), using computed tomography (CT) or magnetic resonance imaging (MRI) and α-fetoprotein (AFP) measurements [11].
HCV infection was confirmed using quantitative real-time polymerase chain reaction (PCR) for HCV RNA (Cobas Amplicor, HCV Roche, Branchburg, NJ, USA, version 2.0, with a detection limit of 15 IU/ml).
Clinical and laboratory assessments
All participants underwent comprehensive medical history reviews and clinical evaluations. Laboratory tests included: complete blood count (CBC), liver and renal function tests, and AFP measurements. For HCC patients, tumor characteristics such as size, location, number of focal lesions, portal vein involvement, and abdominal lymph node status were documented. Performance status (PS) was assessed using the Eastern Cooperative Oncology Group (ECOG) scale. Treatment was guided by the Barcelona Clinic Liver Cancer (BCLC) staging system, and treatment response was evaluated using the modified Response Evaluation Criteria in Solid Tumors (mRECIST) guidelines. Patient records were monitored for HCC recurrence [12].
Sample collection and genetic analysis
A 5-ml blood sample was collected from each participant into sterile anticoagulant tubes. Genomic DNA was extracted and purified from peripheral blood lymphocytes using a Qiagen DNA kit (Qiagen, Germany). DNA samples were stored at –80°C, with aliquots maintained at –20°C before analysis. The concentration and purity of DNA were measured using a NanoDrop spectrophotometer (Thermo Fisher Scientific, USA).
Molecular genotyping for the PNPLA3 rs738409 C>G and TM6SF2 rs58542926 T>C polymorphisms was performed using the Rotor-Gene Real-Time PCR System (QIAGEN, GmbH) and the ABI TaqMan allelic discrimination kit (Applied Biosystems, USA). The 20 µl reaction master mix was divided into 10 µl genotyping master mix, 0.5 µl genotyping assay 3.5 µl of nuclease free water and 6 ul template DNA. PCR conditions included denaturation at 95°C for 10 minutes, followed by 40 cycles of 95°C for 15 seconds and 60°C for 1 minute. To ensure accuracy, 10% of samples were randomly re-genotyped, with 100% concordance observed between initial and repeated genotyping results.
Ethical considerations and sample size calculation
The study received ethical approval from the National Liver Institute Institutional Review Committee. Informed consent was obtained from all participants. Sample size calculations were performed using Quanto and PS (Power & Sample Size) software.
Statistical analysis
SPSS version 25.0 (IBM Corp., Armonk, NY, USA) was used to analyze the data. The mean ± standard deviation (SD) of continuous variables was displayed, and the Student’s t-test or one-way ANOVA, as applicable, was used for comparison. Frequencies and percentages representing categorical data were compared using the chi-square (χ2) test or, if required, Fisher’s exact test.
Genotype and allele frequencies of the PNPLA3 (rs738409) and TM6SF2 (rs58542926) polymorphisms were determined by direct counting. The χ2 test was used to evaluate the Hardy-Weinberg equilibrium (HWE) for both SNPs in the control group. The χ2 test was used to assess genotype and allele frequency differences between the HCC, HCV, and control groups.
An odds ratio (OR) with 95% confidence interval (CI) was calculated to estimate the associations between SNP genotypes and disease risk. The association between SNPs and disease outcomes was assessed using the dominant, recessive, and additive genetic models. To assess recurrence-free survival (RFS) among various genotypes, survival analysis was carried out using the Kaplan-Meier technique, and comparisons were made using the log-rank test. Statistical significance was defined as p-values below 0.05.
Results
Socio-demographic and clinical characteristics
In this study, we examined three groups: HCV patients, HCC patients, and a control group. The mean ages for these groups were 61.6 ±7.2 years for HCV, 59.2 ±13.7 years for HCC, and 58.2 ±9.6 years for the control group, with no significant age difference among the groups (p = 0.073). Regarding gender distribution, the majority of participants were male across all groups: 85.6% in the HCV group, 83.1% in the HCC group, and 80.0% in the control group. Females comprised 14.4% of the HCV group, 16.9% of the HCC group, and 20.0% of the control group. There was no statistically significant difference in gender distribution among the groups (p = 0.582).
In the HCV group (n = 100), 57.9% of patients had cirrhosis, while 42.1% did not, and among 85 patients, 25.9% had ascites. Fibrosis staging revealed that 59.7% of patients had advanced fibrosis (F3 and F4). Liver function tests showed mean alanine aminotransferase (ALT) and aspartate aminotransferase (AST) levels of 57.95 ±65.05 U/l and 67.01 ±68.92 U/l, respectively. The mean AFP level was 8.67 ±42.41 ng/ml, and mean albumin was 3.09 ±1.62 g/dl. Total and direct bilirubin levels were 1.95 ±3.22 mg/dl and 0.69 ±1.60 mg/dl, respectively (Table 1).
Table 1
Basic clinical characteristics of HCV and HCC groups
[i] HCV – hepatitis C virus, HCC – hepatocellular carcinoma, ALT – alanine aminotransferase, AST – aspartate aminotransferase, AFP – α-fetoprotein, DAAs – direct-acting antivirals, SVR – sustained virological response, HTN – hypertension, DM – diabetes mellitus, COPD – chronic obstructive pulmonary disease, PS – performance status, BCLC – Barcelona Clinic Liver Cancer, BSC – best supportive care, EI – ethanol injection, RFA – radiofrequency ablation, TACE – transarterial chemoembolization
For the HCC group, additional clinical characteristics are detailed in Table 1. Approximately, 95.9% of patients received direct-acting antiviral (DAA) treatment, and 80.4% achieved a sustained virological response (SVR). Among the patients, 19.6% had hypertension, and 18.5% had diabetes mellitus. Tumor characteristics showed that single lesions were most common (47.4%), followed by multiple lesions (42.3%) and infiltrative lesions (10.3%). The right lobe was predominantly affected (61.9%). The majority of patients (97.9%) had a PS of 0. Portal vein thrombosis (PVT) was observed in 25.8% of patients, extra-hepatic metastases in 13.4%, and ascites in 13.4%. Based on the BCLC staging system, patients were distributed as follows: Stage A (31.9%), Stage B (36.1%), Stage C (30.9%), and Stage D (1.1%). Regarding liver function, the majority of patients had a CHILD score of A (95.9%), with smaller proportions in scores B (3.1%) and C (1.0%). The most frequently used treatments were transarterial chemoembolization (TACE) (35.1%) followed by sorafenib (24.7%) while partial hepatectomy was performed in 20.6% of HCC cases. The biochemical profiles for the HCC group are summarized in Table 1.
Hardy-Weinberg equilibrium analysis was performed for the genetic variants TM6SF2 (rs58542926) and PNPLA3 (rs738409) in the control group. For TM6SF2 (rs58542926), the observed and expected genotype frequencies showed no significant deviation from HWE (χ2 = 2.04, p = 0.15). Similarly, the PNPLA3 (rs738409) variant also followed HWE, with a χ2 value of 2.4 and a p value of 0.11.
Association of PNPLA3 and TM6SF2 with risk of HCC
For PNPLA3 (rs738409), CC genotype was the most common in the control group (89.0%), while CG and GG genotypes were more prevalent in HCV and HCC groups. For the HCV group, the CG genotype was associated with a markedly increased risk (OR = 12.52, 95% CI: 5.41-28.9), whereas the GG genotype did not significantly increase HCV risk. In the HCC group, the CG and GG genotypes showed strong associations, with an OR of 6.8 (95% CI: 2.9-15.8) and 5.49 (95% CI: 1.45-20.85), respectively. The dominant model (CG and GG combined) significantly increased the risk for HCC by 8 times (p < 0.001, OR = 8.05, 95% CI: 3.64-17.8). Furthermore, the G allele was more frequent in HCV (29.8%) and HCC (27.4%) groups compared to the control group (7.0%), reinforcing its association with disease risk (p < 0.001 for both HCV and HCC) (Table 2).
Table 2
Association of PNPLA3 (rs738409) and TM6SF2 (rs58542926) polymorphisms with HCV and HCC risk in additive, recessive, and dominant genetic models
| Studied SNP | Healthy control (n = 100) | HCV (n = 89) | HCC (n = 97) | P-value | OR (95% CI) |
|---|---|---|---|---|---|
| PNPLA3 (rs738409) | |||||
| Additive genetic model, n (%) | CC Reference group* OR1 = 12.52 (5.41-28.9) OR2 = 6.8 (2.93-15.8) OR3 = 0.54 (0.3-1.0) OR4 = 2.97 (0.63-13.88) OR5 = 5.49 (1.45-20.85) OR6 = 1.85 (0.54-6.33) | ||||
| CC* | 89 (89.0) | 40 (44.9) | 54 (55.7) | 0.001 | |
| CG | 8 (8.0) | 45 (50.6) | 33 (34.0) | ||
| GG | 3 (3.0) | 4 (4.5) | 10 (10.3) | ||
| Recessive genetic model, n (%) | OR* = 1.52 (0.33-6.99) OR** = 3.72 (0.99-13.9) OR*** = 0.41 (0.12-1.36) | ||||
| GG | 3 (3.0) | 4 (4.5) | 10 (10.3) | 0.01 | |
| CG + CC | 97 (97.0) | 85 (95.5) | 87 (89.7) | ||
| Dominant genetic model, n (%) | OR* = 12.4 (5.55-27.63) OR** = 8.05 (3.64-17.8) OR*** = 0.65(0.36-1.16) | ||||
| CC | 91 (91.0) | 40 (44.9) | 54 (55.7) | < 0.001 | |
| CG + GG | 9 (9.0) | 49 (55.1) | 43 (44.3) | ||
| Allele frequency, n (%) | OR* = 5.63 (3.0-10.59) OR** = 4.99 (2.66-9.36) OR*** = 0.89 (0.56-1.39) | ||||
| C | 186 (93.0) | 125 (70.2) | 141 (72.6) | < 0.001 | |
| G | 14 (7.0) | 53 (29.8) | 53 (27.4) | ||
| TM6SF2 (rs58542926) | |||||
| Genotype, n (%) | |||||
| CC | 88 (88.0) | 75 (84.3) | 83 (85.6) | 0.93 | – |
| CT | 10 (10.0) | 11 (12.4) | 12 (12.4) | ||
| TT | 2 (2.0) | 3 (3.4) | 2 (2.1) | ||
| Recessive genetic model, n (%) | |||||
| TT | 2 (2.0) | 3 (3.4) | 2 (2.1) | 0.79 | – |
| CT + CC | 98 (99.0) | 86 (96.6) | 95 (97.9) | ||
| Dominant genetic model, n (%) | |||||
| CC | 88 (88.0) | 75 (84.3) | 83 (85.6) | – | |
| CT + TT | 12 (12.0) | 14 (15.8) | 14 (14.4) | ||
| Allele frequency, n (%) | |||||
| C | 186 (86.0) | 161 (90.4) | 178 (91.7) | 0.66 | – |
| T | 14 (14.0) | 17 (9.6) | 16 (8.3) |
For TM6SF2 (rs58542926), no significant associations were observed with HCV or HCC across any genetic models. The CT or TT genotypes showed no risk effect, and the T allele frequency did not differ significantly between groups (p = 0.66) (Table 2).
Impact of PNPLA3 and TM6SF2 variants on clinical outcomes in HCV patients
In the HCV group, the PNPLA3 CG/GG genotypes were significantly associated with an increased risk of cirrhosis, with an OR of 2.76 (95% CI: 1.07-7.08, p = 0.03). The same genotypes showed a strong association with advanced fibrosis (F3-F4), having an OR of 5.02 (95% CI: 1.68-15.04, p = 0.003). No association was observed with the presence of ascites (Table 3).
Table 3
Association of PNPLA3 (rs738409) and TM6SF2 (rs58542926) with clinical data in HCV group
For TM6SF2 (rs58542926), the CT/TT genotypes showed no significant associations with cirrhosis (p = 0.59, OR = 0.68, 95% CI: 0.17-2.80), advanced fibrosis (p = 0.37, OR = 0.42, 95% CI: 0.06-2.71), or ascites (p = 0.49, OR = 0.47, 95% CI: 0.10-2.32) (Table 3).
Association of PNPLA3 and TM6SF2 variants and clinical characteristics in HCC patients
Patients with the PNPLA3 CC genotype exhibited higher SVR rates (89.9%) compared to those with CG/GG genotypes (69.8%) (p = 0.02). However, no significant differences were found among genotypes regarding age, comorbidities, lesion characteristics, PS, PVT, extra-hepatic metastases, or ascites presence (Table 4).
Table 4
Association of PNPLA3 (rs738409) and TM6SF2 (rs58542926) with clinical characteristics in HCC group
Other parameters, including albumin, bilirubin levels, international normalized ratio (INR), ALT, hemoglobin, creatinine, total leukocyte count (TLC), platelet count, and α-fetoprotein (AFP), showed no significant differences by genotype (Table 4).
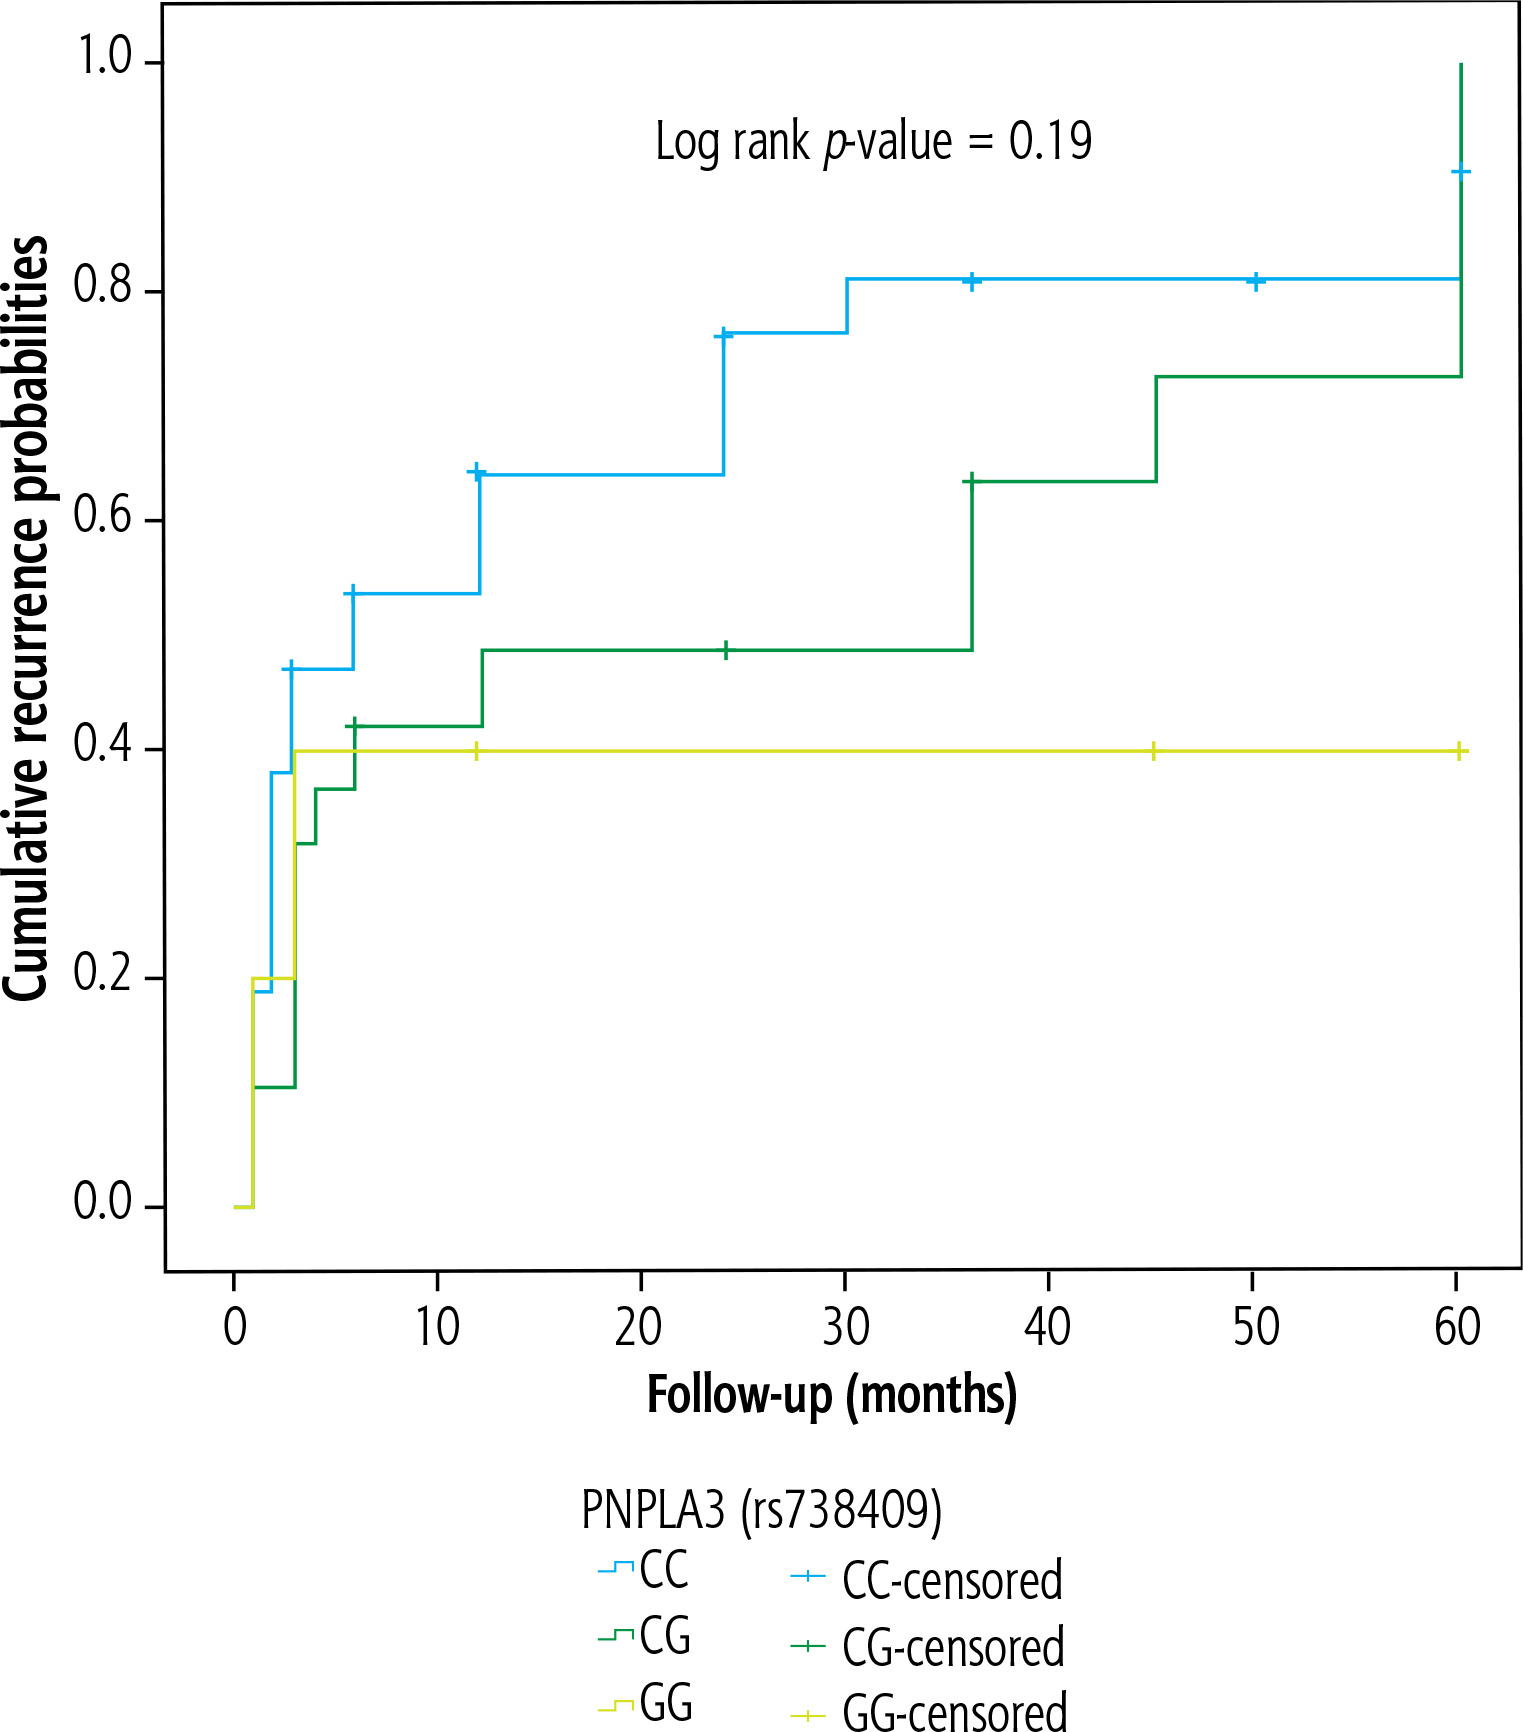
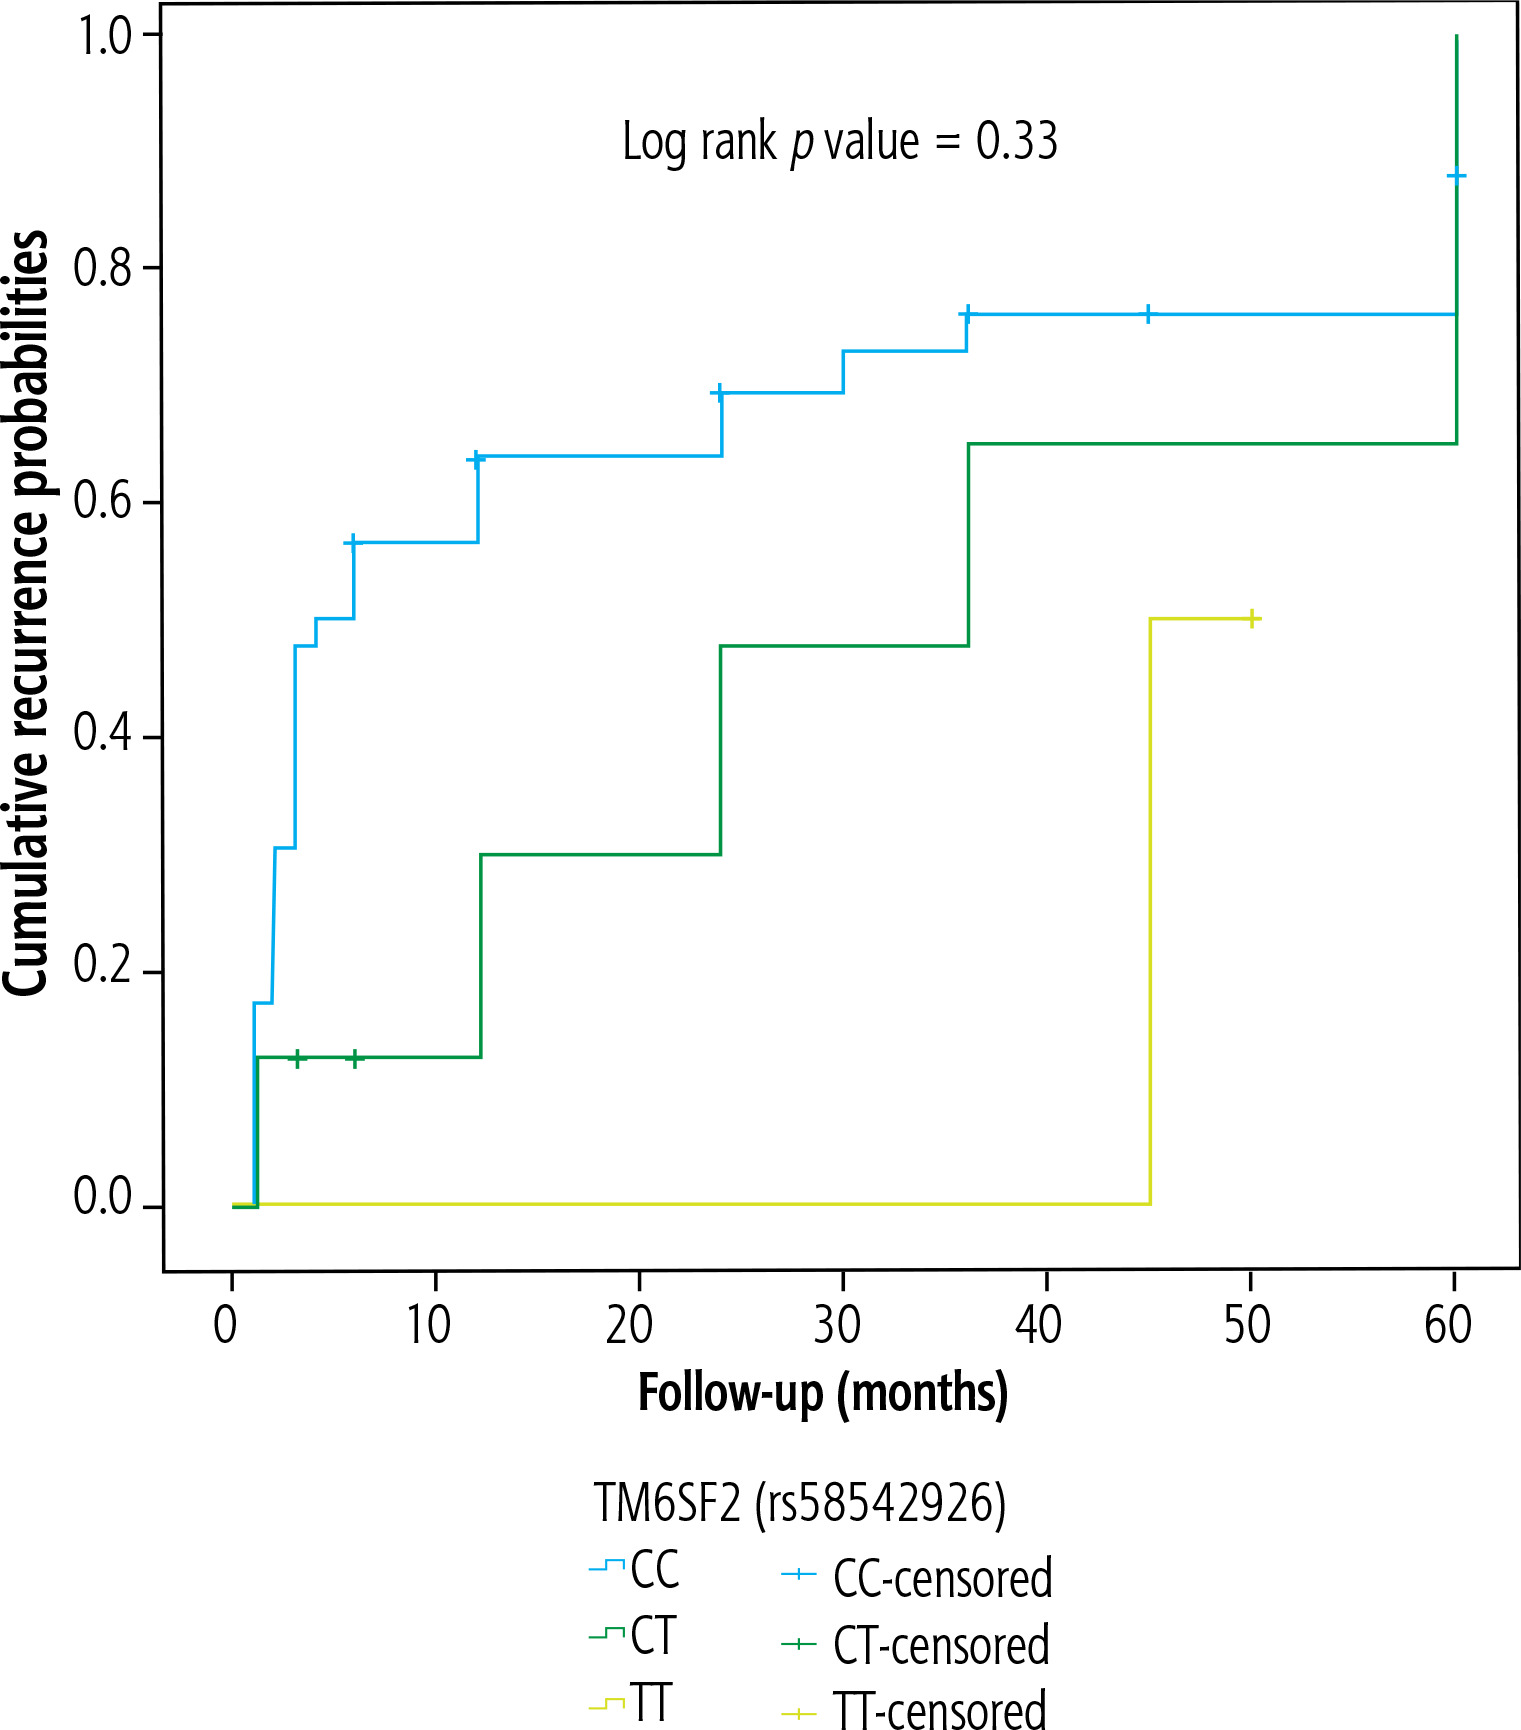
As regards HCC recurrence, neither PNPLA3 nor TM6SF2 genotype was associated with the recurrence-free survival of the studied cases, which were followed for a mean of 17.04 ±20.03 months (Figs. 1 and 2, respectively).
Discussion
Hepatocellular carcinoma remains the leading cause of cancer-related morbidity and mortality in Egypt and is the most prevalent cancer among males. It is commonly recognized that a key risk factor for HCC is chronic hepatitis C infection, which is a serious public health concern in Egypt. This study assessed the association between the PNPLA3 (rs738409) and TM6SF2 (rs58542926) polymorphisms and HCC susceptibility among Egyptian patients with chronic HCV infection and cirrhosis. The relationship between these polymorphisms and HCC risk in various populations has been the subject of conflicting findings in previous research. According to our findings, the distribution of PNPLA3 genotypes varies significantly between the control, HCV, and HCC groups, suggesting a strong correlation between these genetic variations and HCC. However, no significant association was observed for the TM6SF2 variant.
The protein patatin-like phospholipase domaincontaining protein 3, which is encoded by the PNPLA3 gene, is essential for the metabolism of lipids in the liver. The function of the rs738409 polymorphism in hepatic steatosis and fibrosis has been extensively studied. This polymorphism causes an isoleucine-to-methionine substitution at position 148 (I148M). According to published research, the G allele is associated with inflammation and hepatic fat storage, two major risk factors for liver cirrhosis and fibrosis, which in turn lead to HCC [13, 14]. Our findings align with this, as we observed that the PNPLA3 CG/GG genotypes were associated with a significantly increased risk of cirrhosis (2.7-fold higher) and advanced fibrosis (F3-F4, 5-fold higher) among chronic HCV patients, emphasizing this variant’s role in promoting fibrogenesis and, consequently, HCC. This is corroborated by our findings, which indicate that the G allele increased the risk of HCC seven-fold. The CG and GG genotypes carriers had a significantly higher risk of developing HCC than those with the CC genotype, with odds ratios of 6.8 and 12.6, respectively. This observation is in line with findings by Yang et al., who reported similar results in a European HCC population (OR = 1.67, 95% CI: 1.16-2.40) [15], and Fteah et al., who observed a similar correlation in an Egyptian HCC cohort (OR = 5.254, 95% CI = 3.119-8.851) [16]. This association is further supported by a meta-analysis which examined fourteen case-control studies with 3,527 HCC patients and 7,184 controls from different areas (Asian, Caucasian, North African, and American). In a number of genetic models, including the dominant model (OR = 1.17, 95% CI: 1.02-1.35, p = 0.03), the homozygous model (OR = 1.47, 95% CI: 1.17-1.85, p = 0.001), the allelic model (OR = 1.19, 95% CI: 1.07-1.32, p = 0.001), and the recessive model (OR = 1.43, 95% CI: 1.15-1.76, p = 0.001), the meta-analysis showed that the PNPLA3 rs738409 C > G polymorphism was associated with an increased HCC risk in virus-related cirrhosis [17]. In contrast, PNPLA3 was not found to be a significant risk factor for HCC among HCV patients in studies by Ali et al. and Hai et al., which were carried out on American, European, and Japanese cohorts, respectively [18, 19]. Furthermore, in a Brazilian population, Maccali et al. found no correlation between this polymorphism and HCC [20].
The effects of the rs58542926 polymorphism in the TM6SF2 gene on liver disease have been extensively researched. It is known that the E167K variation (rs58542926), which substitutes lysine for glutamate at position 167, reduces the expression of the TM6SF2 protein, which in turn causes the liver to retain more triglycerides and secrete less VLDL. This change toward hepatic fat storage has a significant impact on liver health, increasing the risk of developing non-alcoholic fatty liver disease (NAFLD) and accelerating the development of more serious liver diseases such as cirrhosis, fibrosis, and ultimately HCC [21]. For the TM6SF2 (rs58542926) mutation, our analysis revealed that TM6SF2 (rs58542926) was not significantly associated with HCC risk in any of the genetic models tested. The CT and TT genotypes did not confer any significant risk, and the T allele frequency was similar across all groups (p = 0.66). This finding contrasts with many previous studies that have reported the T allele as a risk factor for HCC in other populations [15, 22, 23]. The lack of association in our study may reflect differences in genetic backgrounds across various ethnic groups or the specific context of HCV-related HCC, which may differ from HCC due to alcohol-related cirrhosis, HBV cirrhosis, NAFLD, or autoimmune liver disease. The unique inflammatory and fibrotic pathways associated with HCV may modulate TM6SF2’s effects differently, potentially explaining the lack of association observed in our study.
While some Egyptian studies have reported the T allele as a risk factor [15, 24], specific environmental exposures, lifestyle factors, or subtle genetic variations within Egyptian subpopulations could modulate TM6SF2’s effects differently. Furthermore, variations in the study design components from earlier studies or sample characteristics (such as age, fibrosis stage, and metabolic profile) could potentially be relevant. To better understand the significance of TM6SF2 in different populations and provide valuable information for a broader understanding of HCC risk factors, larger, more varied cohorts and meta-analyses are necessary.
Interestingly, individuals with the CC genotype of PNPLA3 achieved higher rates of sustained virologic response (SVR) following antiviral therapy (89.9%) compared to those with CG or GG genotypes (69.8%). This suggests a potential interaction between PNPLA3 genotype and treatment efficacy, where the G allele, particularly in the GG genotype, might reduce response rates to antiviral treatment. This observation aligns with previous studies showing that the G allele can worsen liver disease severity, likely by promoting steatosis and fibrosis, which could compromise the effectiveness of antiviral therapies [25, 26]. No significant differences were noted among PNPLA3 genotypes concerning BCLC stage, PS, Child-Pugh score, PVT, extra-hepatic metastasis, and ascites, indicating that the genotype’s influence appears more significant in treatment response and disease progression rather than in these specific clinical parameters.
Our search did not reveal a clear relationship between PNPLA3 and TM6SF2 polymorphisms and HCC recurrence. There is limited direct proof regarding the roles of the PNPLA3 genotype and TM6SF2 (E167K) variant in HCC recurrence. Some studies have indicated that PNPLA3 and TM6SF2 genotypes may not significantly affect recurrence-free survival or overall survival in HCC patients. For example, Gawrieh et al. found no association between PNPLA3 genotype and HCC recurrence in a cohort of liver transplant recipients [27]. This implies that the biological processes underlying HCC occurrence could be different from those causing recurrence, with treatment effectiveness, immunological response, and residual tumor biology possibly having a greater impact on recurrence than genetic susceptibility alone.
Conclusions
This study highlights the impact of PNPLA3 polymorphism on HCC risk in Egyptian individuals with chronic HCV, with the G allele increasing fibrosis, cirrhosis, and HCC risk. In contrast, the TM6SF2 variant did not show a significant association with HCC risk in this population. Identifying high-risk individuals through PNPLA3 genetic screening could enhance early detection and targeted surveillance, while incorporating genetic risk factors into preventive medicine could guide lifestyle and therapeutic interventions to mitigate HCC progression. Further large-scale studies are needed to validate these findings and enhance personalized prevention strategies in HCV-endemic regions.


