
Introduction
Hepatitis C virus (HCV) is a curable infectious agent for which no vaccine is yet available. The majority of infected patients develop chronic HCV infection. Over the years, chronic infection has led to liver fibrosis, cirrhosis, and hepatocellular carcinoma (HCC) [1]. Fibrosis formation in the liver is considered the major cause of HCV-related morbidity and mortality. The degree of liver fibrosis is one of the most reliable prognostic factors for predicting the progression and clinical outcome of HCV infection. Therefore, accurate assessment of fibrosis is critical [2].
Liver biopsy is the gold standard for detecting the degree and stage of liver damage. However, liver biopsy cannot be used for follow-up because it can lead to complications such as bleeding, pain, and perforation of other organs and is an expensive method. Today, there is an increasing need for noninvasive methods to evaluate the histological response to treatment. In addition to imaging techniques such as FibroScan to stage fibrosis, fibrosis markers calculated by serum tests offer advantages in diagnosis and treatment monitoring [3].
The aim of our study was to determine the changes in histological response by scores of AST to Platelet Ratio Index (APRI), Fibro Q, Fibrosis-4 (FIB-4) index, Doha score, Fibro alpha, and fibrosis-cirrhosis index (FCI) calculated by examinations before treatment, at the end of treatment, at the 12th week after treatment, at the first year, and at the third year after treatment in patients diagnosed with chronic hepatitis C and treated with direct-acting antivirals (DAA).
Material and methods
This study was approved by the Ethics Committee for Noninterventional Research of Haseki Health Sciences University by Decision No. 90-2021, dated October 6, 2021, in accordance with the Declaration of Helsinki. There is no conflict of interest in our study.
Patient group
Those who presented to the Infectious Diseases and Clinical Microbiology Outpatient Clinic of Health Sciences University, Haseki Training and Research Hospital, between June 1, 2016, and January 1, 2020, were > 18 years old, were HCV-RNA positive, had treatment experience or were naive, were cirrhotic or non-cirrhotic, had started DAA treatment, and 125 patients whose results were available were included. The study was conducted as a retrospective observational case series. Patients with a history of liver transplantation, patients with hemochromatosis, additional liver diseases causing cirrhosis such as Wilson disease, and pregnant women were not included.
Definitions and reference ranges
Biochemical analyses such as serum aspartate aminotransferase (AST), alanine aminotransferase (ALT), and γ-glutamyl transferase (GGT) of patients in this study were measured with kits on Beckman AU2700 autoanalyzer devices of the biochemistry laboratory of Health Sciences University Haseki Training and Research Hospital. The upper limit of normal (ULN) for AST was assumed to be 40 IU/l according to the guideline. HCV-RNA PCR was performed on the Rotor-Gene Q device with Qiagen kits.
Scores of APRI, Fibro Q, FIB-4 index, Doha score, Fibro alpha, and fibrosis-cirrhosis index were used to evaluate liver fibrosis. Differentiation between cirrhotic and non-cirrhotic patients was based on the FIB-4 score (threshold for cirrhosis: ≥ 3.25). In 71 patients with biopsy results, the Knodell histologic activity score was used to assess fibrosis at baseline. Patients with fibrosis scores of 0, 1, and 2 were considered to have low fibrosis, and patients with a score of ≥ 3 were considered to have significant fibrosis.
Patients were treated according to the treatment regimens recommended in the 2016 and 2018 EASL and Health Practice Communiqué (HPC) guidelines. An undetectable HCV-RNA 12 (SVR12) or 24 (SVR24) weeks after the end of treatment was accepted as a sustained virological response (SVR).
Noninvasive indices of liver fibrosis
APRI = [(AST/AST upper limit of normal) / platelet count] × 100,
FIB-4 = (age × AST) / (platelet count × √ALT),
Fibro Q: [(10 × age × AST × INR) / (platelet count) × ALT],
Doha score: 8.5-0.2 (albumin) + 0.01 (AST) – 0.02 (platelet count),
Fibro alpha: 1.35 + [AFP × 0.009584] + [(AST)/(ALT) × 0.243] – (platelet count × 0.001624),
FCI (fibrosis-cirrhosis index): [(ALP × bilirubin) / (albumin × platelet count)].
Statistical analysis
The SPSS 15.0 program for Windows was used. Descriptive statistics were given as numbers and percentages for categorical variables and as median, minimum, and maximum for numerical variables.
Cut-off point analyses were performed using ROC analysis. The statistical significance level alpha was accepted as p < 0.05.
Results
The demographic data and mean serum HCV-RNA level of the patients before treatment are shown in Table 1. The mean age of the patients was 55.5 ±15.9 years, and 95 (76.6%) patients were infected with genotype 1. 103 (82.4%) patients were treatment-naive. Based on their baseline FIB-4 values, patients were divided into two groups: cirrhotic/noncirrhotic. Seven (5.6%) patients had compensated cirrhosis; there were no decompensated cirrhotic patients. The mean serum HCV-RNA level of patients before treatment was 6765765.8 ±82029511 IU/ml. 64 (51.2%) patients received the OBV/PTV/r ± DSV regimen.
Table 1
Characteristics of cases and pretreatment findings
The course of median values calculated by scores at baseline and at the three-year follow-up after treatment is given in Table 2.
Table 2
Distribution of median values of cases calculated by scores before treatment, at the end of treatment, at the 12th week after treatment, and at the first and third year after treatment
It was found that the values calculated by the scores APRI, FIB-4, Doha score, and Fibro Q decreased significantly at the end of treatment and at the third year after treatment compared to before treatment. An increase was observed in Fibro alpha and FCI scores. The change in values calculated by scores in all periods compared to the period before treatment proved to be statistically significant.
Subgroup analyses to detect differences between scoring are presented in Table 3.
Table 3
Wilcoxon test with Bonferroni correction results for changes in values calculated by scoring of cases before treatment, at the end of treatment, at the 12th week after the end of treatment, and at the end of the first and third years after treatment
The Wilcoxon test was used to find out between which times the differences occurred. Bonferroni correction was made. Changes between pre-treatment and measurements in all other time periods were found to be statistically significant in all scorings except Fibro alpha (p < 0.0055).
The correlation between scores of APRI, FIB-4, Fibro Q, Doha score, Fibro alpha, and FCI and histological fibrosis score and histological activity index in patients who underwent biopsy before treatment is presented in Table 4.
Table 4
Correlation between scores and histological fibrosis and histological activity index
A statistically significant correlation was found between all scores assessed and histological fibrosis scores (p < 0.05). A statistically significant correlation was observed between biopsy histologic activity index and scores other than Fibro alpha and FCI (p < 0.05).
In patients with pretreatment biopsy results (n = 71), the correlation of scores with histological fibrosis was analyzed using ROC (receiver operator characteristics curve) analysis (see Fig. 1 and Table 5). The analysis was found to be statistically significant for all scores.
Fig. 1
ROC analysis for the cut-off point of pretreatment scores predicting the presence of biopsy fibrosis
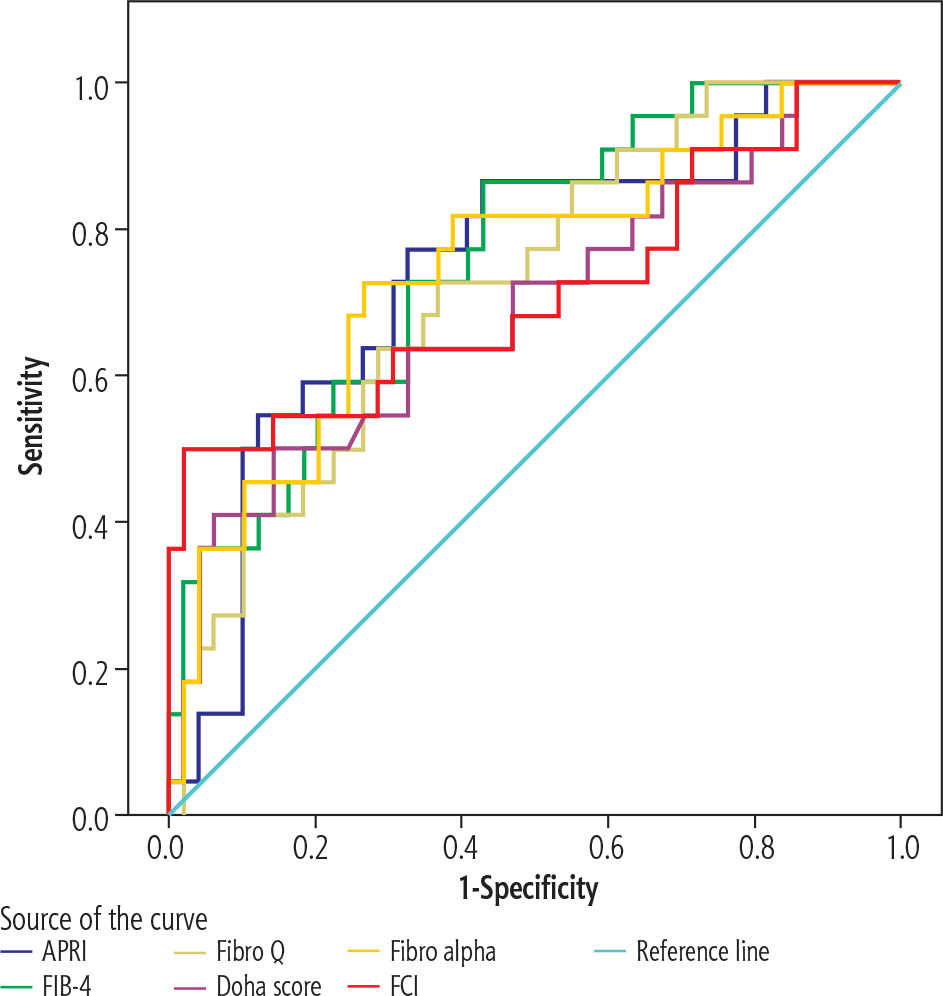
Table 5
Results of ROC analysis by fibrosis
The change in values calculated by noninvasive scores according to patients’ fibrosis status (fibrosis < 3 and fibrosis ≥ 3) before treatment and at the third year after treatment is given in Table 6. In the groups with and without advanced fibrosis, the difference between the values calculated by scores other than Fibro alpha before treatment and at the third year after treatment was statistically significant.
Table 6
Distribution of scores of cases before treatment, at the end of treatment, at the 12th week after treatment, at the first year after treatment, and at the third year after treatment according to fibrosis, and the changes in measurements before treatment and at the third year after treatment
Discussion
Liver cancer is the third leading cause of cancer-related deaths worldwide [4]. Hepatocellular carcinoma accounts for approximately 75% of liver cancers [5]. Hepatitis C virus has been shown to be responsible for 10-25% of HCC cases [6]. Noninvasive methods can be used to diagnose significant fibrosis and cirrhosis in patients with chronic hepatitis C or to evaluate fibrosis stage after treatment [7]. However, there are a few studies investigating histological recovery and follow-up after treatment using noninvasive methods.
In the study by Huang et al. in which they evaluated histological changes using liver biopsies before SVR and at SVR24 with direct-acting antiviral treatments, it was observed that 82% of patients had improved HAI ≥ 2 and 37% had improved fibrosis [8]. In our study, a decrease in values calculated with the scores APRI, FIB-4, Doha score, and Fibro Q and an increase in values calculated with the scores Fibro alpha and FCI were observed at the end of treatment and at the third year after treatment compared to before treatment. The change according to time before treatment was found to be significant for all scores. In another study, a statistically significant decrease in APRI and FIB-4 scores was observed at the end of treatment, and at the 12th and 24th weeks after treatment compared to before treatment with DAA. A significant positive correlation was found between scores and biopsy results before treatment [area under the curve (AUC): 0.800 and 0.782] [9]. In our study, the highest value of area under the curve (AUC) in the ROC analysis performed for the cut-off point to predict the presence of histological fibrosis was calculated with the FIB-4 scoring (AUC: 0.763). Similar to this study, the analysis proved statistically significant for all scores. In the study by Gozdas et al. investigating the efficacy of liver biopsy, hemogram parameters, APRI and FIB-4 scores in predicting severe fibrosis, a significant correlation was found between biopsy results and APRI and FIB-4 scores, especially for the MPR (mean platelet volume/platelet ratio) score in detecting advanced fibrosis [10]. In a different study evaluating the results of liver stiffness measurements (LSM), APRI, and FIB-4 with liver biopsies performed simultaneously before sustained virological response (SVR) and at SVR24, LSM, APRI, and FIB-4, which are more pronounced in patients with more severe inflammation and advanced fibrosis, were found to be strongly associated with HAI and to predict fibrosis well even after SVR [11]. Andrés-Otero et al. suggested that the combination of CDS, HGM-2, MODEL3, FI, and FCI should be considered in the diagnosis of advanced fibrosis and cirrhosis in untreated chronic hepatitis C (CHC) patients [12]. In our study, scores of Fibro alpha, APRI, Fibro Q, Doha score, and FCI were significant for determining liver fibrosis, and FIB4 was the most compatible after analyzing fibrosis scores of 71 patients with biopsy results before treatment. Apart from the universally known APRI and FIB-4, it was predicted that other scores examined in our study could be used to stage fibrosis before treatment. Scores other than Fibro alpha and FCI were also important in determining the histological activity index.
In a study conducted in Egypt comparing APRI, FIB-4, and GUCI scores calculated simultaneously with the pretreatment FibroScan, the FIB-4 index had higher sensitivity and specificity in detecting advanced fibrosis (F3-F4), but the APRI and GUCI scores were also found to be effective in predicting advanced fibrosis. It has been observed that AST, ALT and INR elevations as well as low platelet count are associated with advanced fibrosis [13]. In our study, an increase in albumin and platelet counts was observed in the third year after treatment compared to before treatment, whereas the decrease in other parameters was associated with improvement in fibrosis.
When Tachi et al. compared biopsies performed before treatment and at the fifth year after treatment in 115 CHC patients receiving interferon (IFN)-based antiviral therapy, a decrease in histological fibrosis was observed. The study also found that the APRI, FIB-4, and Forns indices were strongly associated with histological findings of liver fibrosis in patients who achieved SVR before and after antiviral therapy. However, the indices for both biopsies, especially the threshold values for predicting fibrosis stage of APRI, differed greatly [14]. In our study, as in this study, regression of scores calculated during the 3-year follow-up period after treatment was observed, but because no biopsy was performed after treatment, the threshold values for correlation between histological fibrosis and scores could not be observed.
Thandassery et al., in their study evaluating fibrosis by liver biopsy and 19 concurrently calculated simple noninvasive scores in 1602 CHC patients, 65.1% of whom had advanced fibrosis, found that the King score, GUCI score, and the APRI score had the highest predictive accuracy for advanced fibrosis. AST-ALT ratio (AAR) and Fibro alpha scores had low predictive accuracy for different stages of liver fibrosis [15]. In our study, the changes in the measurement values calculated by all scores except Fibro alpha before treatment and at the third year after treatment were found to be significant in the groups with and without advanced fibrosis. In this context, using scores of APRI, FIB-4, Doha score, Fibro Q, and FCI before and after SVR may give an idea of the different stages of liver fibrosis.
Daniel et al. found an SVR rate of 92% in 720 CHC patients treated with DAA in the general cohort (without special populations) and 90% in treatment-experienced patients [16]. In our study, 100% SVR was achieved in all patient groups, including cirrhotic, treatment-experienced, and elderly patients, regardless of genotype or treatment regimen.
In a prospective multicenter cohort study conducted by Mendizabal et al. to detect disease progression after treatment in 1760 patients receiving DAA treatment during a median follow-up of 26.2 months, a risk of disease progression was predicted despite the low risk of complications in patients with mild to moderate fibrosis and SVR [17]. In contrast, in our study of 125 patients, 54 patients who reached 3-year follow-up after completion of treatment did not develop cirrhosis or HCC during the follow-up period.
Fibrosis was shown to regress with treatment. In addition to APRI and FIB-4 values, a significant decrease in values calculated using the Doha score and Fibro Q was also observed. As a result, DAA treatments were found to be effective, and all patients in our study achieved a successful SVR.
Our study shows that scores of APRI, FIB-4, Doha score, and Fibro Q can be used to detect fibrosis before treatment and to monitor histological improvement after treatment.
However, our evaluations are limited because the patients included in our study were mostly noncirrhotic, the number of patients was small, and our study was conducted at a single center. Another limitation of our study is that only one biopsy was performed before treatment. Because no biopsy result was available after treatment, threshold values for correlation between histological changes and scores could not be determined.


