
Introduction
Celiac disease (CD) is considered a multiorgan autoimmune disorder, triggered by gluten in genetically susceptible individuals [1]. The pathophysiology is complex, involving intestinal T cell activation following gluten exposure that targets the autoantigen tissue transglutaminase in the setting of specific HLA haplotypes [1, 2].
Extraintestinal manifestations of CD include anemia, arthritis, osteomalacia, dermatitis herpetiformis, dental enamel defects, and migraine headaches, among others described in the literature [3]. Neurological disorders characterized by the presence of anti-neuronal and anti-ganglioside antibodies may be associated [4] as well as atopy [5]. Liver involvement has been similarly described for a number of decades, with a range of manifestations from asymptomatic transaminase disturbance to autoimmune hepatitis, and even cirrhosis [6-8]. CD appears to have a higher prevalence in individuals diagnosed with autoimmune hepatitis and overlap syndrome compared to the general population [9].
Around 36-47% of patients with an established diagnosis of CD have elevated transaminases, typically alanine transaminase more than aspartate transaminase, although both are in the range of 2 times the upper normal limit [6, 10]. On the other hand, the incidence of CD in patients who present with undiagnosed elevated transaminases is 10-12% [6, 10]. Isolated disturbances of alkaline phosphatase have been rarely described in CD but are likely attributed to concomitant osteomalacia (bone as opposed to liver source) [6]. As with CD enteropathy, what is known as “CD hepatitis” seems to respond well to a gluten-free diet (GFD), with normalization of transaminase levels occurring typically within 6-12 months in the majority of patients [6, 8, 11]. Only when transaminase levels do not normalize following introduction of a GFD is another etiology typically determined, such as autoimmune hepatitis [6, 12].
In this article, we describe the effect of a GFD on a number of liver function parameters in a large cohort of pediatric CD patients.
Material and methods
This is a retrospective study performed between January, 2007 and December, 2020 involving patients attending the pediatric gastroenterology clinics at King Abdulaziz University Hospital, in Jeddah, Saudi Arabia.
The study included all patients diagnosed with CD according to the European Society of Pediatric Gastroenterology Hepatology and Nutrition (ESPGHAN) criteria [1]. The diagnosis was established upon measuring a high level of tissue transglutaminase (tTG) antibodies using the enzyme-linked immunosorbent assay (ELISA) technique and by intestinal biopsies, showing the classic characteristics of CD (high intra-epithelial lymphocyte-to-enterocyte ratio, along with various degrees of crypt hyperplasia, and villous atrophy). Severity of mucosal damage was assessed according to the modified Marsh-Oberhuber classification for all cases [13]. A score of ≥ 2 was required to confirm a diagnosis of CD.
Demographic, clinical, biochemical, histopathologic, and imaging data of patients were included in the study.
For CD patients with elevated liver enzymes, CD is assumed as the primary cause for the liver abnormalities unless another diagnosis was suggested from the personal or family history. These patients’ liver function tests are usually monitored following a GFD. Autoimmune serologies, viral hepatitis screening, ultrasound, and a liver biopsy (when indicated) were reserved only for those CD patients with elevated liver enzymes or liver function abnormalities who failed to respond to a GFD within 6 months.
Outcomes and definitions
The primary outcomes of this study were the prevalence of elevated liver enzymes, changes in the mean values of liver enzymes, and other liver function parameters in CD patients following the introduction of a GFD. The secondary outcomes were the effects of gender, associated comorbidities, and adherence to a GFD on the pattern of changes of liver function parameters following the introduction of a GFD.
Elevated liver enzymes were defined according to the upper limit values in our reference laboratory: alanine transaminase (ALT) > 65 IU/l, aspartate transaminase (AST) > 34 IU/l, and γ-glutamyl transferase (GGT) > 85 IU/l. High total bilirubin was defined as total bilirubin > 17 µmol/l (normal: 0-17); low albumin level was defined as albumin < 35 g/l (normal: 35-50 g/l); normal prothrombin time (PT) was 9.4-12.5 s; and activated partial thrombin time (APTT) was 25-36.5 s according to our reference laboratory.
Statistical analysis
Data were analyzed using SPSS, version 22. A one-way repeated-measure analysis of variance (ANOVA) was used with post-hoc analysis using the Bonferroni test to compare changes with repeated measures of liver function elements over time. A mixed-design ANOVA was used when testing the repeated measures between categories, such as gender and level of adherence. Data were checked for normality prior to application of the ANOVA. A p value of < 0.05 was set as statistically significant.
Results
Baseline characteristics
The study cohort comprised 132 patients with CD after excluding 25 patients because of missing biochemical data. The median age was 9.5 years (range, 1-18 years). Males constituted 56.1% (n = 74) of the patients. The most common associated morbidities were type 1 diabetes (DM1) (33%), thyroid disease (15.7%), and Down syndrome (DS) (7.6%). Ninety-seven percent of patients were determined to have a severe form of CD (Marsh score 3). The baseline characteristics are shown in Table 1.
Table 1
Baseline characteristics of the study cohort (n = 132)
Study outcomes
Primary outcomes
Prevalence of elevated liver enzymes at diagnosis
At the time of diagnosis, of the 132 patients with CD, 38 patients (28.8%) had elevated AST levels, with a mean value of 56.7 (±32.8) and 10 patients (7.6%) had elevated ALT, with a mean value of 102 (±32.8). Two patients (1.5%) had elevated GGT at diagnosis. Nine patients (6.8%) had combined elevation of ALT and AST, and two patients (1.5%) had elevated AST, ALT, and GGT.
Changes in liver enzymes in response to a GFD
Changes of liver enzymes AST, ALT, and GGT after introduction of a GFD are shown in Figure 1 and Table 2.Following the introduction of a GFD, there was a decrease in AST levels throughout the year, but it did not reach statistical significance (p = 0.42).
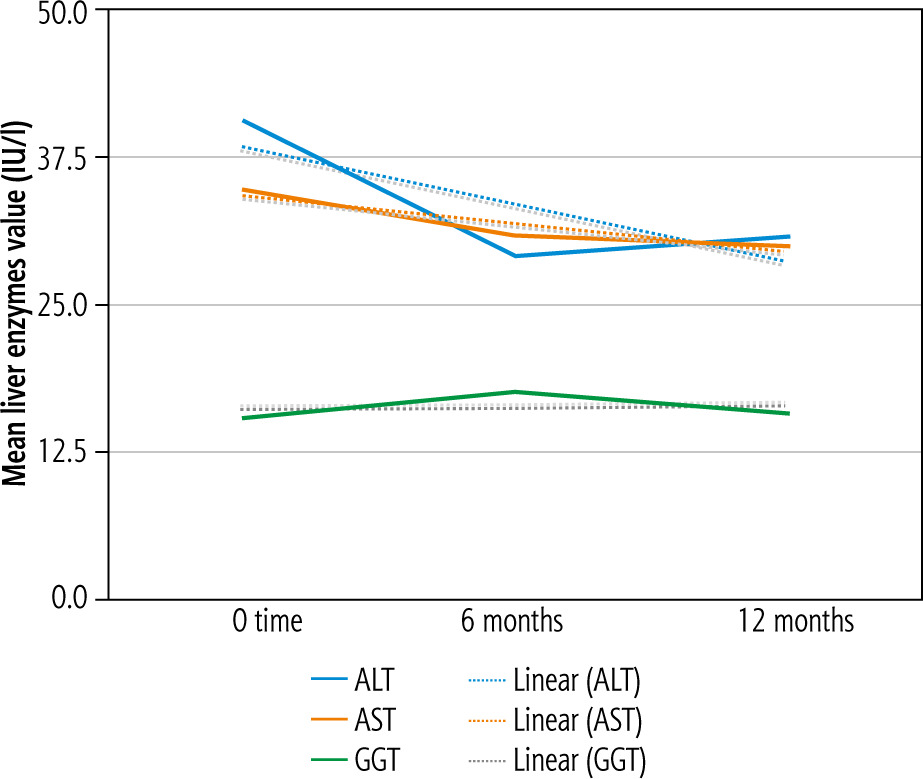
Table 2
Changes of mean values of liver function parameters after gluten-free diet (GFD) introduction
The ALT levels demonstrated overall a statistically significant drop during the first year following the introduction of GFD (p = 0.01), which was statistically significant between the time of GFD introduction and 6 months (p = 0.02) but not statistically significant between 6 months and 12 months (p = 0.48), according to the Bonferroni test.
Two patients had elevated GGT values at the time of diagnosis. Following the introduction of a GFD, there was a trend of decreasing mean GGT values for all patients, but it was not statistically significant (p = 0.89).
The overall alkaline phosphatase changes at 6 and 12 months showed a downtrend following the introduction of a GFD but this was not statistically significant (p = 0.12). Alkaline phosphatase (ALP) levels increased between 6 months and 12 months but not significantly (p = 0.14) (Table 2).
Changes in other liver function parameters following introduction of a GFD
The total bilirubin was elevated in only one patient (0.07%) at diagnosis. Changes of the mean total bilirubin for the whole cohort with subsequent readings at 6 and 12 months were not significant (p = 0.34) (Table 2).
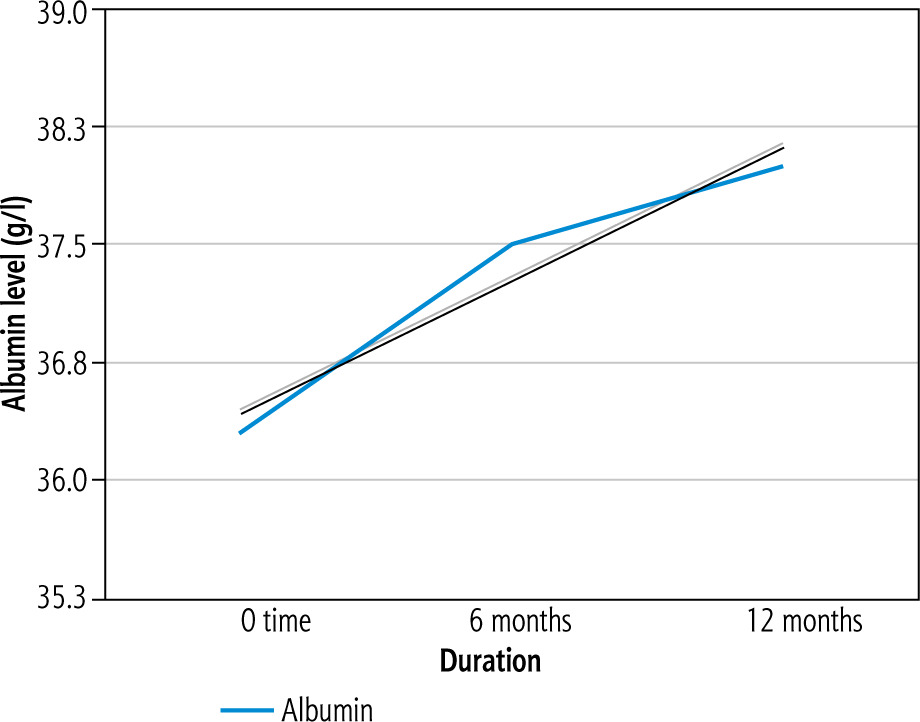
The albumin level was low in 29 patients (22%) at diagnosis. A positive trend for the mean albumin level was found after introduction of a GFD at 6 and 12 months, which was statistically significant (p = 0.03) (Fig. 2).
Of the 71 patients who had PT determined, 36 (50.7%) had mild prolongation of the PT. The changes in the mean PT at 6 and 12 months were not significant (p = 0.37). APTT was mildly elevated in 15 out of 67 patients tested (22.4%). However, no statistically significant changes were found in the mean value when measured at 6 and 12 months following introduction of a GFD (p = 0.47) (Table 2).
Secondary outcomes
Liver function changes by gender, DM, thyroid, and adherence to a GFD
The analysis of the linear changes in liver function was performed categorized according to other relevant variables, such as age, comorbidities, and adherence to a GFD diet; however, there were no statistically significant trends in any of the liver function parameters studied (Table 3). There was an improvement of ALT in DM patients (p = 0.11), thyroid patients (p = 0.17), and patients with good adherence (p = 0.17) to a GFD diet, but these changes did not reach statistical significance. When studying the trend of AST and GGT changes over time in relation to gender, associated morbidities, and GFD adherence, there were no statistically significant relationships found. A trend was observed for an increase in the level of GGT in patients with poor adherence to a GFD that was not statistically significant (p = 0.12). Testing for changes of other liver-related parameters, including ALP, total bilirubin, and albumin categorized by gender, DM, thyroid disease, and adherence level, showed no statistically significant differences. A greater decline in the total serum bilirubin level compared to patients with no thyroid disease was found, but which was not statistically significant (p = 0.059). Additionally, comparing DM patients to non-DM patients, we found lesser increase in albumin levels and a greater increase in ALP levels, but which were not statistically significant (p = 0.13 and p = 0.09, respectively).
Table 3
Effects of gender, diabetes mellitus (DM), thyroid disease and gluten-free diet (GFD) adherence on liver enzymes
[i] ALT-0 – alanine transaminase at baseline, ALT-6 – alanine transaminase at 6 months after GFD, ALT-12 – alanine transaminase 12 months after GFD, AST-0 – aspartate transaminase at baseline, AST-6 – aspartate transaminase 6 months after GFD, AST-12 – aspartate transaminase 12 months after GFD, GGT-0 – γ-glutamyl transferase at baseline, GGT-6 – γ-glutamyl transferase at 6 months after GFD, GGT-12 – γ-glutamyl transferase at 12 months after GFD
Discussion
The pooled global prevalence of CD is 1.4% [14], while the prevalence in the Western region of Saudi Arabia is 3.2% [15]. Elevated transaminase levels in CD patients is estimated to be between 36% and 47%, which is comparable to the findings obtained for the present cohort [6, 10]. The pathogenesis of liver injury in CD is not fully understood, but it may be a product of gluten sensitization and tissue transglutaminase autoantibody-induced liver damage [16]. Support for this theory is the consistent observation of a transaminase response to a GFD in various adult and pediatric studies on CD [6, 10]. Another hypothesis is the increased intestinal permeability in CD to various antigens, cytokines, and toxins that leads to exposure of the liver immune cells to those antigens and mounting an immune response [17-19]. CD has been described in association with non-alcoholic fatty liver disease (NAFLD) and autoimmune hepatitis (AIH), which may further contribute to the pathogenesis of CD-induced liver injury, although those entities are still considered separate from CD-induced liver injury [6, 11, 20-22].
In line with the outcomes of some other study cohorts, the present data show that a GFD reverses high transaminases in patients – and hence liver injury – within the first 6 months of commencement. Nevertheless, the relationship of a GFD to transaminase level improvement does not seem to be linear, because there was no further improvement observed at 12 months. Also, there was no significant difference between the adherent and non-adherent groups (measured by tTG level). It should be noted that the present data showed a propensity for ALT normalization over AST or GGT. This may be explained by the fact that ALT is historically considered hepatocyte-specific, and thus may reflect the direct effects of gluten sensitization on hepatocytes [23, 24]. Furthermore, ALT is a cytosolic enzyme, in contrast to AST, which occurs in both the mitochondria and cytoplasm [23, 25]. GGT comes mainly from cholangiocytes, which seem to be less affected by gluten sensitization than hepatocytes, but could be affected by the concomitant biliary disorders rarely seen in association with CD [6, 11, 21]. These differences may contribute to a pathophysiologic explanation of the GFD effect on enzymes yet to be uncovered.
Histologically, the liver can be completely normal in benign asymptomatic high transaminase levels, or could show “CD hepatitis” inflammation that resembles viral hepatitis [6, 11, 21, 26]. Other histological or concomitant conditions that have been described in mutual association with CD include AIH, primary sclerosing cholangitis (PSC), and primary biliary cirrhosis (PBC) [6, 11, 21]. In the present study, we had only 2 patients with GGT elevation, but in the absence of other findings relating to cholestasis (e.g., jaundice) or ultrasound abnormalities, so we assume that none had a concomitant hepatobiliary abnormality, such as PSC. These conditions do not typically change in response to a GFD [11, 21, 26]. Most of our patients did have a significant improvement in ALT levels and thus were considered to have a simple benign elevation of transaminases, or CD hepatitis. Moreover, NAFLD has been associated with CD in a number of studies [6, 21]. Similarly, NAFLD has been described in patients with DM1, with a prevalence as high as 30% [27]. This could potentially explain the varied liver function responses to a GFD in DM1 subjects of our cohort, albeit that there were no statistically significant differences. Also, hypothyroidism, often found to be associated with CD, is known to have an effect on bilirubin metabolism directly, and thus may explain the more pronounced decline in bilirubin levels compared to those of non-hypothyroid celiac patients [28].
Another interesting finding in the present cohort is the significant improvement in albumin levels following implementation of a GFD. This may be related to overall improvement in nutritional status, decreased intestinal inflammation, and increased absorptive capacity, rather than a reflection of liver injury, although this is difficult to ascertain without objective measurement of protein absorption before and after GFD commencement. Another potential mechanistic explanation of albumin level change can be derived from the observation of bovine anti-albumin antibody positivity in CD patients. [29] A study by Essrani et al. showed no difference in albumin levels before and after commencement of GFD, although the sample size was comparatively small, and consisted of patients with cirrhosis rather than simple CD hepatitis. [30] Thus, the present findings may be quite significant, but further research is warranted to fully confirm the GFD effects on albumin levels.
The strengths of the present study include the relatively large sample size and the availability of biochemical data at diagnosis, during the GFD, and throughout the study period. A potential limitation of the study is that age variability could have confounded the true normal range of transaminase levels. Also, the absence of histologic data may have concealed the exact pathologic cause of liver function abnormalities. We opted for a biochemical analysis only on diagnosis of CD hepatitis because all patients responded to a GFD; the backup plan of obtaining a liver biopsy was always available if patients did not respond favorably to a GFD.
Conclusions
In conclusion, a benign asymptomatic elevation of transaminase levels was found to be common in CD patients. The most common enzyme abnormality was elevated AST, followed by elevated ALT. A decline in ALT level was found to be the most robust response to a GFD. However, GFD adherence and ALT levels do not seem to correlate well, especially at 12 months following commencement. Albumin levels seem to improve on a GFD, perhaps because of a decrease in intestinal inflammation, rather than hepatic inflammation.


