
Summary
The vast majority of studies on model cell samples have been conducted particularly in high magnetic fields. This work is dedicated to expanding the research area to include low-field research for multiparametric characterization applying 2D T1-T2 and D-T2 experiments, providing independent and complementary parameters. We hereby present its application to model cell systems, including in suspensions with low cell concentrations, with the suggestion of extending the application to other cell systems.
Introduction
Nuclear magnetic resonance is a powerful method for the non-invasive study of a wide range of objects, from porous glasses, silica gels, cements, rocks, clays, and polymers to cells and tissues [1–3]. With a pulsed field gradient (PFG) sequence, molecular diffusion can be examined by applying magnetic field gradients without the need for any chemical or isotopic tracers [4].
A yeast cell suspension constitutes a model cell system which has been examined by means of nuclear magnetic resonance (NMR) using one-dimensional PFG sequences [5–9] and a two-dimensional PFG-IR experiment [10]. A new method has recently been proposed to determine the self-diffusion coefficients of extracellular fluid, cytoplasm and cellular organelles, as well as compartment sizes [11, 12]. Thus, the diffusion coefficients for intracellular and extracellular water compartments were measured.
In the present study, yeast cell suspensions were characterized by means of 1H LF NMR relaxometry. D-T2 correlation maps were used to distinguish proton signals from different water environments without using any contrast reagents; thus diffusion coefficients from intracellular and extracellular spaces were extracted. From T1-T2 correlation maps, T1/T2 ratios were calculated and compared for samples with different yeast to water ratios. It is worth emphasizing that relaxation time measurements using a low-field system allowed information to be obtained which was related to the dimensions of porous spaces and was practically uninfluenced by diffusion. According to our knowledge, the vast majority of studies on model cell samples have been conducted particularly in high magnetic fields.
Aim
This study aims to expand the research area to include low-field research for multiparametric characterization applying 2D T1-T2 and D-T2 experiments, providing independent and complementary parameters. The proposed approach was developed and implemented for porous and heterogeneous systems [12–14]. We hereby present its application to model cell systems (including in suspensions with low cell concentration) with the suggestion of extending the application to other cell systems, such as stem cells.
Material and methods
NMR measurements of free and restricted diffusion
Self-diffusion or molecular diffusion is the random translational motion of molecules or ions occurring due to their thermal energy. If this process is isotropic and unrestricted, the distribution of molecules’ positions at a given time is Gaussian. Mean squared displacement is then proportional to time, which is expressed by the Einstein-Smoluchowski equation:
where: r0, r1 = initial and final position of molecule at time of observation td, D = diffusion coefficient and n = number of dimensions.
The pulsed field gradient NMR method allows the study of translational diffusion in a non-invasive way. In a spin echo sequence, two diffusion gradients are applied in order to dephase diffusing spins. Measured signal attenuation is proportional to the type of nucleus, amplitude of applied gradients, diffusion of the spins and the sequence parameters as follows [15]:
where E = echo attenuation, γ = gyromagnetic ratio, g and δ = amplitude and width of diffusion gradients, respectively; Δ = interval between diffusion gradients.
If molecules diffuse in restricted spaces such as in porous materials or biological systems, for a sufficient time, deviation from relation (1) is observed and the so-called apparent diffusion coefficient is measured. The mathematical expressions required to model restricted diffusion are generally complex and approximations for simple geometries are often used.
It is worth mentioning that, besides the geometrical restrictions influencing diffusion, there can also be other factors. Water molecules moving in the macromolecular solution in the cells’ cytoplasm collide with organelles and larger molecules such as proteins and may also interact with protein hydration shells. These effects are averaged at the time of the experiment, but they influence the measured value of the diffusion coefficient [16, 17].
Methods
For preparation of the yeast samples, fresh baker’s yeast (Saccharomyces cerevisiae) obtained commercially (Lallemand) was suspended in demineralized water and left to equilibrate for 1 h at 25°C before NMR experiments. Samples were prepared with the following ratios of fresh yeast to water (y:w): 3.7 : 1, 3 : 1, 1 : 10 and 1 : 50. The sample of ‘as obtained’ yeast had a fresh to dry mass ratio of 3.4. Additionally, for the sample with y : w of 1 : 50 measurements were conducted on a sediment acquired after the incubation of the sample overnight. In this sample, a residual amount of water, visible as a separated fraction, was also left. The mean volume of the examined samples was 14 ml with the exception of the sediment from sample (1 : 50) which had 1 ml. Table I summarizes the sample parameters and water percentages.
Table I
Fresh yeast to added water ratio (y : w), fresh yeast and water mass percentages
The T1-T2 and D-T2 complementary NMR experiments were conducted on a Magritek Rock Core Analyzer with a 2 MHz resonance frequency for 1H at a 0.05 T magnetic field using the Q-sense RF coil (ID = 29 mm for T1-T2 maps and ID = 54 mm for D-T2 maps). T1-T2 experiments were performed using a consecutive inversion recovery (IR) sequence to encode T1 with increasing T1 delay and a Carr-Purcell-Meiboom-Gill (CPMG) sequence, applied for detection of the signal. For 2D diffusion experiments, a diffusion weighted PGSE (pulsed gradient spin echo) sequence was applied with an increasing gradient amplitude to 0.5 T/m and CPMG sequence for detection. For the CPMG sequence, the echo time (TE) was 60, 100 or 400 μs. Gradient impulse length was set to 6 or 9 ms with a separation time of 20 ms. Data were then analyzed using an inverse Laplace transform (ILT) with the FISTA algorithm [18].
Results and discussion
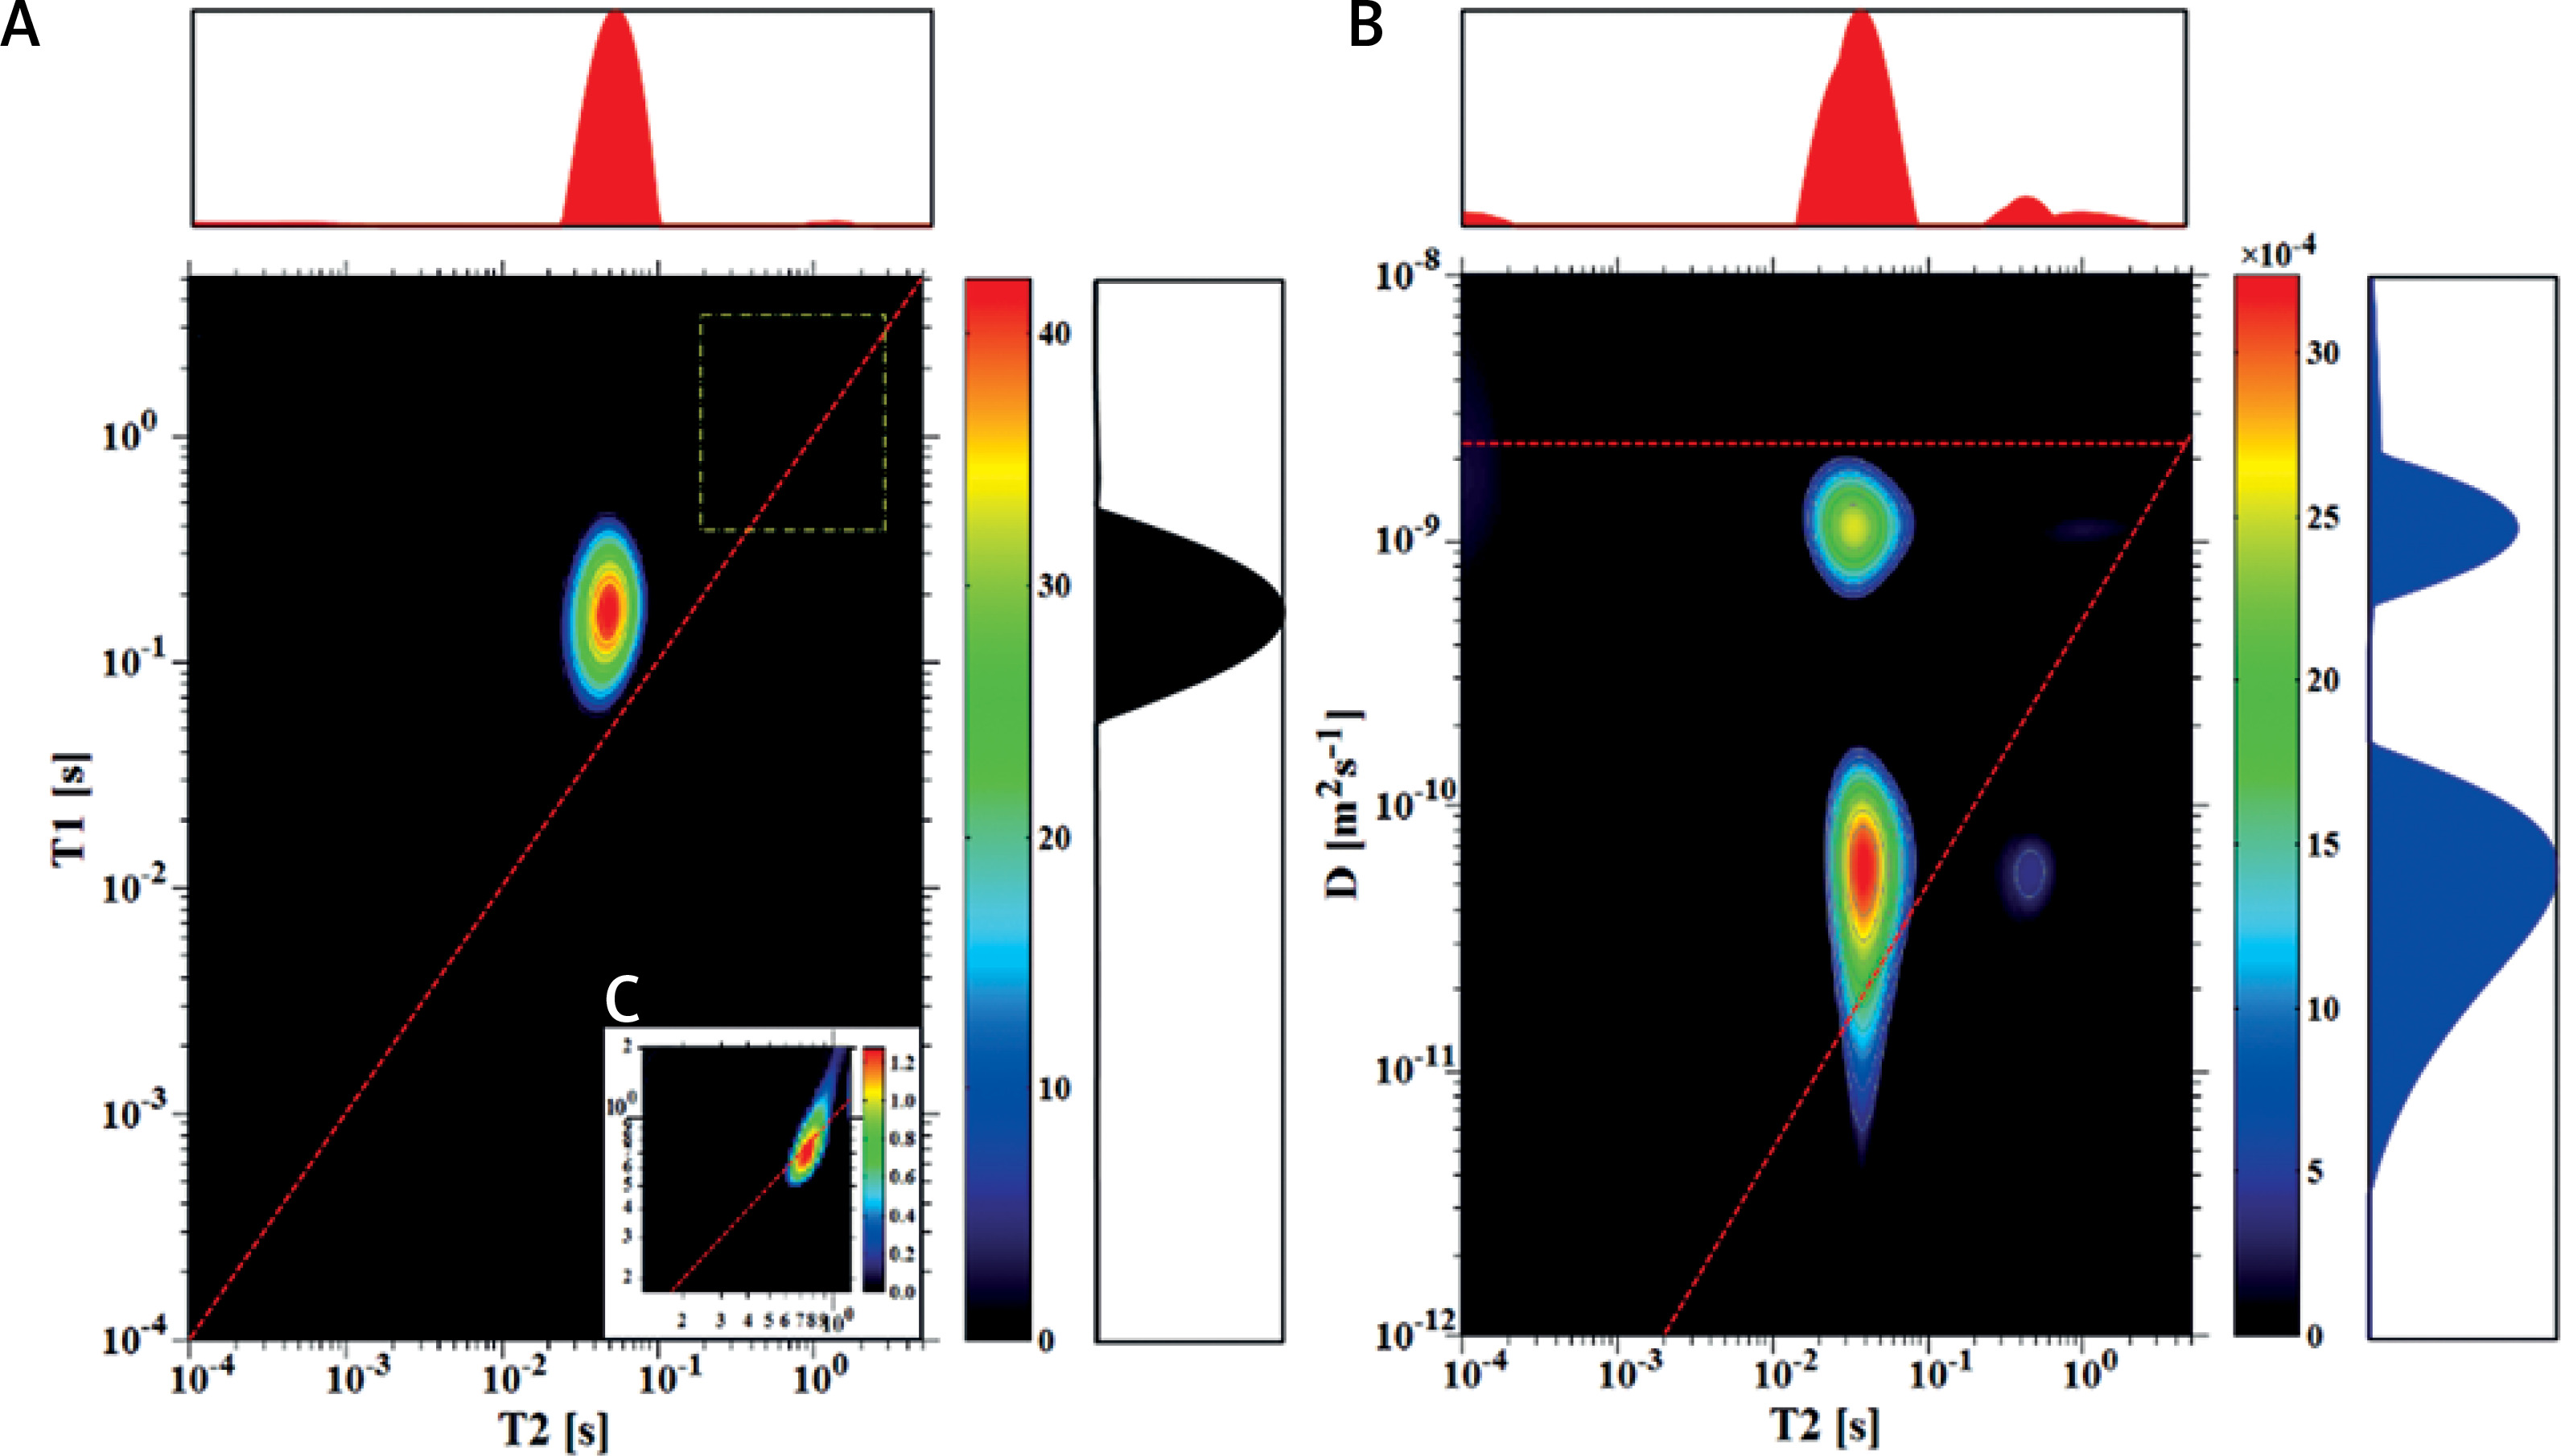
T1-T2 and D-T2 correlation maps are shown in Figures 1–4 for the chosen samples with the ratio of fresh yeast to added water (y:w) as follows: 3.7 : 1, 3 : 1, 1 : 10 and 1 : 50. For sample (3.7 : 1), in Figure 1, a peak with T2 of 44.4 and T1 of 158 ms dominates the T1–T2 map. The slight signal with T2 of 712 ms and T1 of 737 ms is visible only after zooming into this particular area. On the D-T2 map we can observe two peaks with T2 of 32.7 ms and 38.4 ms having apparent diffusion coefficients of 1.3 × 10⁻⁹ m2s–1 and 7.2 × 10⁻¹¹ m2s–1, respectively. We identified these signals as being derived from extracellular (EC) and intracellular (IC) spaces. Comparing T1-T2 with the D-T2 map, it is clearly visible that the signals from these two compartments are superimposed on the T1-T2 map. A slight signal with T2 of 567 ms and D of about 1.1 × 10⁻⁹ m2s–1 is also visible as for the T1-T2 map. This peak, which is far below 1% of the total measured signal, is interpreted as coming from a more mobile water fraction. Additionally, a peak with a diffusion coefficient as small as for IC water but with a longer T2 may also be observed on the D-T2 map. Its origin is unclear and will be discussed later in the article.
Figure 1
T1–T2 map (A) and D-T2 map (B) for the sample with y : w weight ratio of 3.7 : 1; C – enlarged region of map A, marked with a dotted yellow line
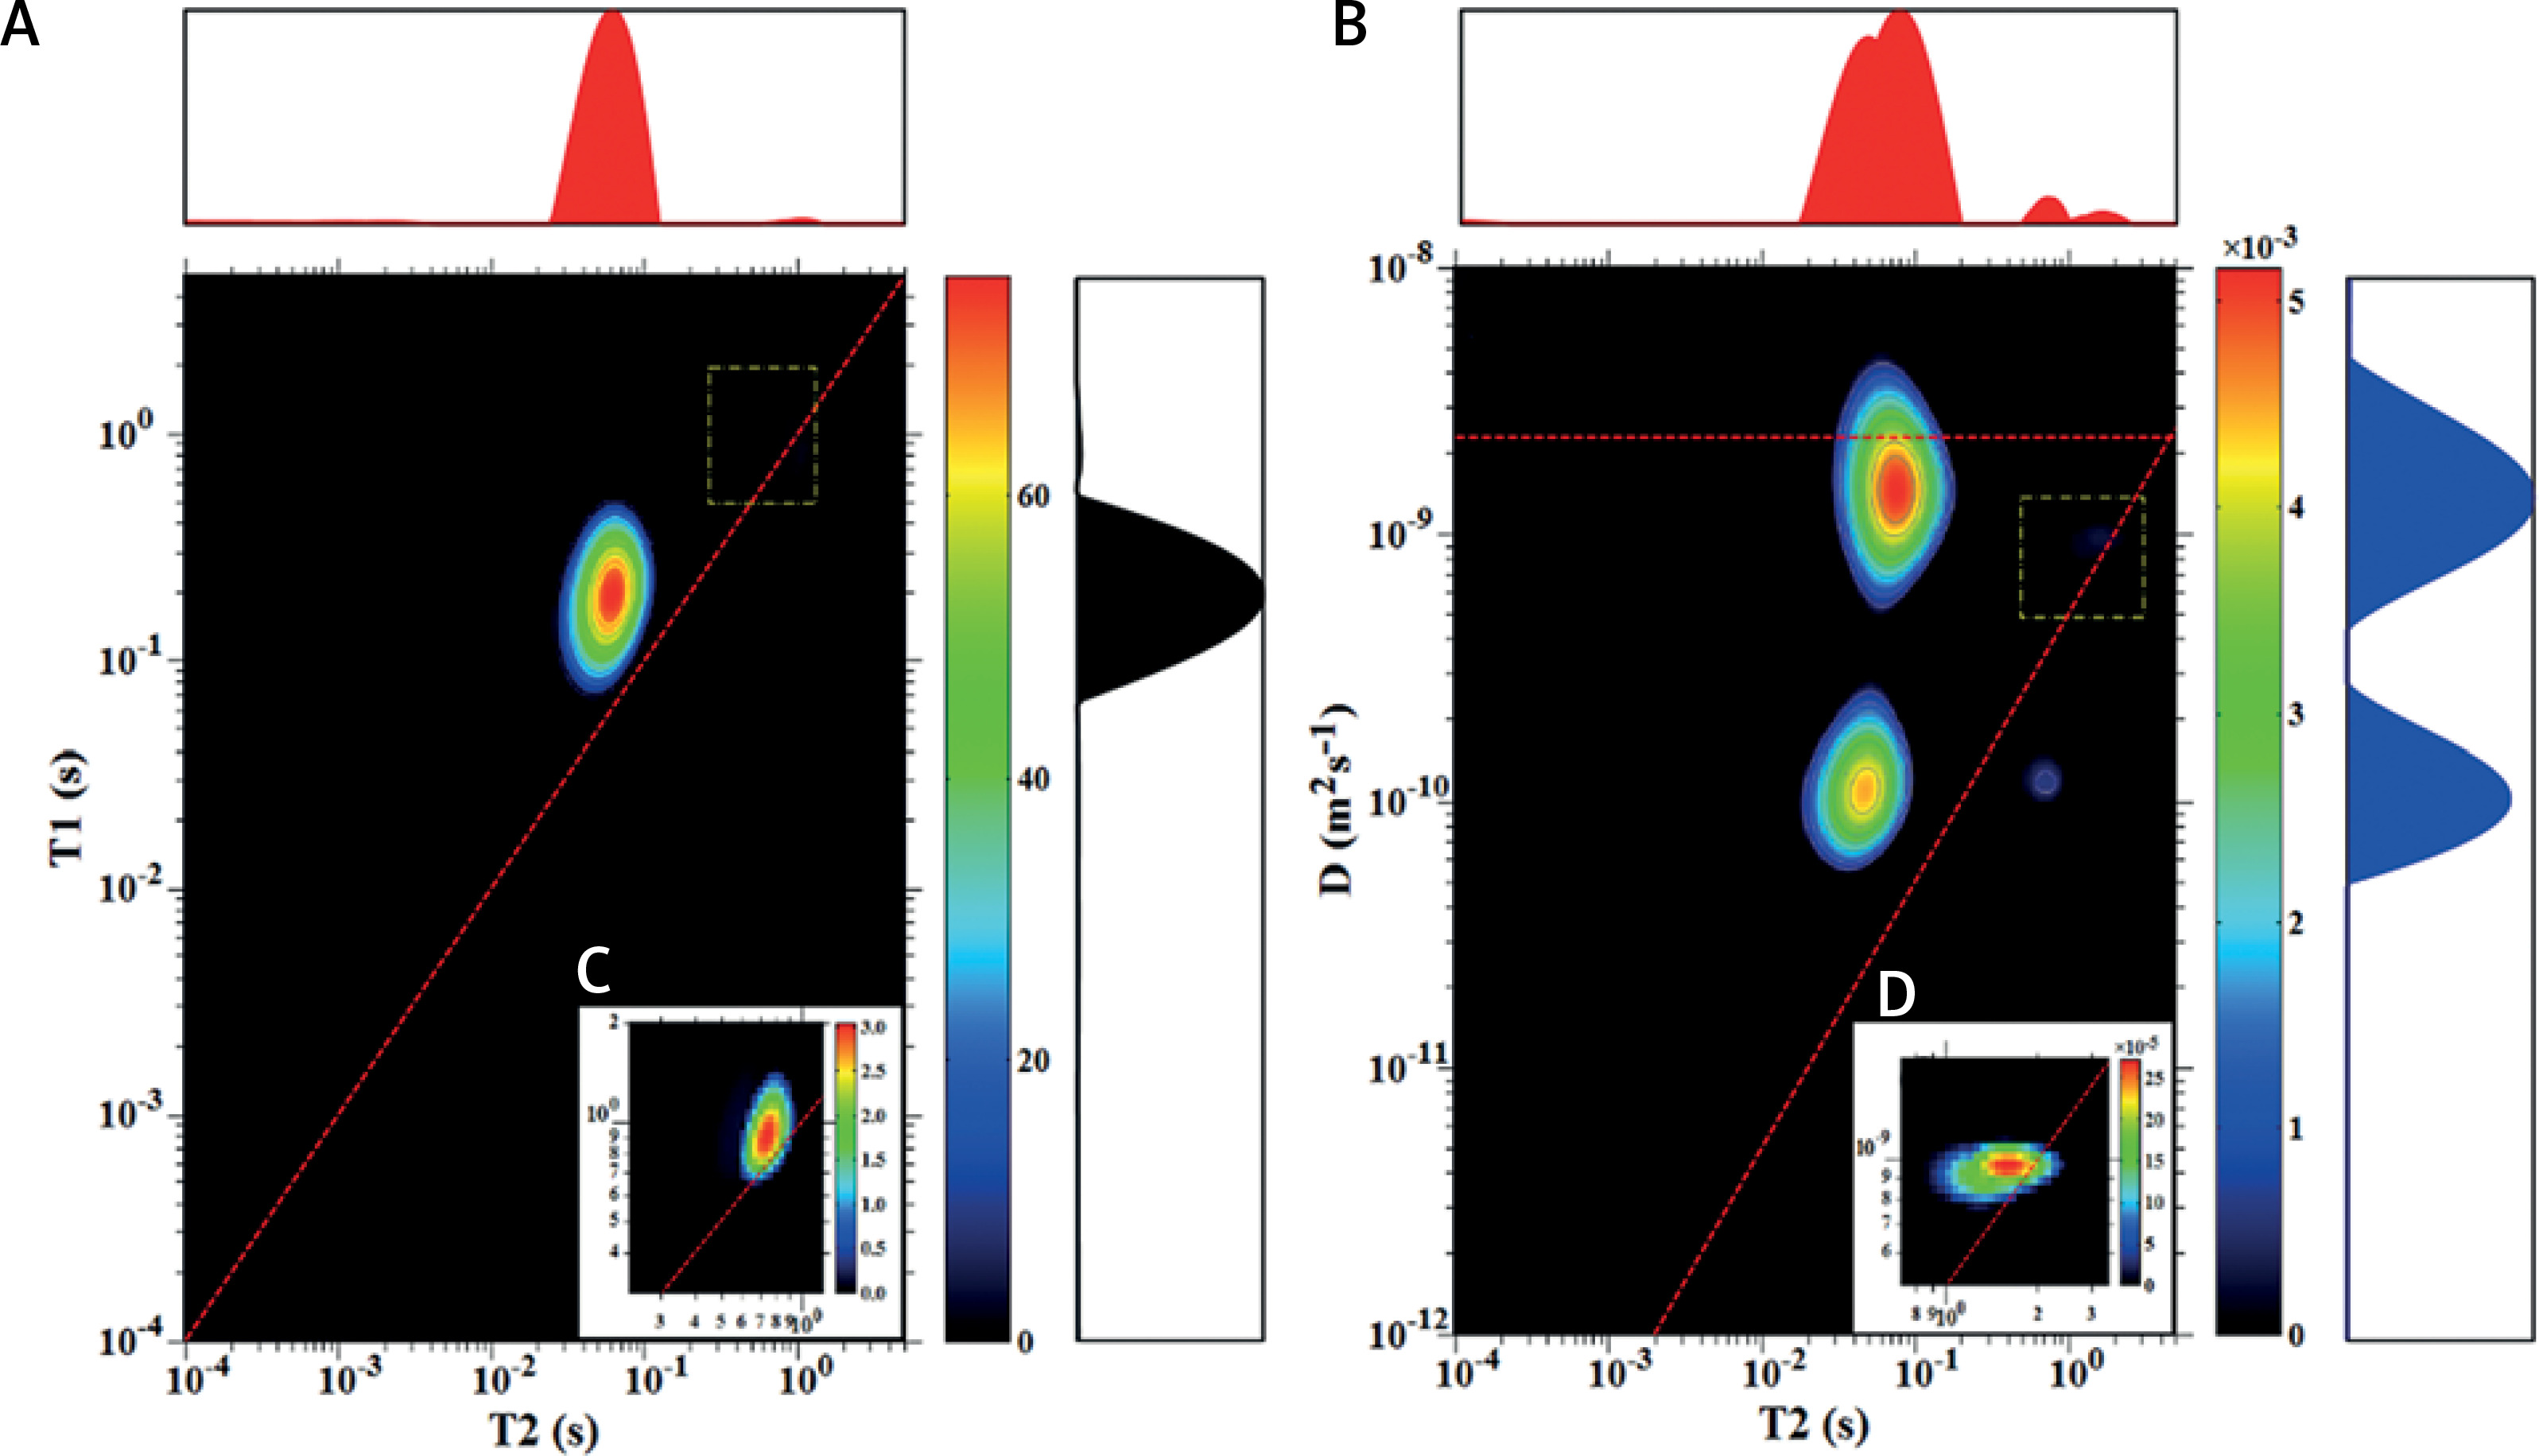
For sample (3 : 1) we observed the same peaks on T1-T2 and D-T2 maps (Figure 2). Their T2 and T1/T2 values and diffusion coefficients are listed in Tables I and II. Peaks are characterized by similar positions to sample (3.7 : 1), but we can observe an inverse proportion between EC and IC peak intensity. The peak for EC water is higher than for IC because of the additional amount of added water in comparison to sample (3.7 : 1).
Table II
Relaxation times from T1-T2 maps for different water environments
| No. | Sample (y : w) | More mobile water environment | More restricted water environment | Water (w/w %) | ||||
|---|---|---|---|---|---|---|---|---|
| T2 [ms] | T1 [ms] | T1/T2 | T2 [ms] | T1 [ms] | T1/T2 | |||
| 1 | 3.7 : 1 | 712.3 | 736.7 | 1.03 | 44.4 | 158 | 3.5 | 90.6 |
| 2 | 3 : 1 | 727 | 886 | 1.22 | 59.2 | 178 | 3.0 | 91 |
| 3 | 1 : 10 | 651 | 848 | 1.3 | 42.8 | 178 | 4.2 | 98.9 |
| 4 | 1 : 50 | 3116 | 3980 | 1.28 | 34.1 | 182 | 5.3 | 99.8 |
| 5 | 0.7 : 1* | 300; 2590 | 365.9** | 1.23 – | 42.3 | 85.4 | 2.1 | 95.0 |
Figure 2
T1-T2 map (A) and D-T2 map (B) for the sample with y : w weight ratio of 3 : 1; C, D – enlarged regions marked with a dotted yellow line on maps A and B, respectively
In Figure 3, maps for sample with a y : w equal to 1 : 10 are shown. For such a sample, with water constituting more than 97% of total mass, the signal from the free water dominated T1-T2 and D-T2 maps and other components were not visible, when measured with sequence parameters as for samples (3.7 : 1) and (3 : 1) (data not shown). In order to register the peak from intracellular spaces and to estimate the corresponding diffusion coefficient, longer relaxation times were suppressed by using shorter inter-experiment delays of about 350 ms and TE of 400 μs (in comparison to 3000 ms and 100 μs used for earlier discussed samples).
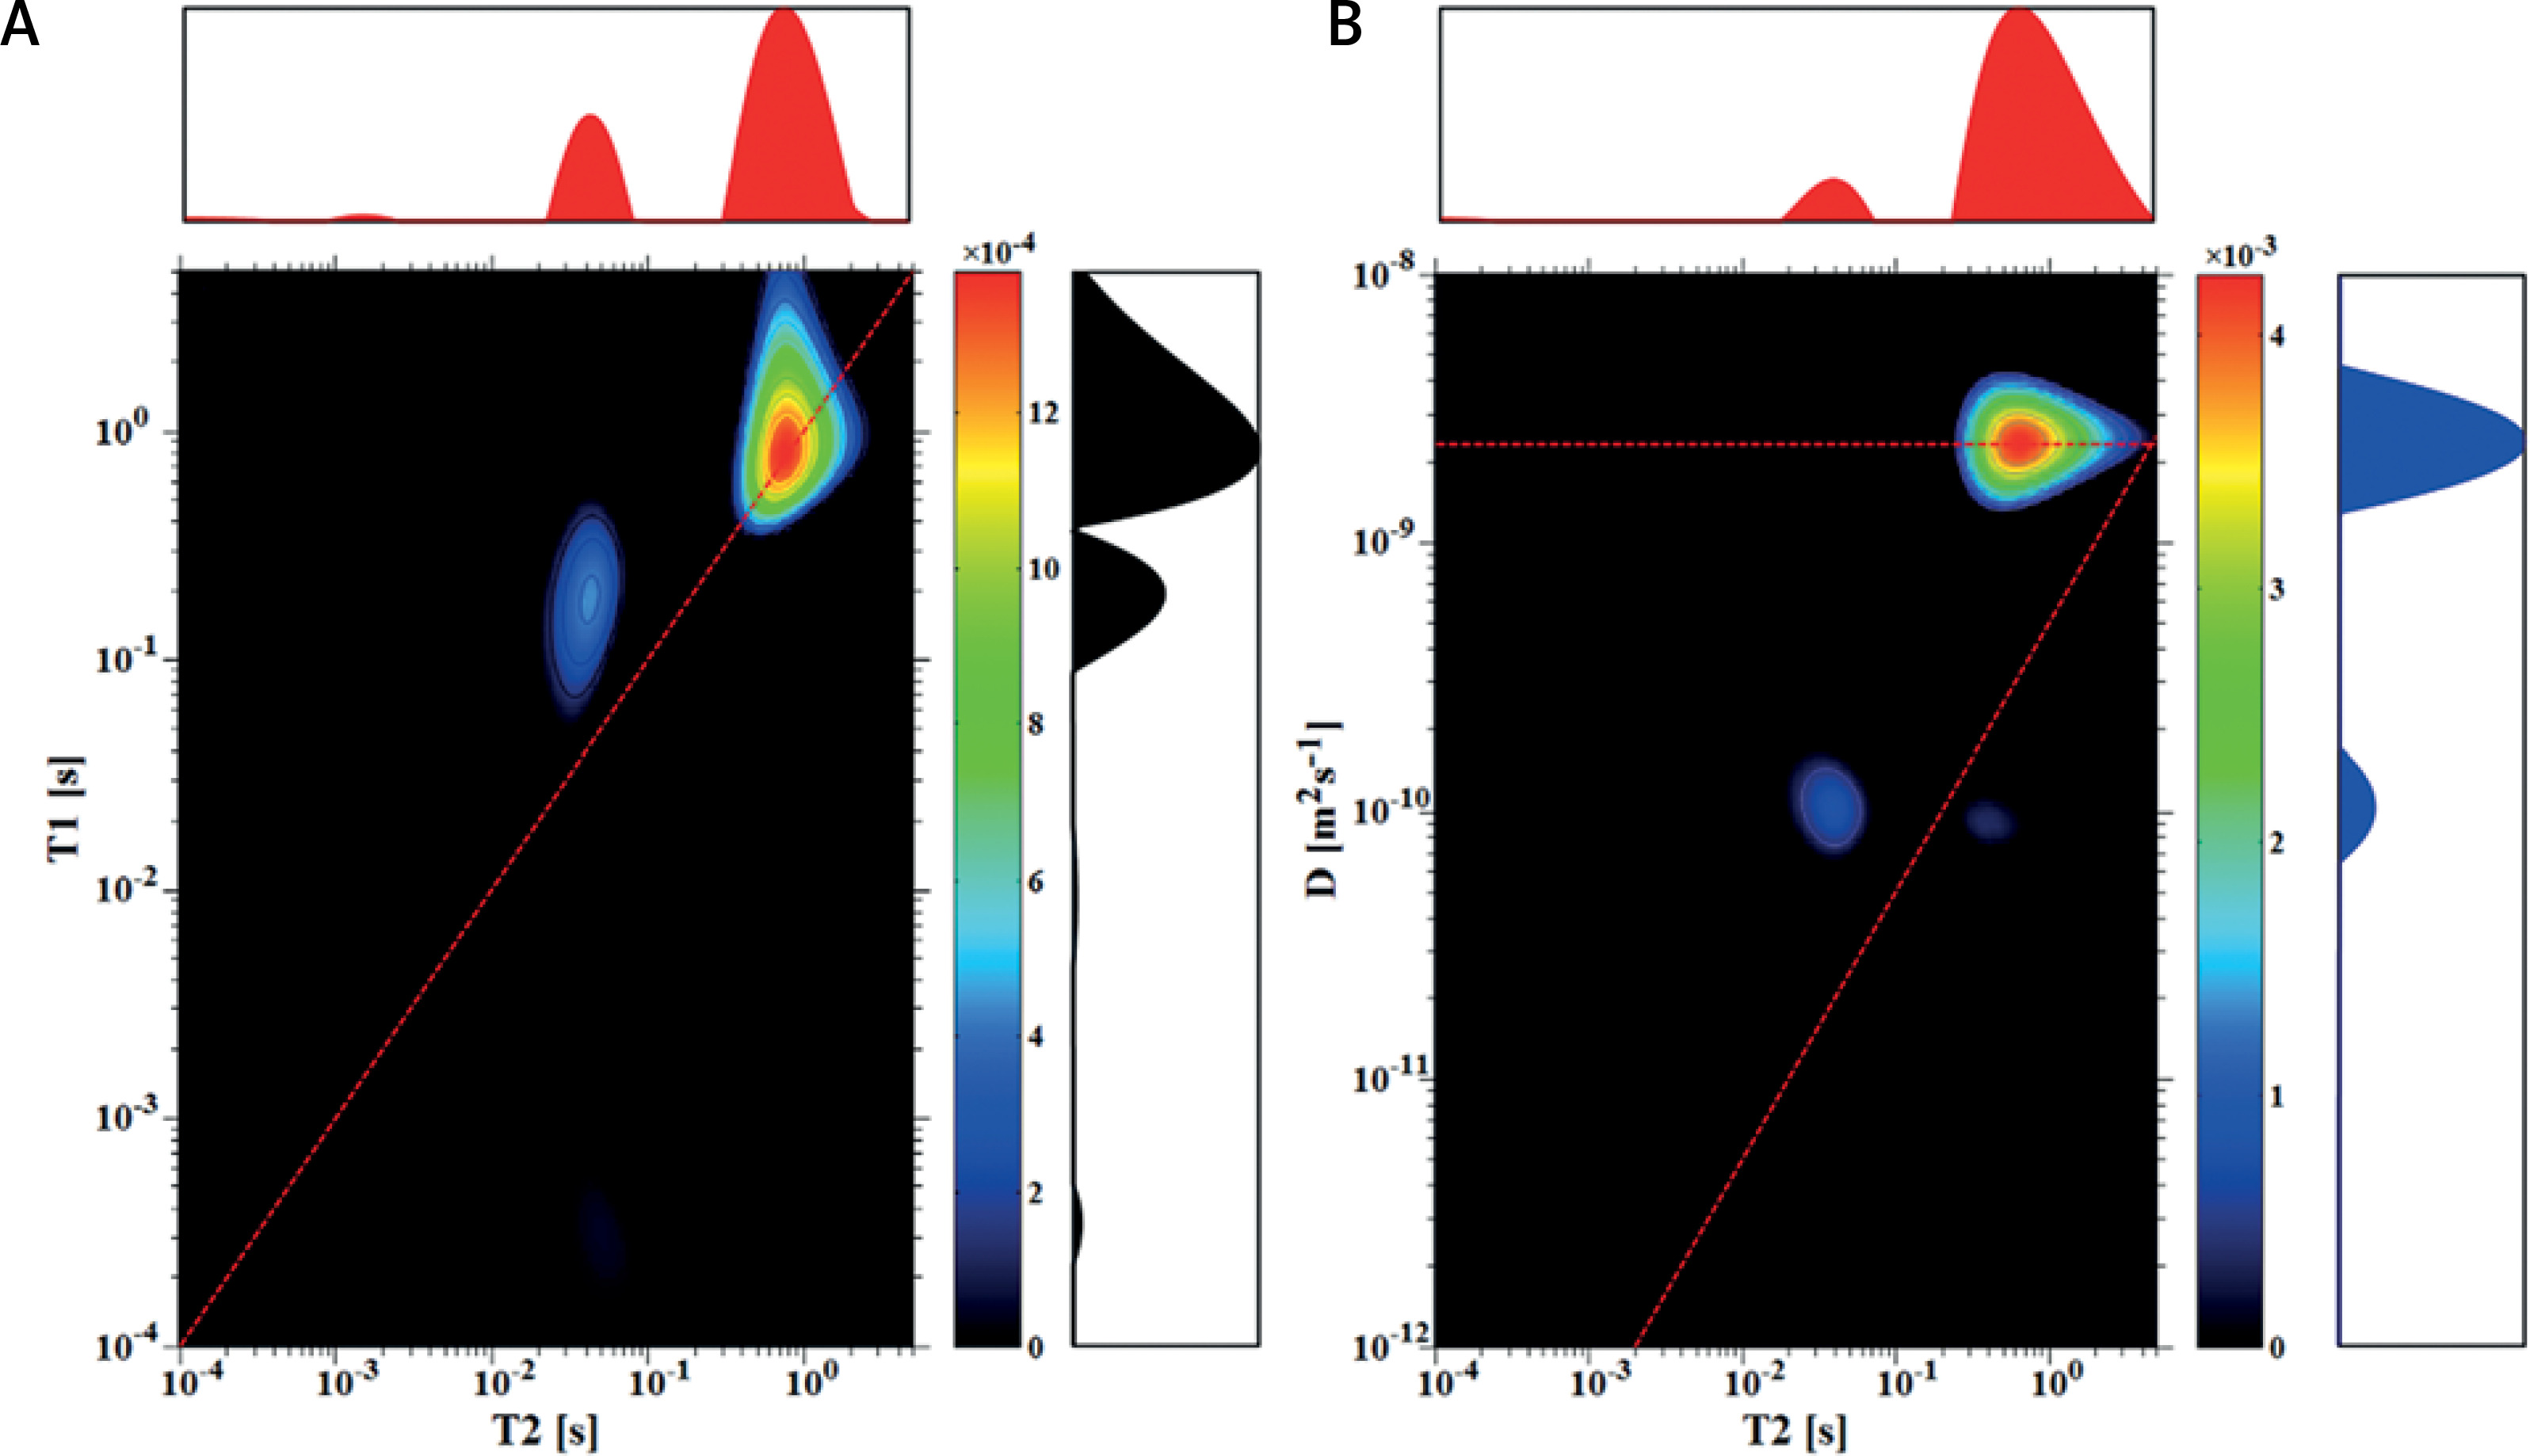
Thus, the diffusion coefficient for IC of 7.2 × 10⁻¹¹ m2s–1 was extracted for a peak with T2 of 37.4 ms. On the D-T2 map, a weak peak with a D similar to IC and a longer T2 was also registered, having a D of 6.3 × 10⁻¹¹ m2s–1 and T2 of 380 ms. The same parameters were used to measure the IC peak for sample (1 : 50) (Tables I and II). Figure 3 shows the potential for the proposed NMR measurements to detect samples with low cell suspension concentrations, such as samples with stem cells measured in vitro, which are expensive and difficult to obtain in larger amounts.
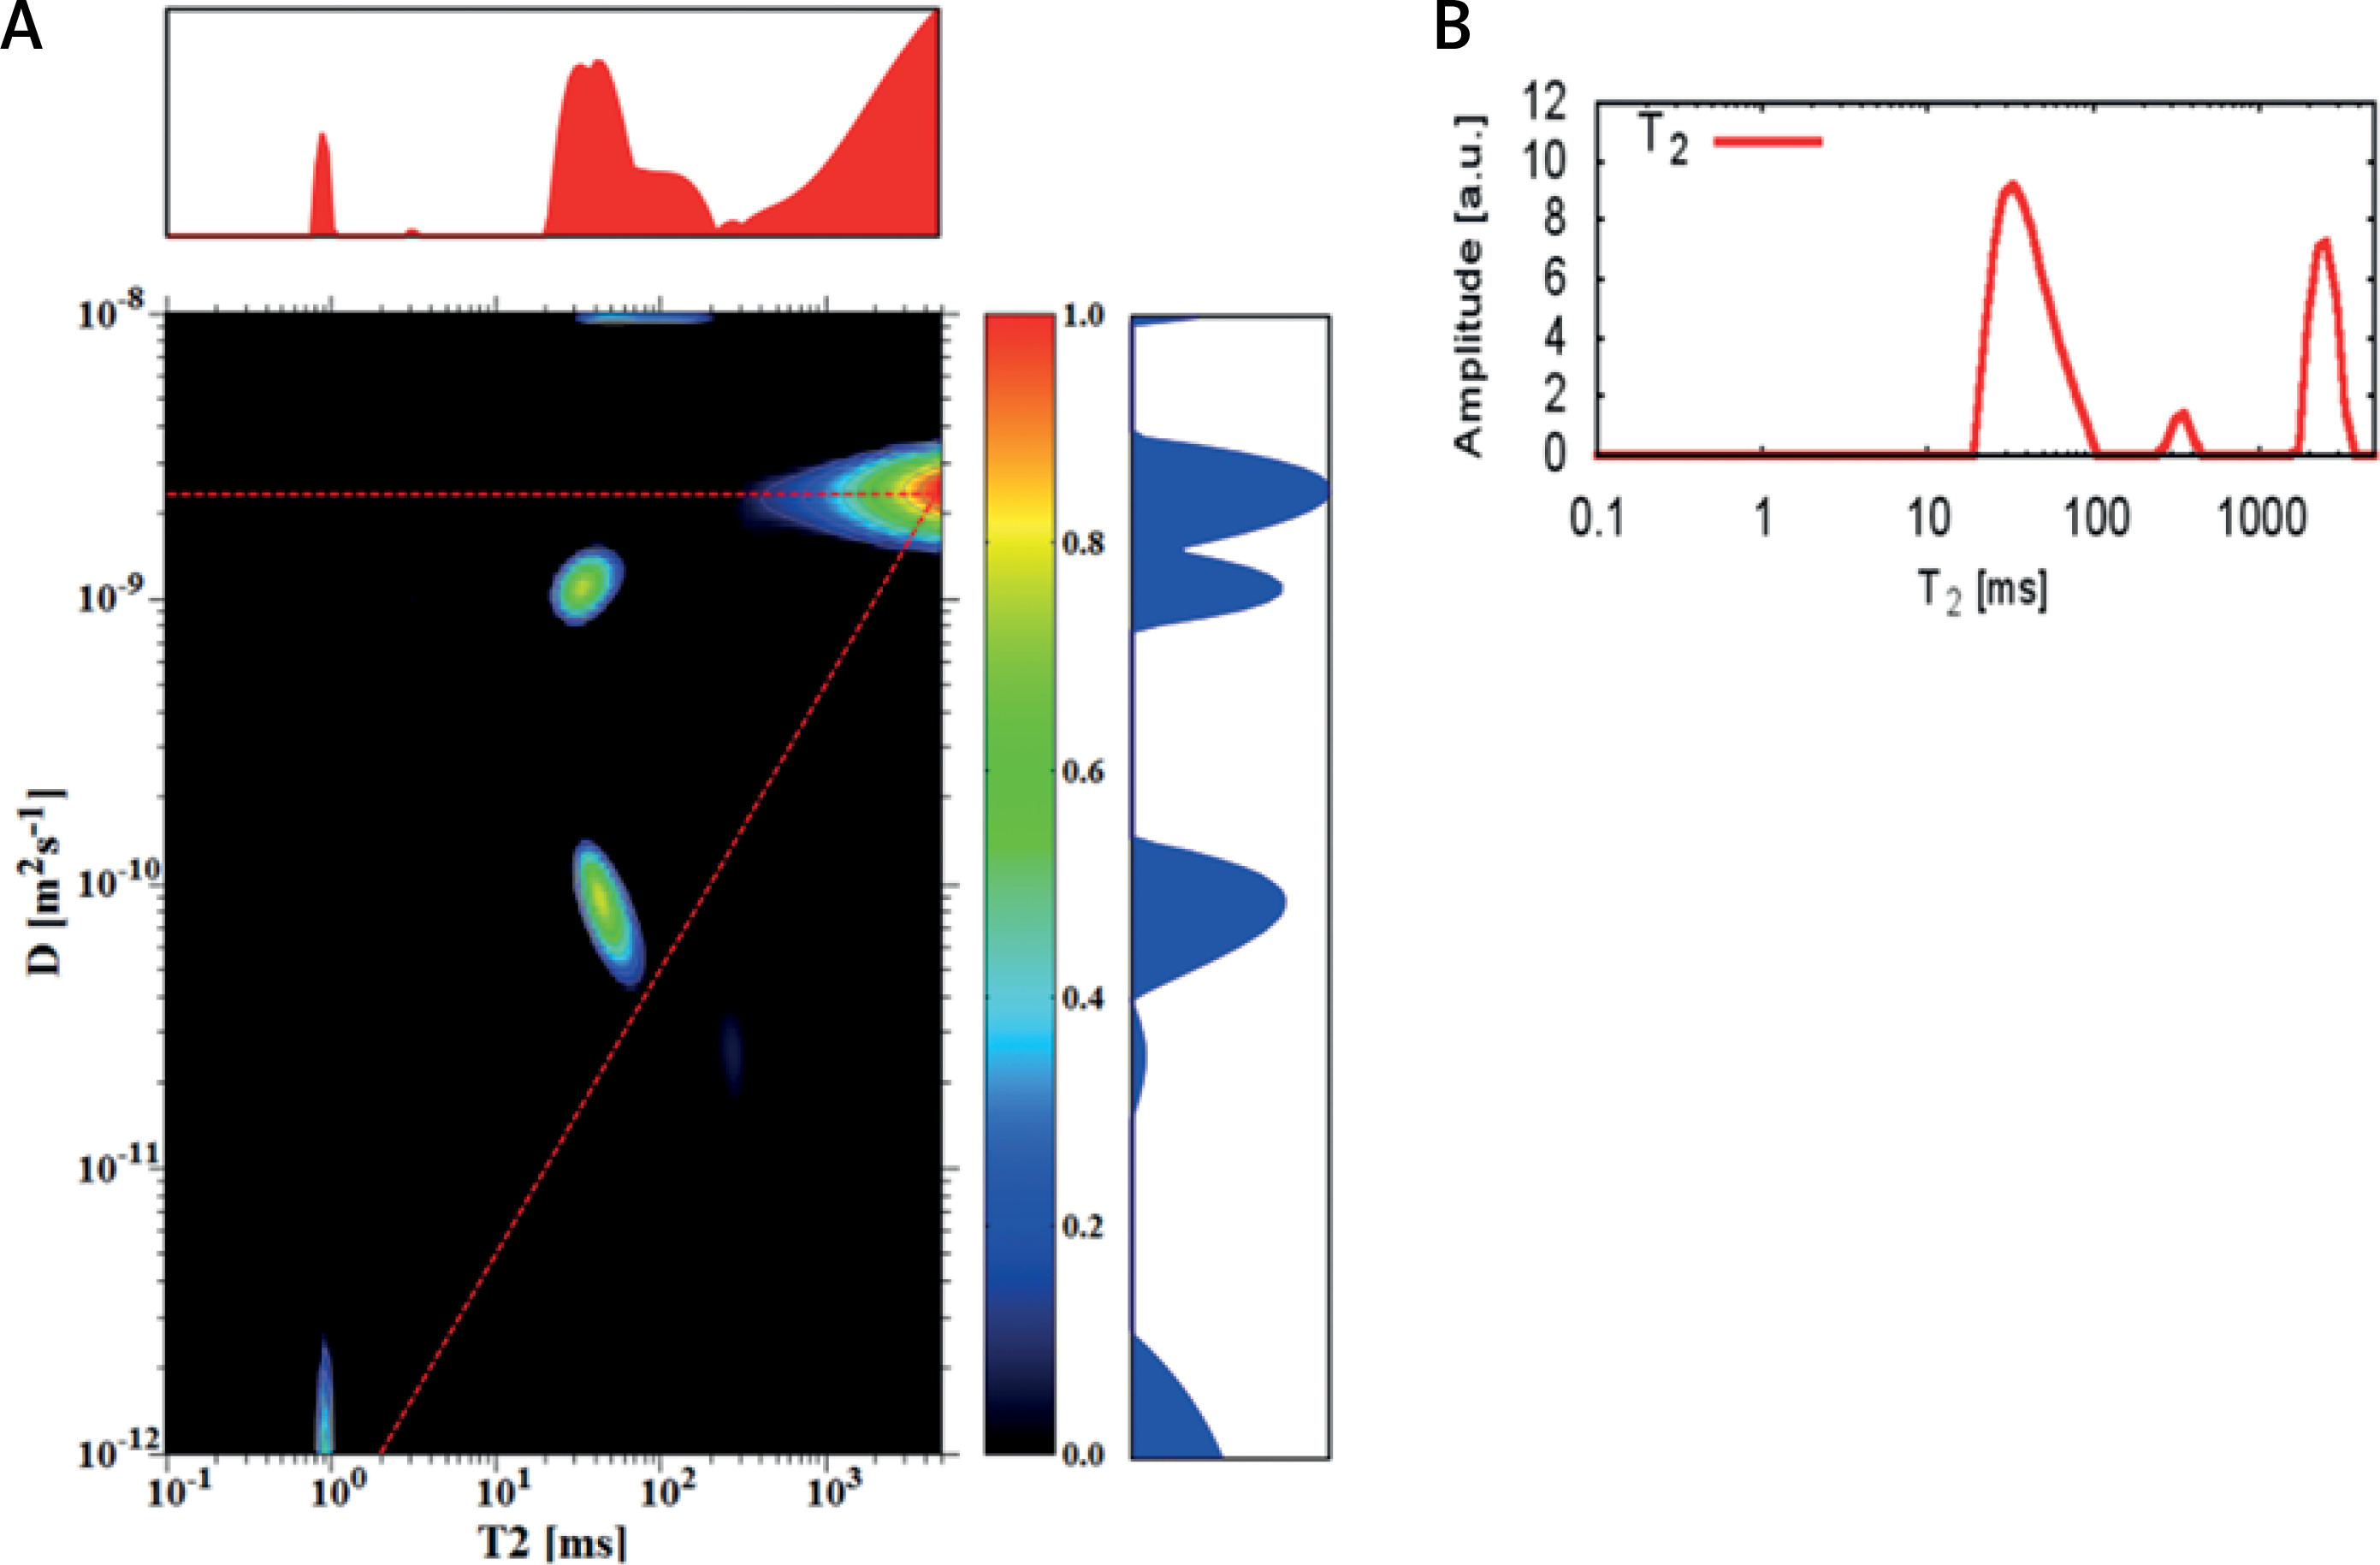
A D-T2 map was also registered for the sample which contained sediment from sample (1 : 50) and a layer of water with a total volume of 1 ml (Figure 4). For this sample peak for EC, the water compartment is visible, but with a slightly lower value of diffusion coefficient than for the earlier discussed samples. It may be related to the ratio of cell compaction within the sediment. This conclusion is confirmed by the shorter T2 relaxation time for EC than for IC, which is also influenced by the dimensions of porous spaces. The signal for a peak with a diffusion coefficient of the same order of magnitude as IC is also visible on the 1D T2 distribution. The peak from bulk water, not closed on the D-T2 map, suggests that the number of accumulations for such a small amount of sample should be increased to improve the quality of the inverted map.
Figure 4
D-T2 map (A) and T2 distribution (B) for the sediment from sample 1 : 50 with a layer of water
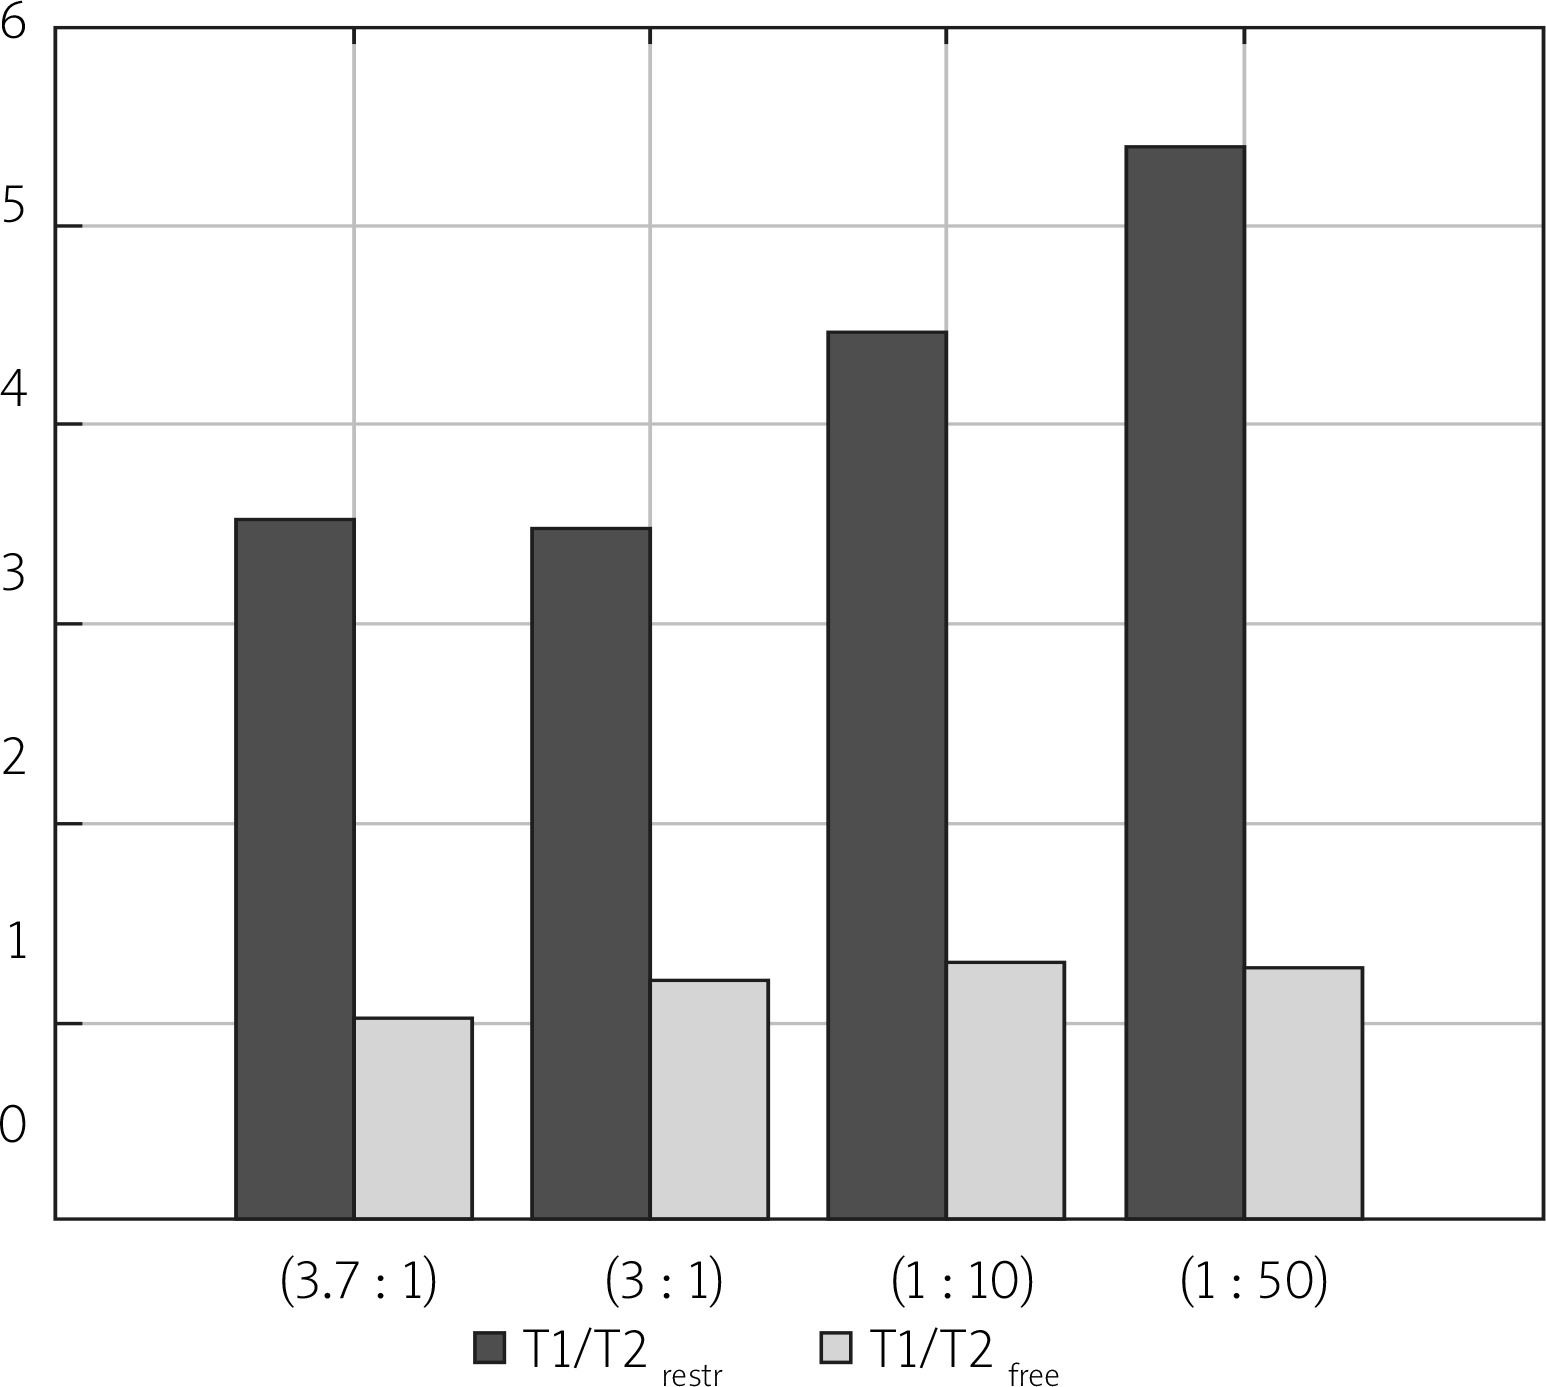
In Figure 5, diffusion coefficients for free, IC and EC water compartments are compared. For two samples with more dense packing of cells, diffusion coefficients for a more mobile water fraction and EC water are lower than for free, unrestricted diffusion, which was measured to be about 2.3 × 10⁻⁹ m2s–1. Additionally, the value of DEC slightly increases from 1.26 × 10⁻⁹ m2s–1 to 1.65 × 10⁻⁹ m2s–1 when more water is added to the sample. For a sample containing sediment from sample (1 : 50) and a layer of water, the diffusion coefficient for ‘free water’ has the same value as samples (1 : 10) and (1 : 50), but DEC is lower, as with samples (3.7 : 1) and (3 : 1). The diffusion coefficient of the intracellular space is similar for all the examined samples with the mean value of 8.4 × 10⁻¹¹ m2s–1, and does not depend on the content of added water. Identification of the origin of the peak with a diffusion coefficient close to the DIC and longer T2 relaxation times requires further study. Due to the nature of the LF relaxometry, which is almost completely insensitive to the gradients of magnetic field induced by the external field, the observed small peaks at several hundred milliseconds of T2 could be related to the water confined in larger spaces than water in the IC compartment. Avilova et al. reported the values of lateral self-diffusion coefficients of blood lipids in the range of 3 × 10–12–10–11 m2s–1, which for a diffusion time of 20 ms were close to 7 × 10–12 m2s–1 [19]. These values, similar to the observed diffusion coefficients on our maps, suggest that this peak might be related to lipid lateral diffusion. A comprehensive set of diffusion parameters for yeast suspension has also been recently introduced by Cai et al. [20]. In Figure 6 T1/T2 ratios are shown. T1/T2, calculated for the peak which is a superposition of the signal from IC and EC spaces, is higher for the samples with a higher water percentage, ranging from 3.0 for sample (3 : 1) to 5.3 for sample (1 : 50). The T1/T2 ratio for a peak descending from a more mobile water fraction is about 1. This parameter is often related to proton mobility within the studied system, having higher values for more restricted systems. The values presented in Figure 6 seem to be in opposition to this rule. However, when we take into account the fact that for samples (3.7 : 1) and (3 : 1) the T1/T2 value is influenced by both IC and EC water compartments and for samples (1 : 10) and (1 : 50) only by IC water, we see that the peak from the less restricted EC fraction lowers the T1/T2 ratio. The true T1/T2 ratio for the IC compartment has a value of about 4.2–5.3 in our study.
Figure 5
Diffusion coefficients for free, intracellular (IC) and extracellular (EC) water compartments for the examined samples, extracted from D-T2 correlation maps. Samples are ordered from the highest to the lowest y : w weight ratio
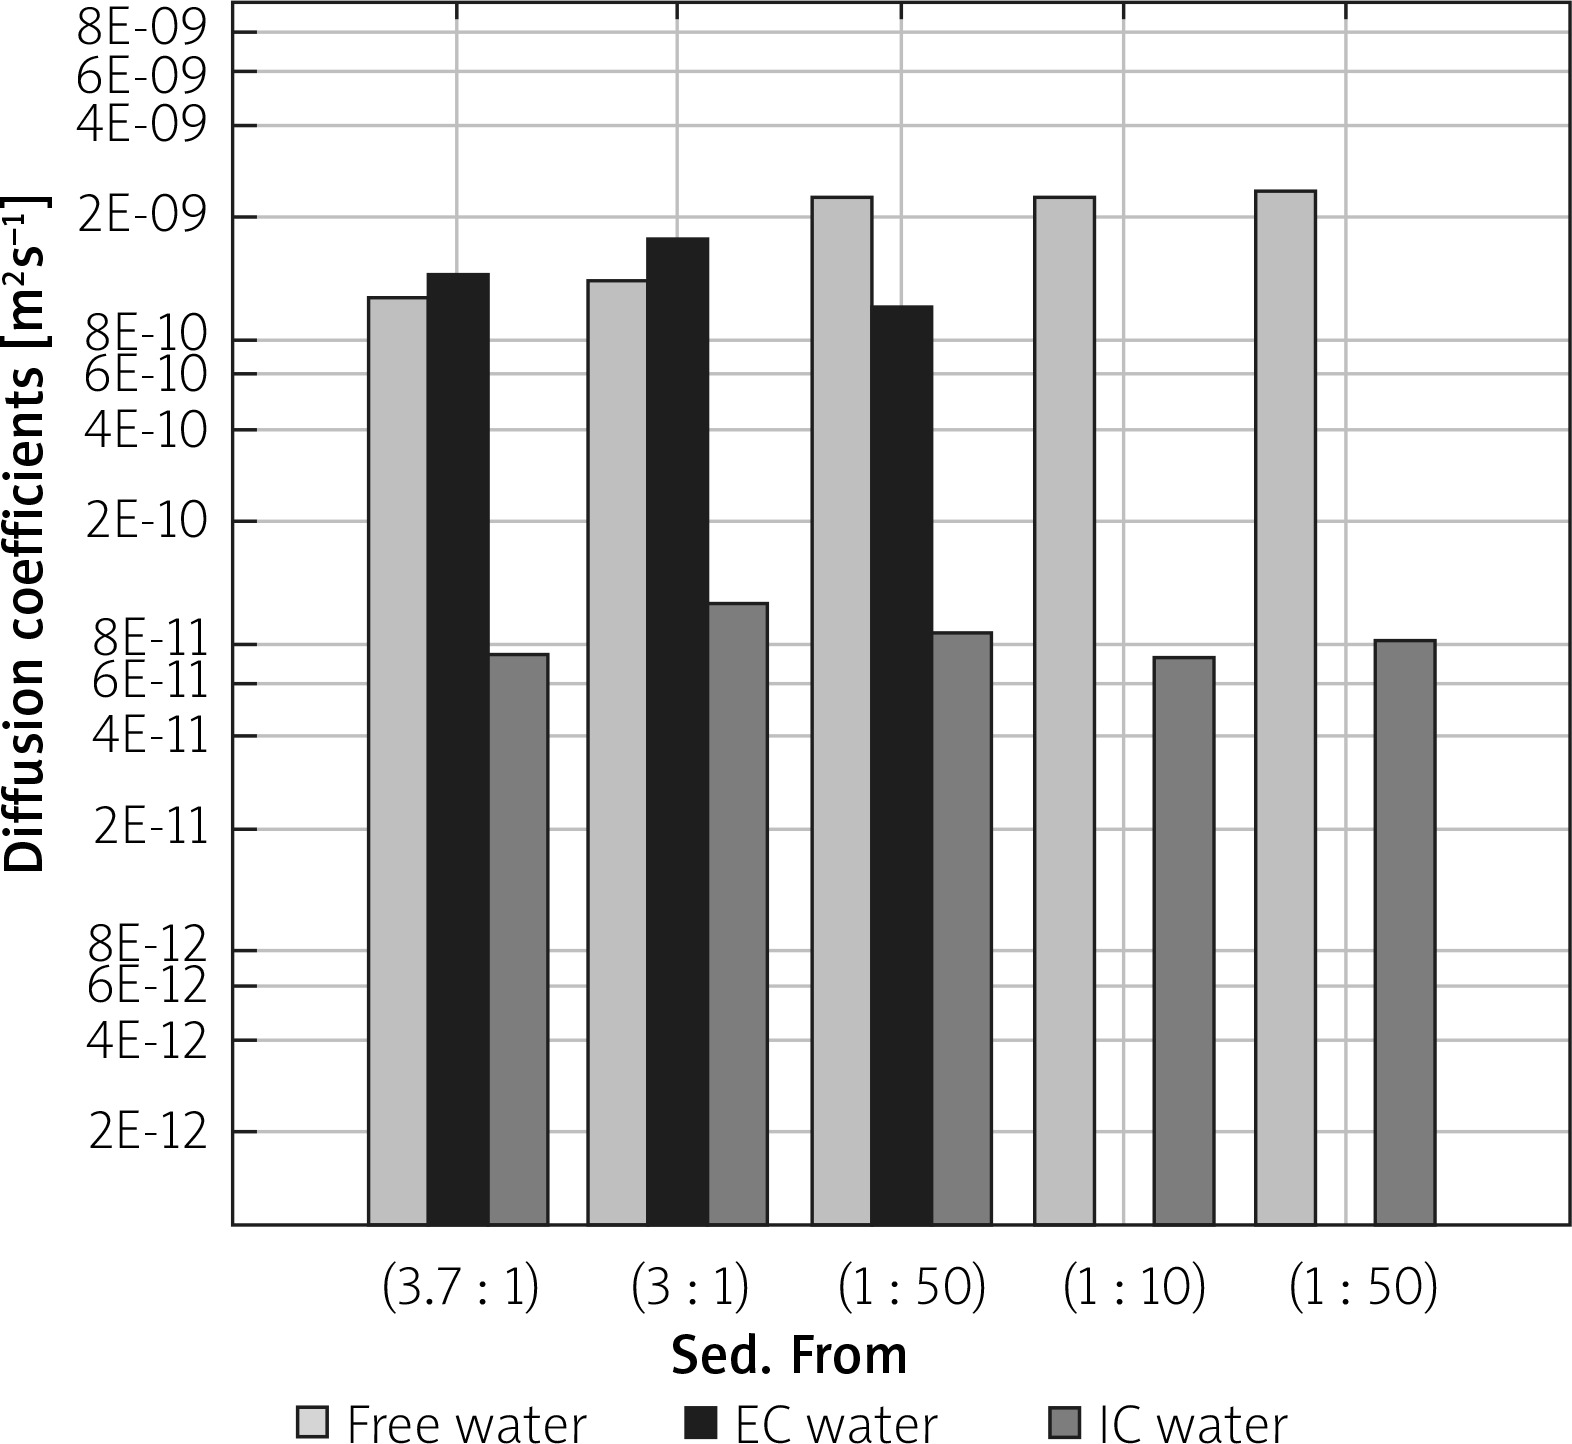
Figure 6
T1/T2 ratio acquired from T1-T2 maps for peaks related to free and restricted water environments of the examined samples. Samples are ordered from the highest to the lowest y : w weight ratio
Integrals of IC and EC peaks from D-T2 maps were used to estimate the relative water fraction in these environments (fIC, fEC) (Table III). Peaks from more mobile water fractions were also taken into account. The assumption was made that the exchange between IC and EC compartments at the time of the experiment is negligible. Due to the short diffusion time in comparison to exchange times, signals from these two compartments can be observed separately [8]. This was supported by the results from Silva et al., where the exchange time for a yeast cell suspension was equal to 420 ms [11], and from Suh et al., where exchange times were in the range of 240–470 ms [6]. For sample (3.7 : 1), water in intracellular spaces constituted 65.6% of the total measured signal, while extracellular water constituted 29.1%, whereas for sample (3 : 1) the relative proportion of water in IC and EC spaces was inverse, being 38% and 61%, respectively. For the sediment from sample (1 : 50), nearly 55% of the signal came from the more mobile water fraction. IC and EC contents constituted about 23% and 15% of the total measured signal.
Table III
Diffusion coefficients of water for three different water environments with corresponding fractions of signal on D-T2 maps (fIC, fEC, fmob)
Summary
Summarizing the results from the D-T2 and T1-T2 correlation measurements conducted on samples with different amounts of added water, the main findings can be listed as follows:
Signals from ‘free’, extracellular and intracellular water were identified on D-T2 maps. Relative water fractions for the chosen samples were estimated.
The comparison of T1-T2 with D-T2 maps allowed the claim to be ventured that signals from IC and EC spaces are superimposed on T1-T2 maps. This remark helped to explain the lower T1/T2 values for samples with a higher compaction rate as influenced by EC water and to extract the T1/T2 value for the IC space in the range of 4.2–5.3.
Diffusion coefficients for free, IC and EC water compartments were compared. Mean DIC was 8.4 × 10⁻¹¹ m2s–1 and mean DEC ranged from 1.0 × 10⁻⁹ m2s-1 to 1.65 × 10⁻⁹ m2s–1.
Conclusions
Yeast cell suspension characterizations applying complementary parameters obtained by means of 2D T1-T2 and D-T2 measurements allowed the identification of bulk, intercellular and extracellular water.
These experiments show the potential for the effective measurement of model cell suspensions such as yeasts in LF NMR relaxometry, even for low concentrations of the measured samples. This inference seems to be promising, especially for stem cell investigations using NMR biomarkers, excluding entirely external contrast agents. The proposed 2D multi-parametric characterization for these cells may be useful in their detection, when studying animal models or patients by means of MRI in vivo and in tracking changes of cell characteristics, such as viability.


