
Introduction
Gastric cancer is one of the worst cancer types, with high recurrence and mortality rates [1]. It is usually detected at locally advanced stage. Stage, histopathologic type, extent of resection, and in some studies age and gender are accepted as prognostic factors [2].
The immune system is generally given as a primary defence system against cancer by recognising and eliminating tumours before they spread. Burnet and Thomas discovered immune-editing, and showed for the first time that the immune system can compete with tumour progression [3–5]. Transiting through or residing within tumours, lymphocytes play a key role in protecting the host from tumour invasion [6]. The positive prognostic value of tumour-infiltrating T-lymphocytes and circulating lymphocytes is shown in pancreatic, colorectal, head and neck, urothelial, and lung cancer (for other organs, we could not give certain data) [7–11]. Changes in neutrophil, lymphocyte, and monocyte counts in peripheral blood, and also neutrophil-to-lymphocyte ratio (NLR) estimates have been determined as simple, applicable, cost-effective, and reliable prognostic markers [12–14]. Correlation between granulocytes and lymphocytes in the peripheral blood is closely related to these immune system cells [15]. Although the causes of systemic inflammatory response (SIR) development in cancer patients are not fully understood, hypoxia secondary to tumour necrosis due to hypoxia-induced factor 1-α pathway, alterations in neuroendocrine metabolism, synthesis of interleukin, and production of acute phase proteins have been held responsible [16].
Historically, the direct bone marrow suppression effect of radiation therapy (RT) has been shown, and this includes depletion of circulating lymphocytes. On the other hand, it has been suggested that RT has an immune-stimulating effect, as well [17, 18]. Trials including pancreatic cancer show poor survival outcome after chemo-radiation therapy (CRT) due to lymphopaenia [8]. Unfortunately, there are limited data evaluating the reason for lymphopaenia and the relation between splenic doses and immunological response, including NLR and white blood cell counts over oncological outcomes for patients with locally advanced gastric cancer (LAGC) [8]. There is only one trial that has focused on this issue for LA pancreatic cancer [19].
The purposes of the present study are to determine the effect of CRT-induced lymphopaenia, and irradiated splenic volume and splenic doses on oncological outcomes in patients with LAGC.
Material and methods
Patients and treatment
A consecutive cohort of 126 patients with LAGC (pT3-4and/or pN0-3b) treated with adjuvant CRT at Ege University Department of Radiation Oncology between 2005 and December 2016 was identified from our database. All medical records and files of patients were retrospectively reviewed. Exclusion criteria were as follows: missing laboratory evaluations for exact time points, gastrectomy operation including splenectomy [2], and lack of RT treatment planning data and follow-up information. Additionally, in order to obtain a homogenous patient cohort for accurate comparison, the patients who underwent different treatment protocols other than our departmental protocol, patients who received blood transfusions or heparin treatment within the last two months, patients with active bleeding, bleeding diathesis, hyper- or hypothyroidism, infection, disseminated intravascular coagulation, and connective tissue disorders were also excluded. Thus, 52 patients were included in the current study cohort. Research approval was obtained from the Ethics Committee of Ege University Hospital (protocol#17-5.1/9) in compliance with the Helsinki Declaration.
Pathological tumour staging was performed in accordance with the 8th edition of the American Joint Committee on Cancer [20]. All patients received 5-FU-based induction chemotherapy (CT) followed by CRT. RT was implemented by either three-dimensional conformal or a volumetric arc technique based on the department’s equipment at that time. The mean RT dose was 50 Gy (range, 45 –54 Gy) in 1.8 Gy daily fractions [19, 21–23].
Evaluation of haematological parameters
The absolute neutrophil, lymphocyte, and platelet counts were recorded prior to any treatment (baseline), just after the completion of CRT, and 2 –6 weeks after the completion of CRT (control evaluation). The NLR was calculated by dividing the absolute neutrophil count by the absolute lymphocyte count [22].
Normal absolute lymphocyte count (ALC) was accepted as the value ≥ 1 K/µl. Lymphopaenia was defined on the basis of the Common Terminology Criteria for Adverse Events, version 4.0. Grades I and II lymphopaenia (ALC between 0.5 and 1 K/µl) and grades III and IV lymphopaenia (ALC < 0.5 K/µl) were categorised as mild and severe, respectively. Neutrophil counts were evaluated according to the median baseline neutrophil status. Patients with NLRs of < 2.56, and ≥ 2.56 were accepted as SIR negative, and positive cases, respectively [21]. Haemoglobin counts were divided into two categories: > 12 g/dl and ≤ 12 g/dl.Platelet counts were also considered in two categories:< 300,000/mm3 and ≥ 300,000/mm3.
Evaluation of spleen doses
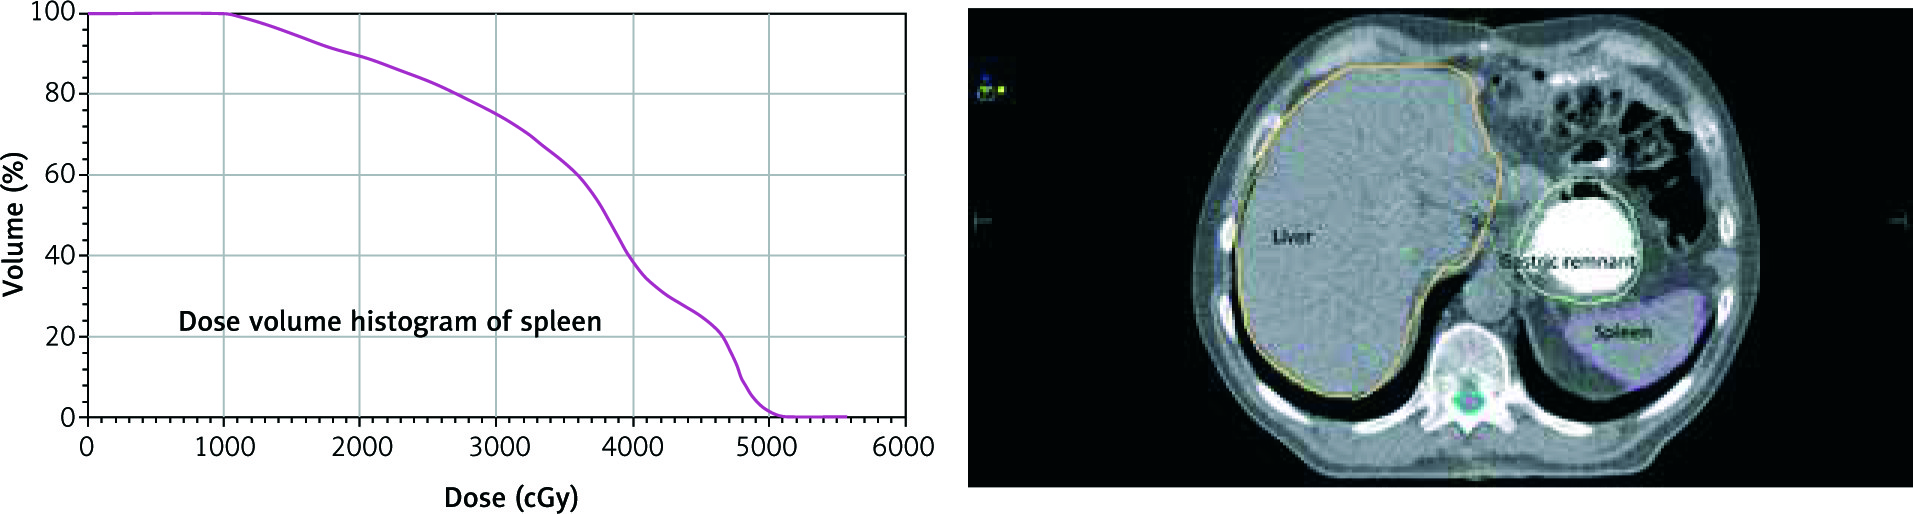
The spleen was contoured, and dose-volume histogram (DVH) parameters were obtained using the “Monaco 3.30.02 Planning System” (Elekta Medical Systems, Stockholm, Sweden) (Fig. 1). DVHs were reported in terms of mean splenic dose (MSD), and the percentage of splenic volume receiving at least 5 Gy (V5), 10 Gy (V10), 15 Gy (V15), and 20 Gy (V20). MSD, V5, V10, V15, and V20 (stratified at increments of 10%) were compared among patients with and without severe lymphopaenia [19].
Statistical analysis
Statistical analysis was performed using the SPSS statistical software package, version 23.0 (SPSS Inc., Chicago, IL, USA). A two-sided p< 0.05 was considered statistically significant. Differences between continuous covariates were compared by the Wilcoxon rank-sum test, and differences between categorical covariates were compared with Fisher’s exact test or χ2 test depending on which was appropriate. Receiver operating characteristic (ROC) analysis and relative area under the curve (AUC) statistics were used, and the ratio closest to the point with the maximum sensitivity and specificity of the measured splenic doses was selected as the optimal cut-off value both for overall (OS) and recurrence-free survival (RFS). NLR and the severity of lymphopaenia were correlated with the clinicopathological variables using the χ2 test or Fisher’s exact test (if necessary for verifying χ2 test). Survival curves were acquired using the Kaplan-Meier method, and groups were compared using the log-rank test. Univariate and multivariate analyses to identify prognostic predictors were performed using Cox proportional hazard regression models. Variables with a p-value ≤ 0.2 on univariate analysis were entered into multivariate analyses [19].
Results
Fifty-two patients with LAGC were treated with adjuvant CRT according to INT-0116 protocol [21]. The median clinical follow-up time from the beginning of first CT application was 30 months (range, 8 –130 months). Intravenous 5-FU was used for 25 (63%) patients and oral capecitabine was used for 15 (27%) patients. Patient, tumour, and treatment characteristics are shown in Table 1. No haematological or non-haematological treatment-related toxicity ≥ grade 3 according to the Radiation Oncology Toxicity Grading (RTOG) scale were detected. Distant metastasis, peritoneal recurrence, and local recurrence were seen in 15 (62.5%), eight (33.3%), and one (4.2%) patient/s, respectively.
Table 1
Patient, tumour, and treatment characteristics
The median baseline ALC was 1.82 K/µl (range, 0.65 –4.08 K/µl). The median ALC after CRT was 0.27 K/µl (range, 0.09 –2.10 K/µl). The decrease seen after CRT implementation was statistically significant (p< 0.0001). The median control evaluation time for ALC was 18 days (range, 10 –38 days) after the completion of CRT. The median ALC increased to 1.31 K/µl (range, 0.22 –3.25 K/µl) in control evaluation, which was significantly lower than baseline (p< 0.001) but higher than post CRT levels (p< 0.001). There was no severe lymphopaenia before the treatment period. The incidence of severe lymphopaenia was only 1% at control evaluation, but it was 93% after CRT (p< 0.001). The comparison results according to ALC after CRT and at control evaluation are shown in Table 2.
Table 2
Comparison of the haematologic parameters according to ALC levels after treatment and at control evaluation (Fisher’s exact test was used)
The median OS time was 24 months (range, 8 –126 months). The two, three, and four-year OS rates were 65%, 59%, and 52%, respectively. There was no statistically significant difference in OS in patients with severe lymphopaenia and SIR positivity after CRT (p = 0.75, and p = 0.31, respectively). Additionally, the severity of baseline lymphopaenia or lymphopaenia at the control evaluation had no effect on OS rates (p = 0.75, and p = 0.92, respectively).
Median RFS time was 20 months (range, 6 –120 months). The two, three, and four-year RFS rates were 58%, 55%, and 50%, respectively. No statistically significant difference in terms of RFS rates for the patients with severe lymphopaenia and SIR positivity after CRT (p = 0.58 and p = 0.39, respectively) were detected. Moreover, there was no relation between the severity of lymphopaenia evaluated at baseline and at controls with RFS rates (p = 0.97 and p = 0.74, respectively).
In univariate analysis, stage 3 disease (p< 0.001) and MDLN ratio > 20% (p< 0.001) had a negative effect on OS. In multivariate analysis for OS, stage III disease (p = 0.041) and MDLN ratio > 20% (p = 0.032) (Table 3). In univariate analysis for RFS, stage 3 disease (p = 0.001) and MDLN ratio > 20% (p = 0.011) had a negative effect. MDLN ratio > 20% was the only significant prognostic factor for RFS in multivariate analysis (p = 0.033).
Table 3
Univariate and multivariate analyses of the prognostic factors for overall survival (OS) and recurrence-free survival (RFS)
[i] CI – confidenceinterval, KPS – Karnofsky performance status, MDLN – metastaticlymphnodenumber to dissectedlymphnodenumber, AJCC – American Joint Committee on Cancer, ALC – absolutelymphocytecount, NLR – neutrophil-to-lymphocyte radio, PLR – platelet-to-lymphocyte ratio, CT – chemotherapy, CRT – chemoradiotherapy, 3DCR – 3-dimensional conformalradiationtherapy, VMAT – volumetricarctherapy, NS – not significant, a cut-offsweredefinedaccording to ROC curves, bcut-offsweredefinedaccording to RTOG CTC toxicitycriteria, ccut-offsweredefinedusing the integersclosest to the median
In the ROC analysis, the AUC for mean splenic doses was 0.741 for OS (p = 0.042) and 0.680 for RFS (p = 0.050). The optimal cut-off value for mean splenic dose was 35 Gy both for OS and RFS. The AUC for maximum doses was 0.775 (p = 0.050) for OS and 0.732 (p = 0.142) for RFS. The optimal cut-off value for maximum dose was 58 Gy both for OS and PFS (Fig. 2). Mean splenic dose ≥ 35 Gy was a significant poor prognostic factor for OS and RFS (p = 0.042 and p = 0.50, respectively). Maximum splenic dose ≥ 58 Gy effected OS unfavourably (p = 0.050). There was no significant relationship in terms of minimum, V5, V10, V15, V20, V25, and V30 doses. The splenic dose characteristics were indicated in Table 4.
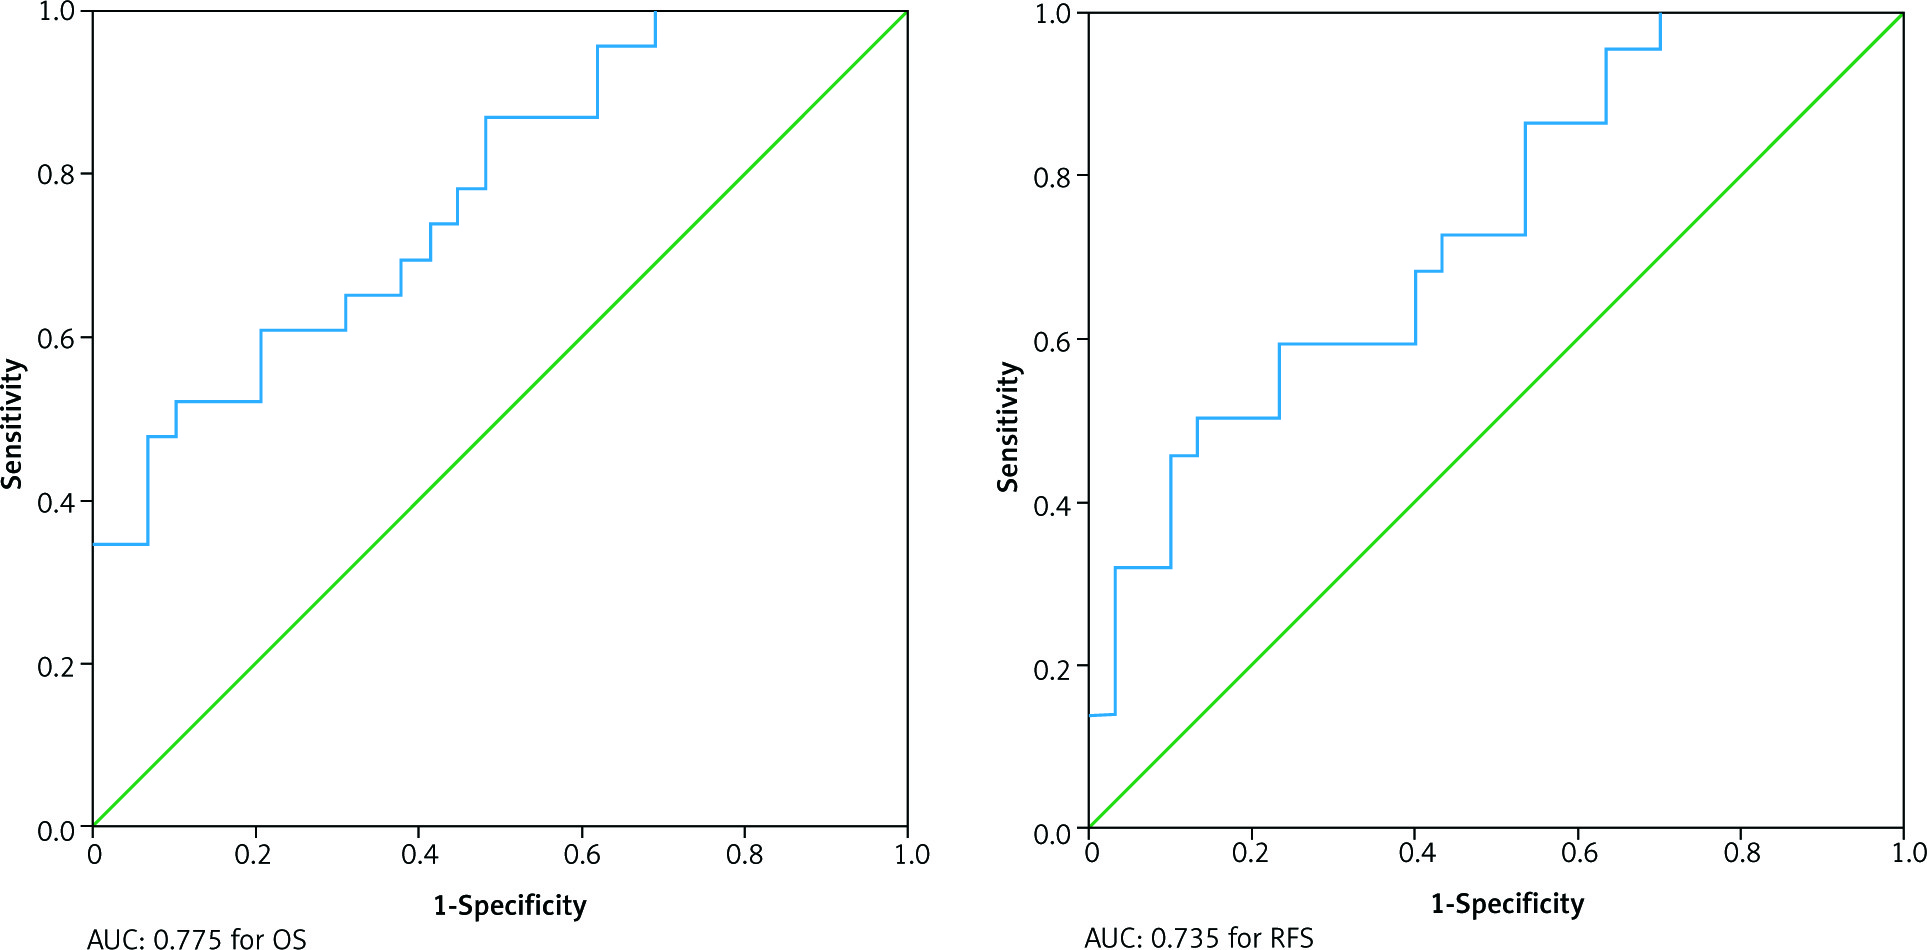
Table 4
Splenic dose characteristics according to ALC levels after treatment and at control evaluation (Fisher’s exact test was used)
The DVH data of 52 patients were compared. The MSD ranged from 11 to 51 Gy (mean, 36 Gy). We could not show any statistically significant difference in terms of MSD between the patients with severe lymphopaenia and the patients with mild lymphopaenia (38 Gy vs. 36 Gy; p = 0.732) for the patients with LAGC treated with adjuvant CRT.
The median values of maximum and minimum splenic doses were 54 and 5 Gy, respectively. No statistically significant difference was detected between splenic doses and severe lymphopaenia before and after CRT (all p values were > 0.05) (Table 5).
Table 5
Predictors of severe lymphopaenia after CRT treatment
Interestingly, we found that the severity of post-CRT lymphopaenia was affected by RT technique (p = 0.051), concomitant CT type (p = 0.039), and age (< 0.001). Volumetric modulated arc therapy (VMAT), intravenous CT, and age ≥ 65 years were significant predictors for severe lymphopaenia after CRT (Table 5).
Discussion
Globally, gastric cancer represents the fourth leading cause of cancer death world-wide, with increasing incidence among young individuals, from birth to 49 years old, seen in recent years [1]. It is still a major health problem with high mortality rates despite ongoing advances in treatment, and the optimal treatment approach is still controversial. Its stage is the major prognostic factor because the disease is asymptomatic at its early stage and the diagnosis is generally made at later stages. Chemotherapy improves overall survival, and radiotherapy is used for preventing local recurrences and improving survival in some cases [22]. Additional predictive and/or prognostic markers are needed to identify patients who may benefit from certain treatments. Also, there may be some treatment-related factors that might affect treatment outcomes.
SIR is associated with worse prognosis in many solid tumours [8, 16, 21]. On the other hand, in the literature there is no certain cut-off value for SIR or NLR that is accepted as an indicator of SIR. A multicentric study done in Turkey evaluated the prognostic significance of SIR in 245 patients with all stages of gastric cancer [22]. NLR and PLR values of the patients were determined before CRT. Patients with NLR ≥ 2.56 and PLR ≥ 160 were considered as SIR-positive cases [23]. Gunaldi et al. reported a significant correlation between NLR and survival times (p = 0.018), with longer survival duration in SIR-negative patients, whereas there was no significant correlation between PLR and survival (p = 0.405), and they concluded that NLR calculated during diagnostic workup could be accepted as a prognostic marker for the patients with LAGC [22]. We found statistically significant SIR positivity for the patients with ALC < 0.5 K/µl after CRT and control evaluation (p = 0.027, and p = 0.037, respectively). But this relation could be accepted as a result of lymphopaenia occurring after CRT and thus could not have an effect on survival outcomes.
Inflammatory cells play important roles in the growth and progression of some tumours including gastric cancer [24]. Neutrophils in the tumour microenvironment are accepted as an unfavourable factor in terms of treatment outcomes, and there have been some trials associated with poor prognosis [25]. It is claimed that neutrophils induce tumour progression and development of metastases via the secretion of cytokines and chemokines, and accelerating tumour angiogenesis [25]. It has been detected that NLR estimated from peripheral blood components predicts the degree of tumour-promoting inflammation, and also the prognostic significance of antitumour immune cell response has been demonstrated [26].
Our data suggest that severe lymphopaenia is commonly seen after CRT. The lymphocyte count decreases after treatment and increases in time but could not reach the baseline level. On the other hand, we could not show any effect of these fluctuations on survival outcomes. Chadha et al. investigated the effect of lymphopaenia on prognosis and whether the severity of lymphopaenia is dependent on radiation dose and fractional volume of spleen irradiated unintentionally, in 171 patients with locally advanced pancreatic cancer treated with induction CT followed by CRT [19]. They reported that post-CRT ALC < 0.5 K/UL was associated with inferior OS both in univariate and multivariate analysis (p = 0.01 and p = 0.01, respectively). Also, postinduction lymphopaenia (p< 0.001) and MSD (p< 0.002) were independent predictors for the development of severe post-CRT lymphopaenia in multivariate analysis. Chadha et al. concluded that higher splenic doses increase the risk for the development of severe post-CRT lymphopaenia and suggested that assessment of splenic DVHs before the acceptance of treatment plans may minimise the risk of severe post-CRT lymphopaenia [19]. We detected neither a significant relationship between severe lymphopaenia and OS nor a relationship between post-CRT ALC and splenic doses. In our trial cohort the mean splenic dose ranged from 11 to 51 Gy (median, 37 Gy), and this could be a reason for not detecting any relationship between lymphopaenia and splenic doses.
Depletion of progenitor cells in the bone marrow, circulating lymphocytes resulting from large gross tumour volume (GTV) coverage, or both have been held responsible for radiation-induced lymphopaenia [18]. Mature circulating lymphocyte numbers are depressed by the direct destruction of radiation exposure, and this could be seen even at very low doses such as 1 Gy. The spleen is an important organ in terms of mature lymphocyte production. One can hypothesise that splenic radiation doses might be a predictor for the development of severe lymphopaenia [27]. In the current trial, the spleen was exposed to high doses due to the required treatment doses for LAGC. As a result of these high doses, the spleen might lose its role above lymphocyte maturation. This could be one reason explaining the current trial results. On the other hand, we found a negative effect of both high mean and maximum splenic point doses for OS rates. However, this lost its significance on multivariate analysis. Nonetheless, the recommendation of the above-mentioned researchers [27] regarding splenic dose evaluation should be kept in mind when accepting the radiotherapy treatment plan of patients.
Nowadays, immunotherapeutic treatments play a special role both in concomitant and other types of usage. In terms of immunotherapeutic response, lymphocytes play an important role. Recent trials involving this combination of treatments suggest that radiation has an initiation effect over primary effector T cells to recognisetumour, which is known as “fire starter” [27–29]. Irradiated tumour cells express “eat me” signals (calreticulin) and elevated levels of MHC class I molecules, and they release “danger” signals like high-mobility group protein B1 and adenosine triphosphate, which leads to dendritic cell-mediated, cytotoxic, T-lymphocyte-induced, immunogenic death [27–29]. The previous data obtained from patients with locally advanced pancreatic cancer draw attention to this issue [27]. Lymphocyte count preservation could be the purpose for certain cancer types. Preservation of ALCs through the spleen-sparing RT techniques is an issue that should be discussed for locally advanced pancreatic cancer in the future, according to the authors’ conclusion [19]. Unfortunately, we could not give a similar message to the patients with LAGC based on our results. It might be argued in the future with the help of new trials arranged specially for this purpose.
Our trial has some limitations. First, the spleen is located close to the stomach, and splenic hilum is one of the targeted irradiation areas for gastric cancer. As a result, the spleen may have been exposed to higher radiation doses in our treatment cohort. Additionally, there is a possibility of selection bias because we included only patients for whom both post-CRT ALC and DVH data were available. Lastly, we should arrange large, numbered, prospective trials in order to give a certain message regarding spleen tolerance doses.
Conclusions
In conclusion, severe lymphopaenia is commonly seen after CRT in patients with LAGC, but it has no significant effect on survival outcomes. Severe lymphopaenia could not be accepted as a predictive or prognostic factor for LAGC. On the other hand, mean and maximum splenic doses should be kept on mind while evaluating the treatment of DVHs. The age of the patient, IV usage of concomitant CT agent, and VMAT are factors that can influence the ALCs of patients. When we consider the survival outcome of our LAGC, disease-related factors such as stage and metastatic lymph node ratio are seen as the most important factors.


