
Introduction
Non-alcoholic fatty liver disease (NAFLD) is one of the most prevalent liver diseases in the whole world [1]. The pathogenesis of NAFLD can be explained by the multi-hit theory in which metabolic syndrome and fat deposition in the liver (the first hit) sensitize the liver tissue to inflammatory mediators (second hit), resulting in fibrosis [2, 3]. These inflammatory mediators include proinflammatory cytokines, endotoxins from the intestinal flora, and oxidative stress [4]. NAFLD encompasses the entire spectrum of fatty liver diseases in individuals without significant alcohol consumption, ranging from fatty liver and steatohepatitis to liver cirrhosis [2]. It is expected that NAFLD will become the most important indication for liver transplantation in the near future [5]. Non-alcoholic steatohepatitis (NASH), the advanced form of NAFLD, is characterized by the presence of lobular inflammation and hepatocyte ballooning. It is associated with an increased risk of liver-related complications and mortality [6]. NAFLD can progress to hepatocellular carcinoma (HCC) during the early stages of liver fibrosis. Therefore, diagnosis of NAFLD in the early stages is important [7]. In order to diagnose NAFLD, the presence of hepatic steatosis (HS) by imaging or biopsy is required in the absence of significant alcohol consumption or other co-existing causes of HS [2]. The gold standard to diagnose NAFLD and identify its stage is liver biopsy [8]. However, liver biopsy is limited by cost, sampling errors, and procedure-related complications. Hence, different non-invasive methods have been adopted to help in NAFLD diagnosis [6].
Non-invasive tools for NAFLD diagnosis including FibroScan, magnetic resonance elastography, acoustic radiation force impulse, and various scoring systems are used to measure the disease severity, but each of these tools has its limitations. On the other hand, only a few biomarkers have shown reliable clinical validity in this disease diagnosis [1]. The search for a reliable, non-invasive, and safe biomarker is still ongoing, not only for NAFLD diagnosis, but also for the assessment of the disease progression to NASH and fibrosis [4].
Mac-2 (galectin-3) binding protein (Mac-2BP) is one of the fucosylated glycoproteins secreted in bile, but it is almost undetectable in the serum of healthy individuals. Some studies have found that serum Mac-2BP level is elevated in different types of cancers (lung, breast, and pancreatic cancers), viral hepatitis, and NAFLD. Serum Mac-2BP has also been shown to correlate with the severity of liver fibrosis in NAFLD patients [9]. Furthermore, Mac-2BP predicted histologic severity in HS, suggesting that it can be a diagnostic biomarker [10]. However, the validity of using Mac-2BP as a biomarker for NAFLD diagnosis and its usefulness in identifying the fibrosis stage are still not understood. The objective of the present study is to measure the Mac-2BP level in patients with NAFLD and correlate it with the findings of non-invasive diagnostic tools and liver biopsy.
Material and methods
Forty patients with non-alcoholic fatty liver disease were included in this pilot study. They were recruited from the Internal Medicine In-patient Department and Out-patient Clinic at Al-Kasr Al-Ainy Hospital. Fifteen age- and sex-matched healthy subjects with normal ultrasonography were recruited as a control group. This study was approved by the Ethics Committee of Al-Kasr Al-Ainy Hospital, Cairo University.
Written informed consent was obtained from all subjects before their enrollment in the study. Written informed consent was also obtained from 20 patients who agreed to undergo the liver biopsy procedure. All patients were subjected to full medical history and thorough physical examination. Body weight, height, and body mass index (BMI) were measured [11]. Central obesity was defined as waist circumference > 90 cm for men and > 80 cm for women [12]. Patients with evidence of concurrent hepatitis B virus (HBV) or hepatitis C virus (HCV) infection, alcohol intake > 20 g/day or any other liver disease such as inflammatory and metabolic diseases were excluded from the study. Serum levels of aspartate aminotransferase (AST), alanine aminotransferase (ALT), g-glutamyltransferase (GGT), alkaline phosphatase (ALP), total cholesterol, triglyceride, high-density lipoprotein cholesterol, fasting blood glucose (FBS), and albumin (Alb) in addition to prothrombin time and concentration and platelet count were measured.
Abdominal ultrasound was performed in all subjects. Ultrasound-guided liver biopsy was taken from 20 patients with NAFLD (who consented to undergo liver biopsy) by an expert physician. All the biopsied samples were independently evaluated by an experienced liver-specialized pathologist who was blinded to the clinical data. NASH diagnosis was based on the NAFLD activity score (NAS) (NAS: steatosis [0-3], hepatocellular ballooning [0-2], and lobular inflammation [0-3]). Total NAS score represents the sum of scores for steatosis, lobular inflammation, and ballooning; it ranges from 0 to 8. Patients with NAFLD were subdivided into 3 categories (NAS scores of 0-2 – non-NASH, 3-4 – borderline NASH, and 5-8 – NASH) [13]. Hepatic fibrosis stages were evaluated according to Brunt et al.’s criteria [13].
The non-invasive tools used to assess fibrosis were the AST/ALT ratio (AAR), APRI score (based on AST and platelet count) [14], BARD score (based on the sum of BMI, diabetes, and AAR) [15], FIB-4 index (based on age, AST, ALT, and platelet count) which offers dual cut-off values (patients who score < 1.45 are unlikely to have advanced fibrosis, while those who score > 3.25 are likely to have advanced fibrosis) [16, 17], and NAFLD fibrosis score (NFS) (based on age, BMI, presence of impaired fasting glucose or diabetes mellitus, platelet count, and albumin) [18].
Mac-2BP serum levels were measured using the Human s90K/Mac-2BP ELISA kit (Invitrogen BMS234, Thermo-Fisher Scientific Inc., Vienna, Austria). An anti-90K/Mac-2BP monoclonal coating antibody was adsorbed onto micro-wells. The 90K/Mac-2BP present in the sample or standard bound to the antibody adsorbed to the micro-wells. Following incubation, HRP-conjugated monoclonal anti-90K/Mac-2BP anti-body was added and bound to the 90K/Mac-2BP, which was captured by the first antibody. Unbound enzyme conjugated anti-90K/Mac-2BP was removed during a wash step, and a substrate solution reactive with HRP was added to the wells. A colored product was formed in proportion to the amount of soluble 90K/Mac-2BP present in the sample. The reaction was terminated by the addition of acid and absorbance was measured at 450 nm. A standard curve was prepared from five 90K/Mac-2BP standards and the 90K/Mac-2BP sample concentration determined.
Statistical methodology
Data were coded and entered using the statistical package SPSS version 24. Quantitative data were summarized using mean and standard deviation, while categorical data were summarized using frequency (count) and relative frequency (percentage). Comparisons between quantitative variables were done using the non-parametric Kruskal-Wallis and Mann-Whitney tests. For comparing categorical data, the chi square (χ2) test was performed. The exact test was used instead when the expected frequency was less than 5. Correlations between quantitative variables were done using the Spearman correlation coefficient. A ROC curve was constructed and the area under curve (AUC) analysis was performed to detect the best cut-off values of different parameters for detection of cases. P-values less than 0.05 were considered as statistically significant.
Results
There was a higher incidence of NAFLD among females (77.5%). Seventeen NAFLD patients had diabetes (42.5%) and 9 patients had hypertension (22.5%). The characteristics of the studied subjects are presented in Table 1.
Table 1
Demographic and laboratory data of patients and controls
Liver biopsy was taken from 20 NAFLD patients. According to the NAS score, 40% of patients had NASH. According to the pathological grades of steatosis, 11 patients had grade II steatosis (55%). According to the grades of fibrosis, 2 patients had no fibrosis (10%), while 1 patient had grade 3 fibrosis (5%) (Table 1).
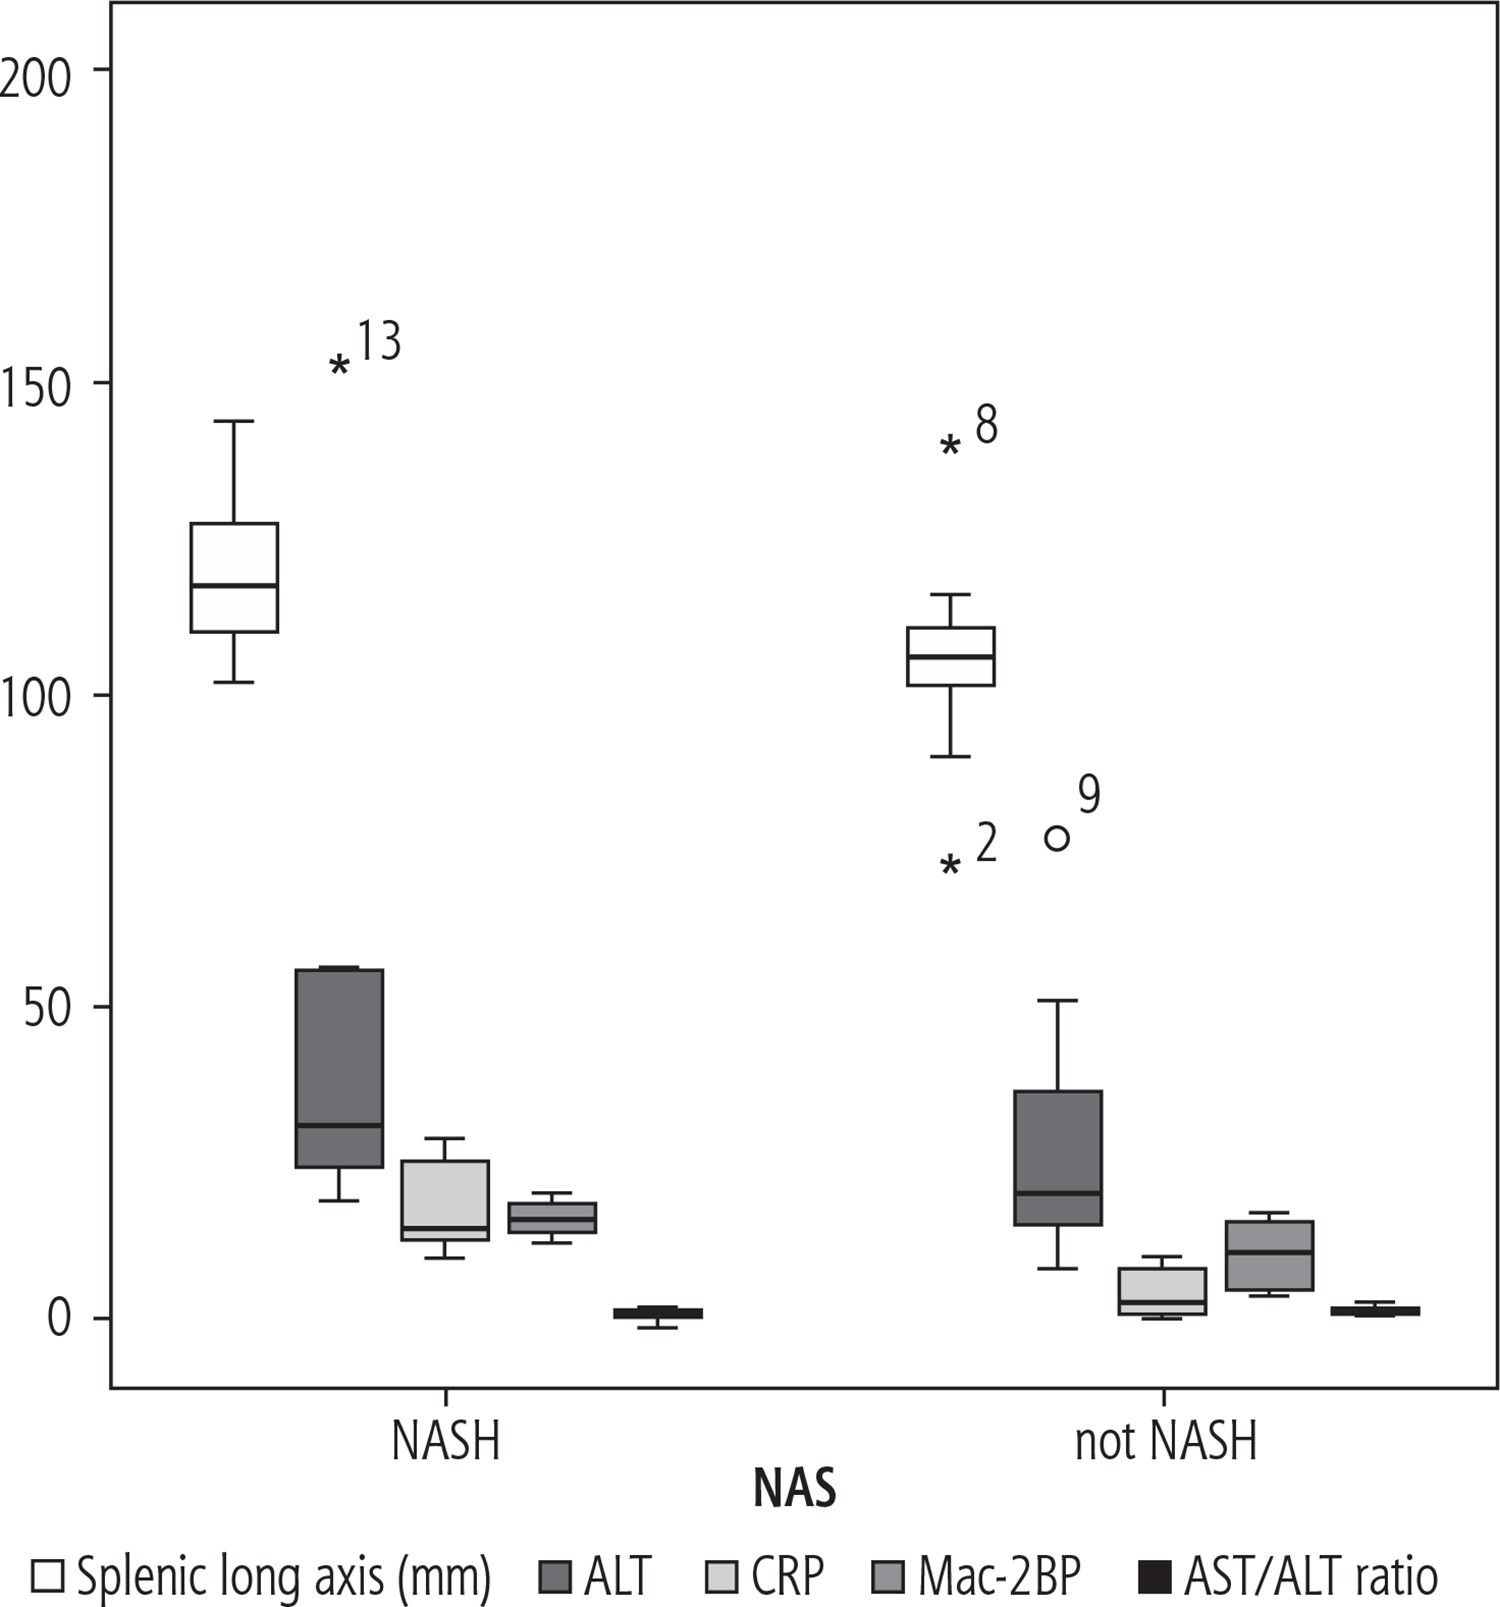
The splenic longitudinal axis was significantly higher in NASH patients compared to non-NASH patients. There was no statistically significant difference between patients and controls as regards Mac-2BP level (Table 1). However, there was a statistically significant difference between NASH and non-NASH patients as regards the mean values of Mac-2BP, ALT, and C-reactive protein (CRP). The AST/ALT ratio is the only non-invasive score of fibrosis that showed a significant difference between the NASH and non-NASH groups (Fig. 1).
Fig. 1
Comparison between NASH and non-NASH patients as regards the splenic longitudinal axis, ALT, CRP, Mac-2BP, and AST/ALT ratio
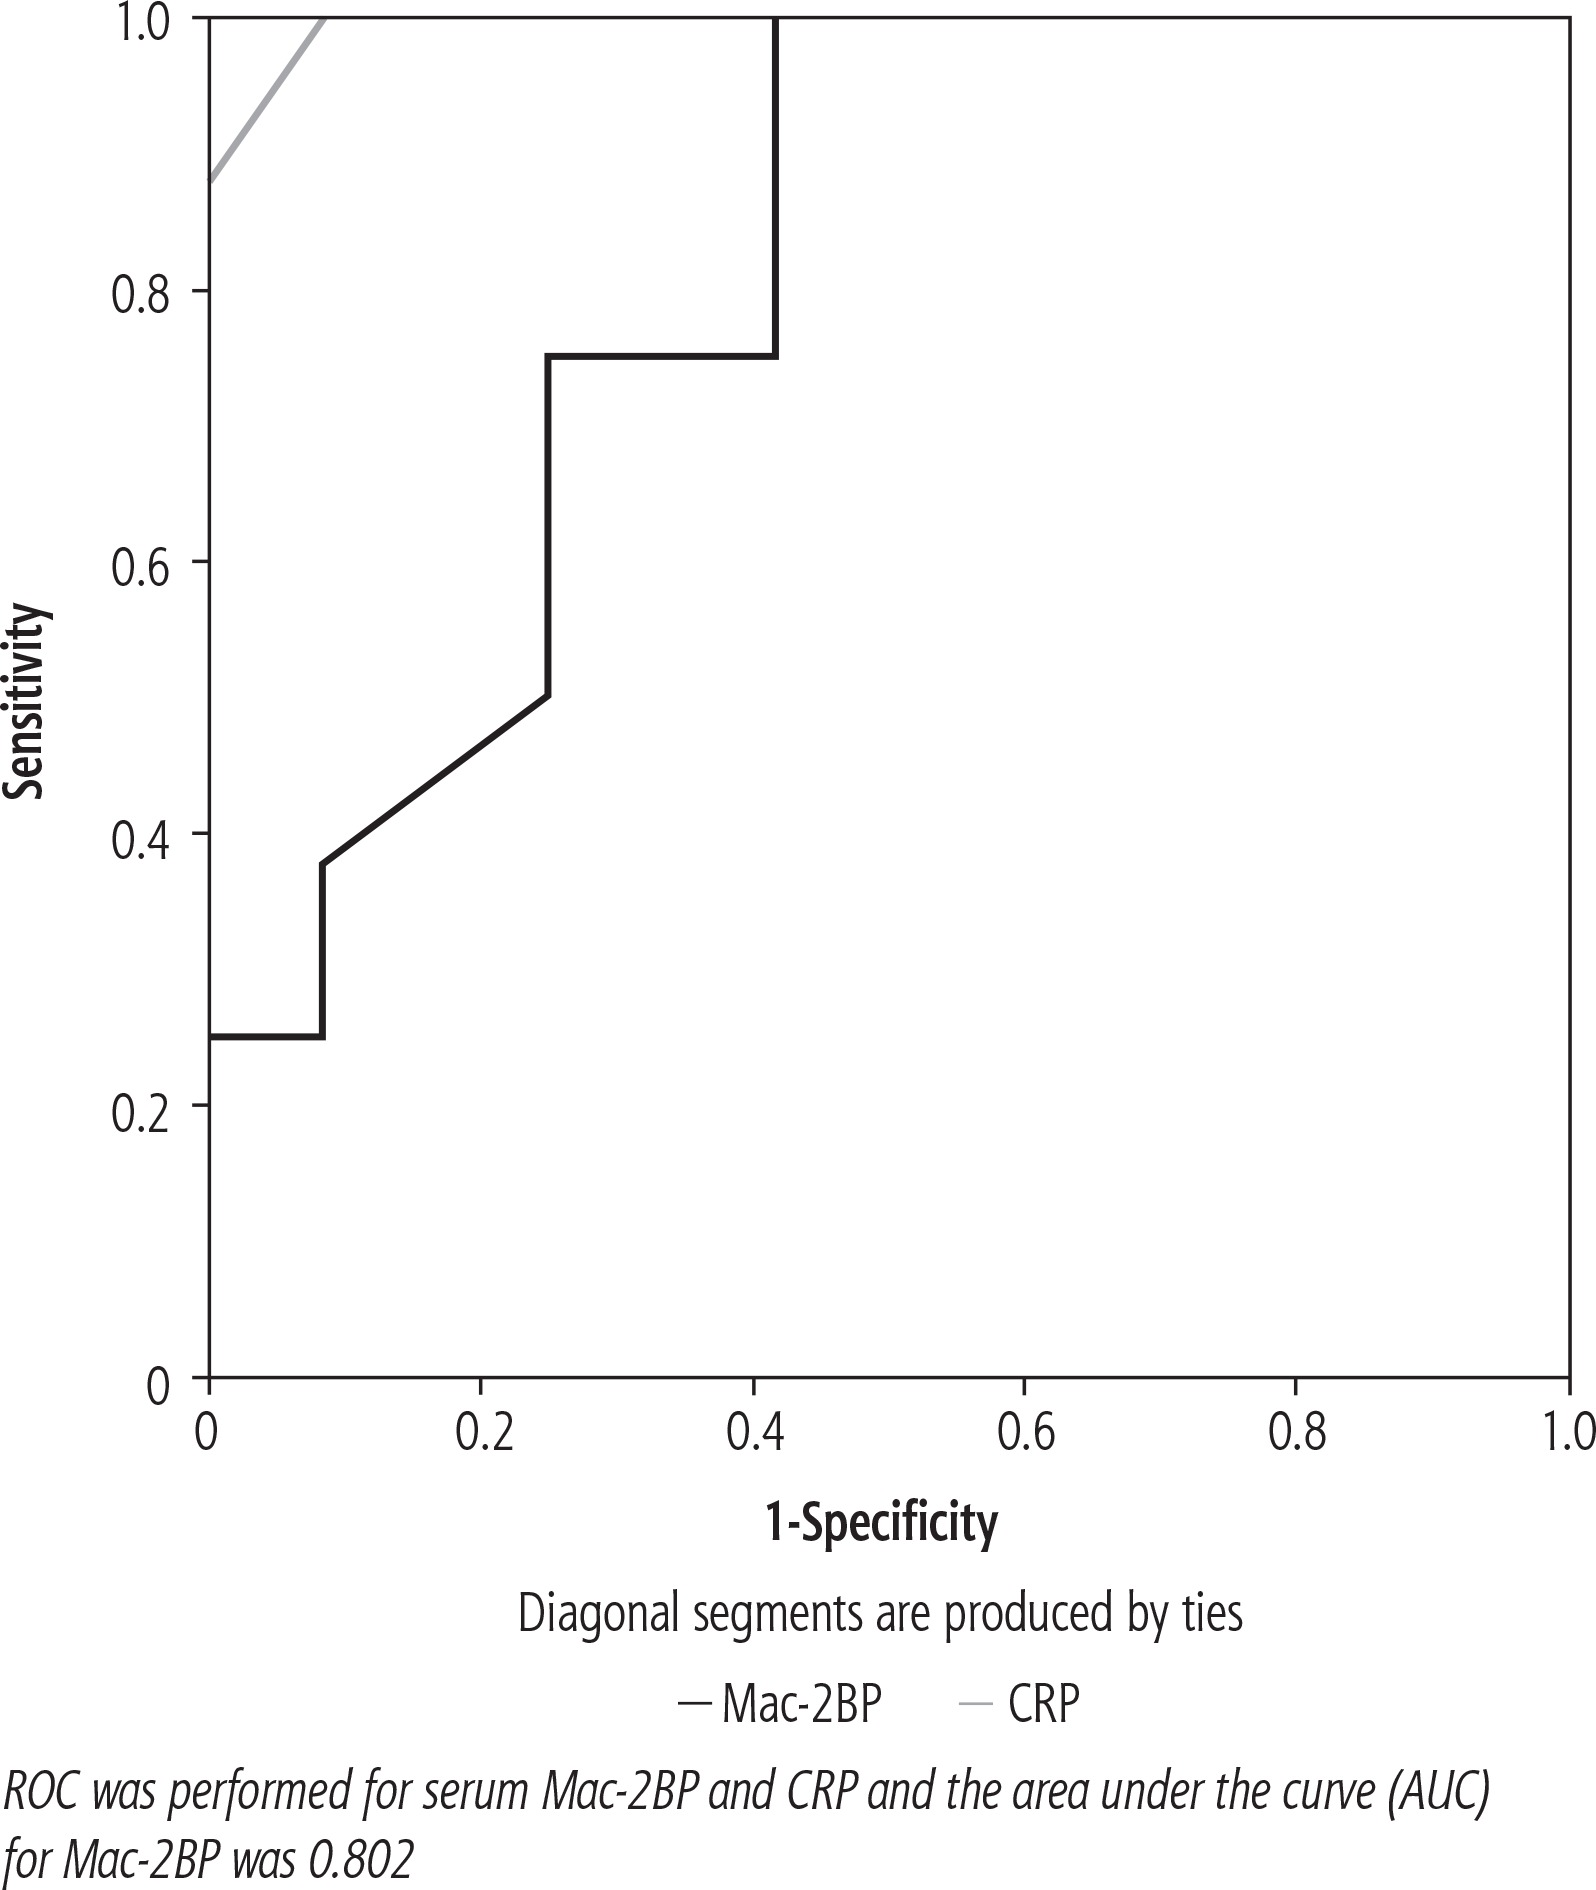
A ROC curve was constructed, revealing that the Mac-2BP cut-off value for NASH prediction was 9.55 µg/ml, with sensitivity and specificity of 100% and 91.7%, respectively. The area under the curve was 0.802. The CRP cut-off value for NASH prediction was 11.85 mg/l, with sensitivity and specificity of 100% and 58.3%, respectively (Fig. 2).
There were statistically significant differences between patients and healthy controls as regards NAFLD fibrosis score (NFS), FIB-4 score, and BARD score (p < 0.001, < 0.012, < 0.045, respectively), while there were no significant differences regarding AAR and APRI scores between the two groups. CRP level showed significant direct correlations with BARD and NFS scores. Mac-2BP showed an insignificant correlation with the non-invasive scores (Table 2). Hepatic steatosis had statistically significant correlations with AST (r = 0.608, p = 0.001), ALT (r = 0.599, p = 0.005), and APRI scores (r = 0.458, p = 0.042). Mac-2BP showed a positive statistically significant correlation with lobular inflammation grade (r = 0.464, p = 0.039) (Table 3).
Table 2
Correlation between non-invasive fibrosis scores in NAFLD patients with CRP and Mac-2bp
Table 3
Correlation between the different parameters (demographic, laboratory and fibrosis scores) and findings of liver biopsy in studied patients
Discussion
Mac-2BP is a member of the scavenger receptor superfamily which has several glycosylation sites. Abnormal glycosylation of proteins can be induced under pathological conditions, leading to abnormal cell proliferation and angiogenesis [19]. Mac-2BP with abnormal glycosylation can lead to deposition of extracellular matrix which promotes the process of hepatic fibrosis. In this study, we investigated the role of serum 90k/Mac-2 binding protein in patients with NAFLD as a possible non-invasive marker for the disease diagnosis. We found no significant difference in Mac-2BP levels between NAFLD patients and healthy controls. Nevertheless, the mean values of Mac-2BP were significantly higher in patients with NASH compared to non-NASH patients. Using ROC analyses, the area under the ROC curve (AUC) was 0.802, with sensitivity and specificity of 100% and 91.7%, respectively. This was in agreement with Kamada et al., who reported that serum Mac-2BP level is a useful diagnostic biomarker for the prediction of disease severity in NASH patients. In Kamada et al.’s study, the area under the ROC curve was 0.816, which is similar to our results [10]. In contrast to the current study, Kamada et al. reported that there was a significant difference in the serum Mac-2BP level between patients and controls [10].
In this study, we found that Mac-2BP had no significant correlation with any of the non-invasive fibrosis scores. However, Mac-2BP showed a significant correlation with the stage of lobular inflammation only in liver biopsy findings. This disagreed with Abe and colleagues, who reported that serum Mac-2BP level had a significant direct correlation with the stages of liver fibrosis in NAFLD patients. In addition, they reported that compared to non-invasive conventional markers, serum Mac-2BP had the greatest AUC in the ROC analysis for diagnosing severe fibrosis and cirrhosis. However, they focused on its utility in diagnosing the fibrosis stage and provided no information on its accuracy in differentiating between NASH and non-NASH patients [9]. Another study by Cheung et al. examined the relationship between Mac-2BP and the degree of hepatic fibrosis in patients with viral hepatitis. They found that Mac-2BP can predict the advanced stage of fibrosis (F4) related to viral hepatitis; however, it could not differentiate between patients with F0 to F3 grades of fibrosis [20]. Moreover, Kuno et al. reported that Mac-2BP level had a correlation with hepatic fibrosis in patients with viral hepatitis [21]. Furthermore, Cheung et al. reported that Mac-2BP was elevated in patients with viral hepatitis and that it might be related to the disease severity and HCV-related fibrosis [20].
Kuno et al. developed a strategy to enhance the specificity of Mac-2BP as a biomarker by selecting a certain type of lectin which is robust enough to increase the Mac-2BP marker avidity [21]. This led to the development of the wisteria floribunda agglutinin-Mac-2BP, which was found to be more sensitive and superior in the diagnostic accuracy at each fibrosis stage [21].
C-reactive protein (CRP) was found to be significantly higher in patients with NAFLD than in controls (p < 0.001). However, there was no correlation between CRP and Mac-2BP. This is consistent with the study of Foroughi et al., who demonstrated that there was a significant correlation between NAFLD, sub-clinical systemic inflammation, and CRP level [22]. Yoneda et al. reported for the first time a significant elevation of CRP in patients with NASH compared with those with simple steatosis [23]. Fierbinteanu-Braticevici et al. revealed that CRP was significantly associated with histologically proven NASH. The multivariate analysis identified independent predictive factors for the presence of NASH such as CRP (p = 0.004) [24].
Conclusions
Mac-2BP could not be used in identifying patients with NAFLD; however, it can be used to differentiate between NASH and non-NASH patients. More studies with larger populations are needed to assess the value of Mac-2BP as a biomarker for NAFLD. Novel structures of Mac-2BP which can be more accurate and sensitive in the diagnosis of fibrosis stages need to be explored.


