
Summary
In this study, we developed machine learning models using data from Electronic Hospital Information System for the exclusion and confirmation of severe obstructive coronary artery disease on coronary angiography (CAG). The utilization of such models may improve decisions in low- to intermediate-risk patients regarding the need for further testing such as coronary computed tomography angiography or CAG with a relatively low cost. This effort may be a potential step towards the development of a machine learning-based tool to help patients avoid unnecessary CAG in outpatient clinics or routine medical examination.
Introduction
Coronary artery disease (CAD) remains the most common cardiovascular disease worldwide, which annually causes millions of deaths [1]. Coronary angiography (CAG) is the standard procedure for diagnosing CAD. However, CAG is an invasive test and a huge percentage of patients suspected of CAD undergoing CAG results have no coronary lesions. Data from the National Cardiovascular Data Registry (NCDR) reveal that only 37.6% of patients undergoing CAG had obstructive CAD [2].
Traditionally, the indications of CAG are mainly based on patients’ symptoms, along with their risk factors. Thus, the decision to perform CAG is strongly related to doctors’ intuition and experience rather than a quantitative concoction of information extracted from the clinical data. The judgement is subjective and interobserver variability is high. Therefore, there continues to be a need for better pretest assessment tools in order to improve patient selection for CAG. For the past few decades, machine learning has been widely used for healthcare [3]. As an information processing method, machine learning can identify the potential patterns within data, and may be helpful for the individual diagnosis of CAD and the exclusion of CAD.
Aim
In this study, we sought to develop practical machine learning models utilizing objective clinical variables and symptoms of patients undergoing CAG to predict the presence of CAD on CAG.
Material and methods
Study population
Patients with coronary artery angiography records from January 1, 2018 to September 30, 2021 in Shanghai Huashan Hospital affiliated to the Fudan University were included. Patients’ demographic data, diagnoses and medical histories were taken from the Electronic Hospital Information System. The exclusion criteria may include the following: (i) prior percutaneous coronary intervention (PCI); (ii) prior coronary artery bypass graft (CABG); and (iii) diagnosis of acute myocardial infarction.
Demographic information, clinical examination results and patients’ symptoms were collected for all patients before CAG. Several specific symptoms such as chest distress, chest pain, shortness of breath, palpitation, dizziness, back pain and throat tightness were documented. Whether these symptoms are related to activities, emotional excitement, and whether they have worsened recently were also recorded.
Ethical approval
This study has been approved by the Ethical Committee of the Shanghai Huashan Hospital affiliated to the Fudan University.
Labelling
All CAG findings were taken from operative records that were formally provided to patients. CAD was defined as ≥ 50% stenosis in the right coronary artery, left anterior descending branch or left circumflex branch of the left main coronary artery in coronary artery angiography.
Data pre-processing and model establishment
We completed the imputation of missing values with mean values. Then, we used LASSO regression to do feature selection in all datasets [4]. We randomly chose 2082 patients from the 2602 patients as the training set, and 520 patients as the test set. We used 10-fold cross-validation and grid search in our training set in tuning the hyperparameters of the model [5].
We tried several ML algorithms (Linear Discriminant Analysis, Gradient Boosting, Support Vector Machine and Logistic Regression) for a binary classification task based on the presence or absence of obstructive CAD and finally chose the Logistic Regression algorithm which had the best performance [6]. Finally, we would output the predicted probability and give the confusion matrix under different thresholds, which can more accurately achieve the purpose of screening patients who do not need angiography. Machine learning techniques were implemented in Python using open-source libraries.
Statistical analysis
Data were presented as mean ± standard deviation or median (interquartile range) for continuous variables and percentages for discrete variables. Categorical variables were compared using χ2 or Fisher’s exact tests, and continuous variables were compared using t or Mann-Whitney U tests. All comparisons were two-sided, with statistical significance defined as p < 0.05. Analyses were calculated using SPSS version 20.0.
Results
Patients in training set and test set
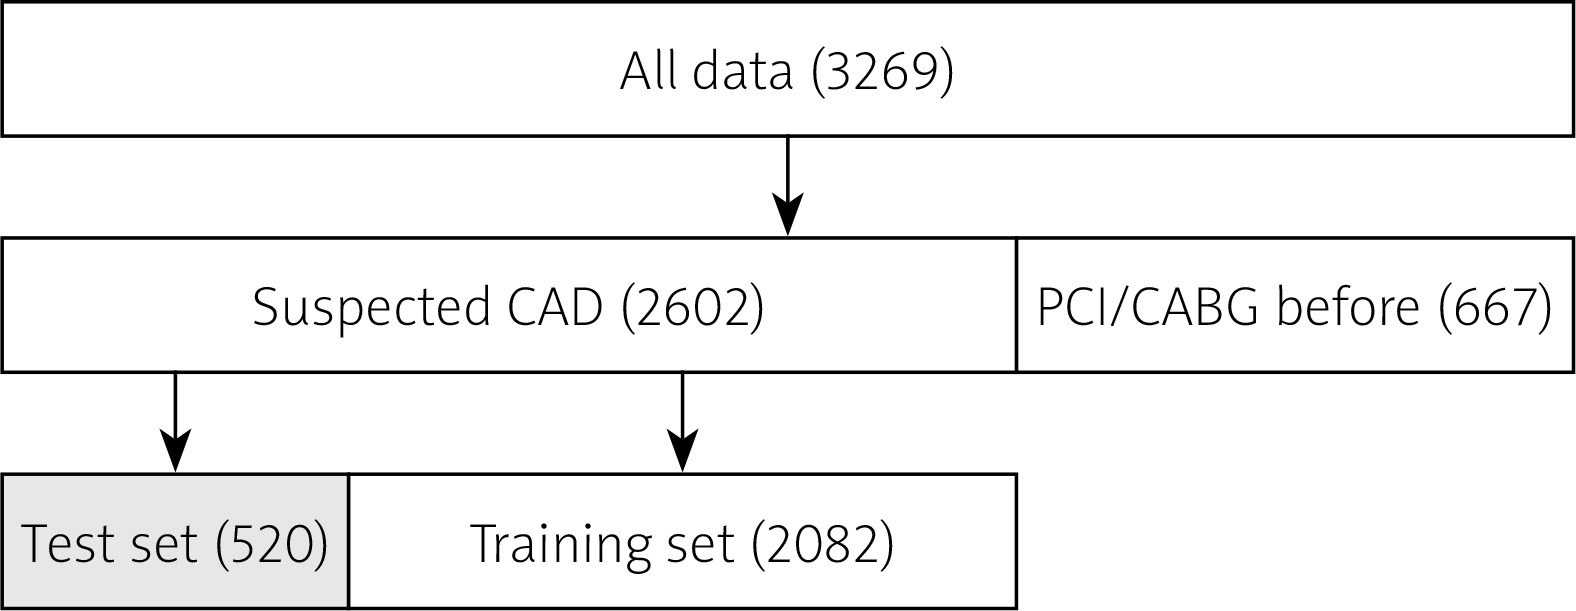
In this study, a total of 3269 patients were included and 667 patients were excluded because of the prevalent PCI or CABG at baseline (Figure 1). Therefore, between January 2018 and September 2021, 2602 patients suspected of CAD for the first time were enrolled. We randomly chose 2082 patients from the 2602 patients as the training set, and 520 patients as the test set (Figure 1).
Characteristics of CAD patients
Table I demonstrated the characteristics of the CAD patients. The mean age of the patients was 64.9 ±10.6 years. Meanwhile, there were 58.2% of patients with hypertension, 24.9% with diabetes mellitus, 9.0% with heart failure, 3.3% with chronic kidney disease, 6.8% with atrial fibrillation, 64.3% with coronary artery disease, 45.2% with severe coronary artery disease, 9.1% with coronary slow flow phenomenon, 16.9% with myocardial bridge, and 6.8% with chronic total occlusion.
Table I
Participant-level characteristics of the study
Features of severe CAD and non-severe CAD patients
According to the data in Table II, there were significant differences for the gender, age, atrial fibrillation, hypertension, diabetes mellitus, white blood cells count (WBC), N%, B%, mean platelet volume (MPV), albumin, apoA, creatinine, CO2, high-density lipoprotein-cholesterol (HDL-C), Lp(a), Na, triglyceride, CK-MB, troponin T, glycated hemoglobin (HbA1c), activated partial thromoplastin time (APTT), fibrinogen, and left ventricle ejection fraction (LVEF) between patients from Non-severe CAD and Severe CAD groups (all p < 0.001). Furthermore, M% (p = 0.023), TT4 (p = 0.001), low-density lipoprotein-cholesterol (LDL-C) (p = 0.005), and systolic pressure (p = 0.006) were also the risk factors for the severe CAD (Table II).
Table II
Features for model building
[i] Month – the month of admission, WBC – white blood cell, N% – percentage of neutrophils, M% – percentage of monocytes, B% – percentage of basophils, MPV – mean platelet volume, TSH – thyroid stimulating hormone, TT4 – tetraiodothyronine, CO2CP – carbon dioxide combining power, APTT – activated partial thromboplastin time, LVEF – left ventricular ejection fraction.
Prediction of severe obstructive CAD on coronary artery angiography
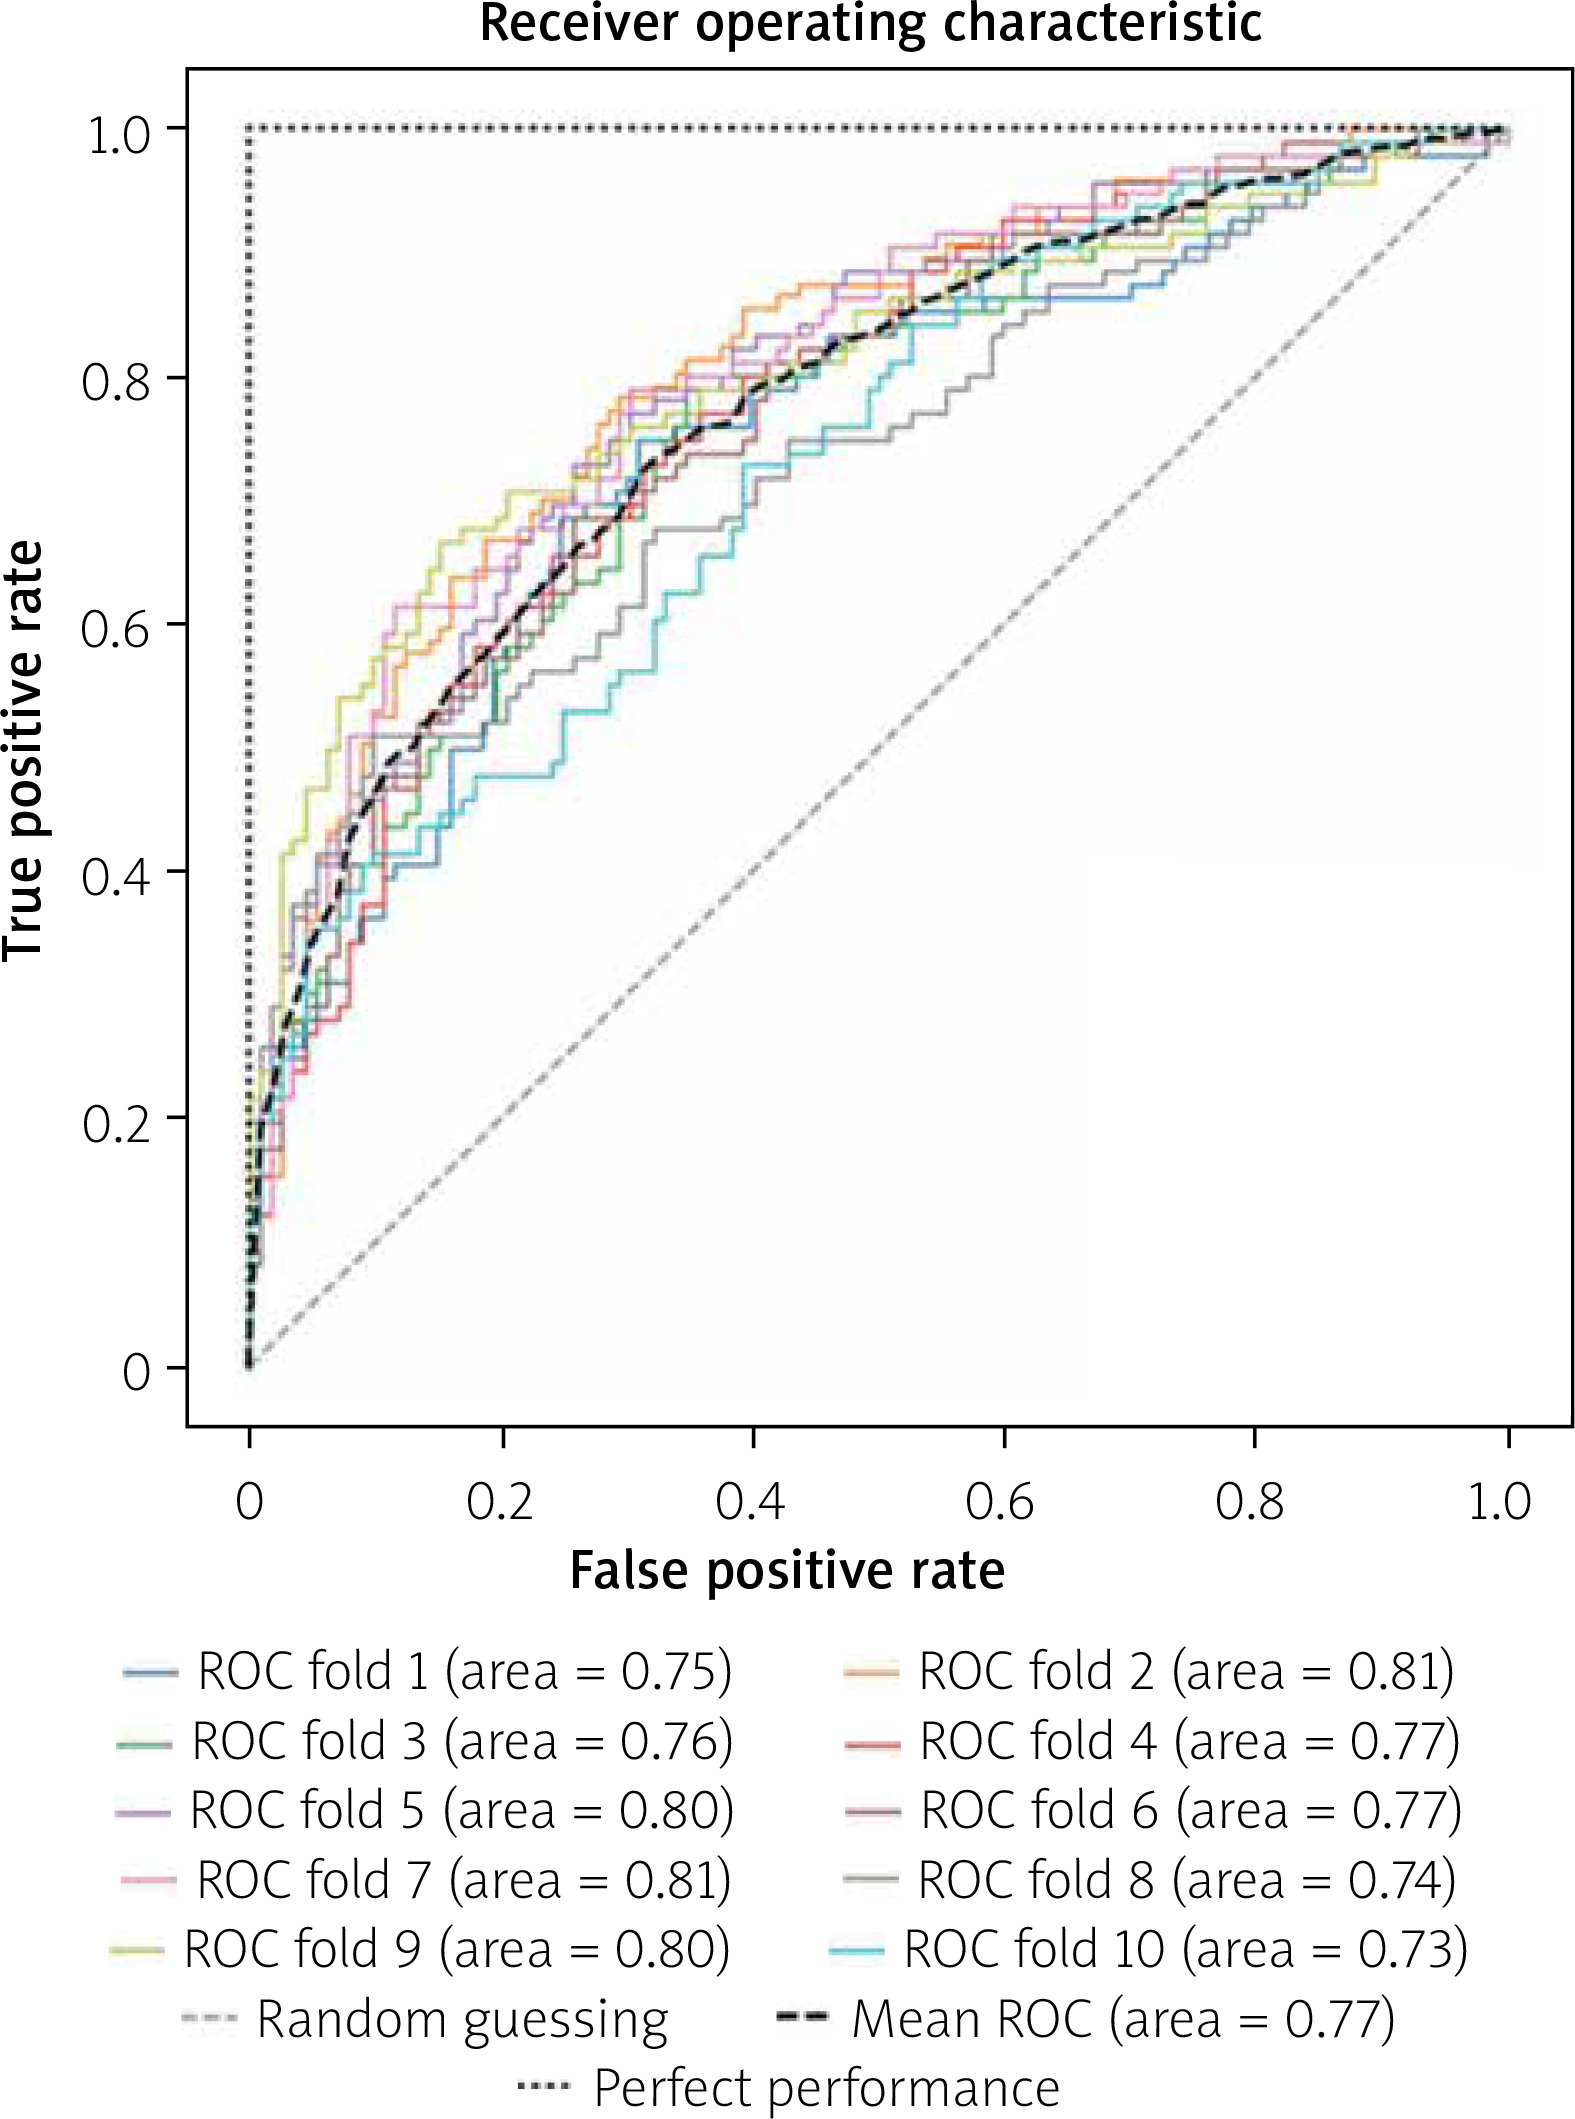
We randomly chose 520 (20%) patients in the ‘suspected CAD’ group as the test set as shown in Figure 1. The support vector machine (SVM) algorithm performances in 10 folds were conducted in the training set for detecting severe CAD. While the XGBoost algorithm performances were conducted in the test set for detecting severe CAD. Our algorithm achieved an average AUC of 0.77 in the training set during 10-fold validation (Figure 2) and an AUC of 0.75 in the test set (Figure 3).

Confusion matrix under different thresholds
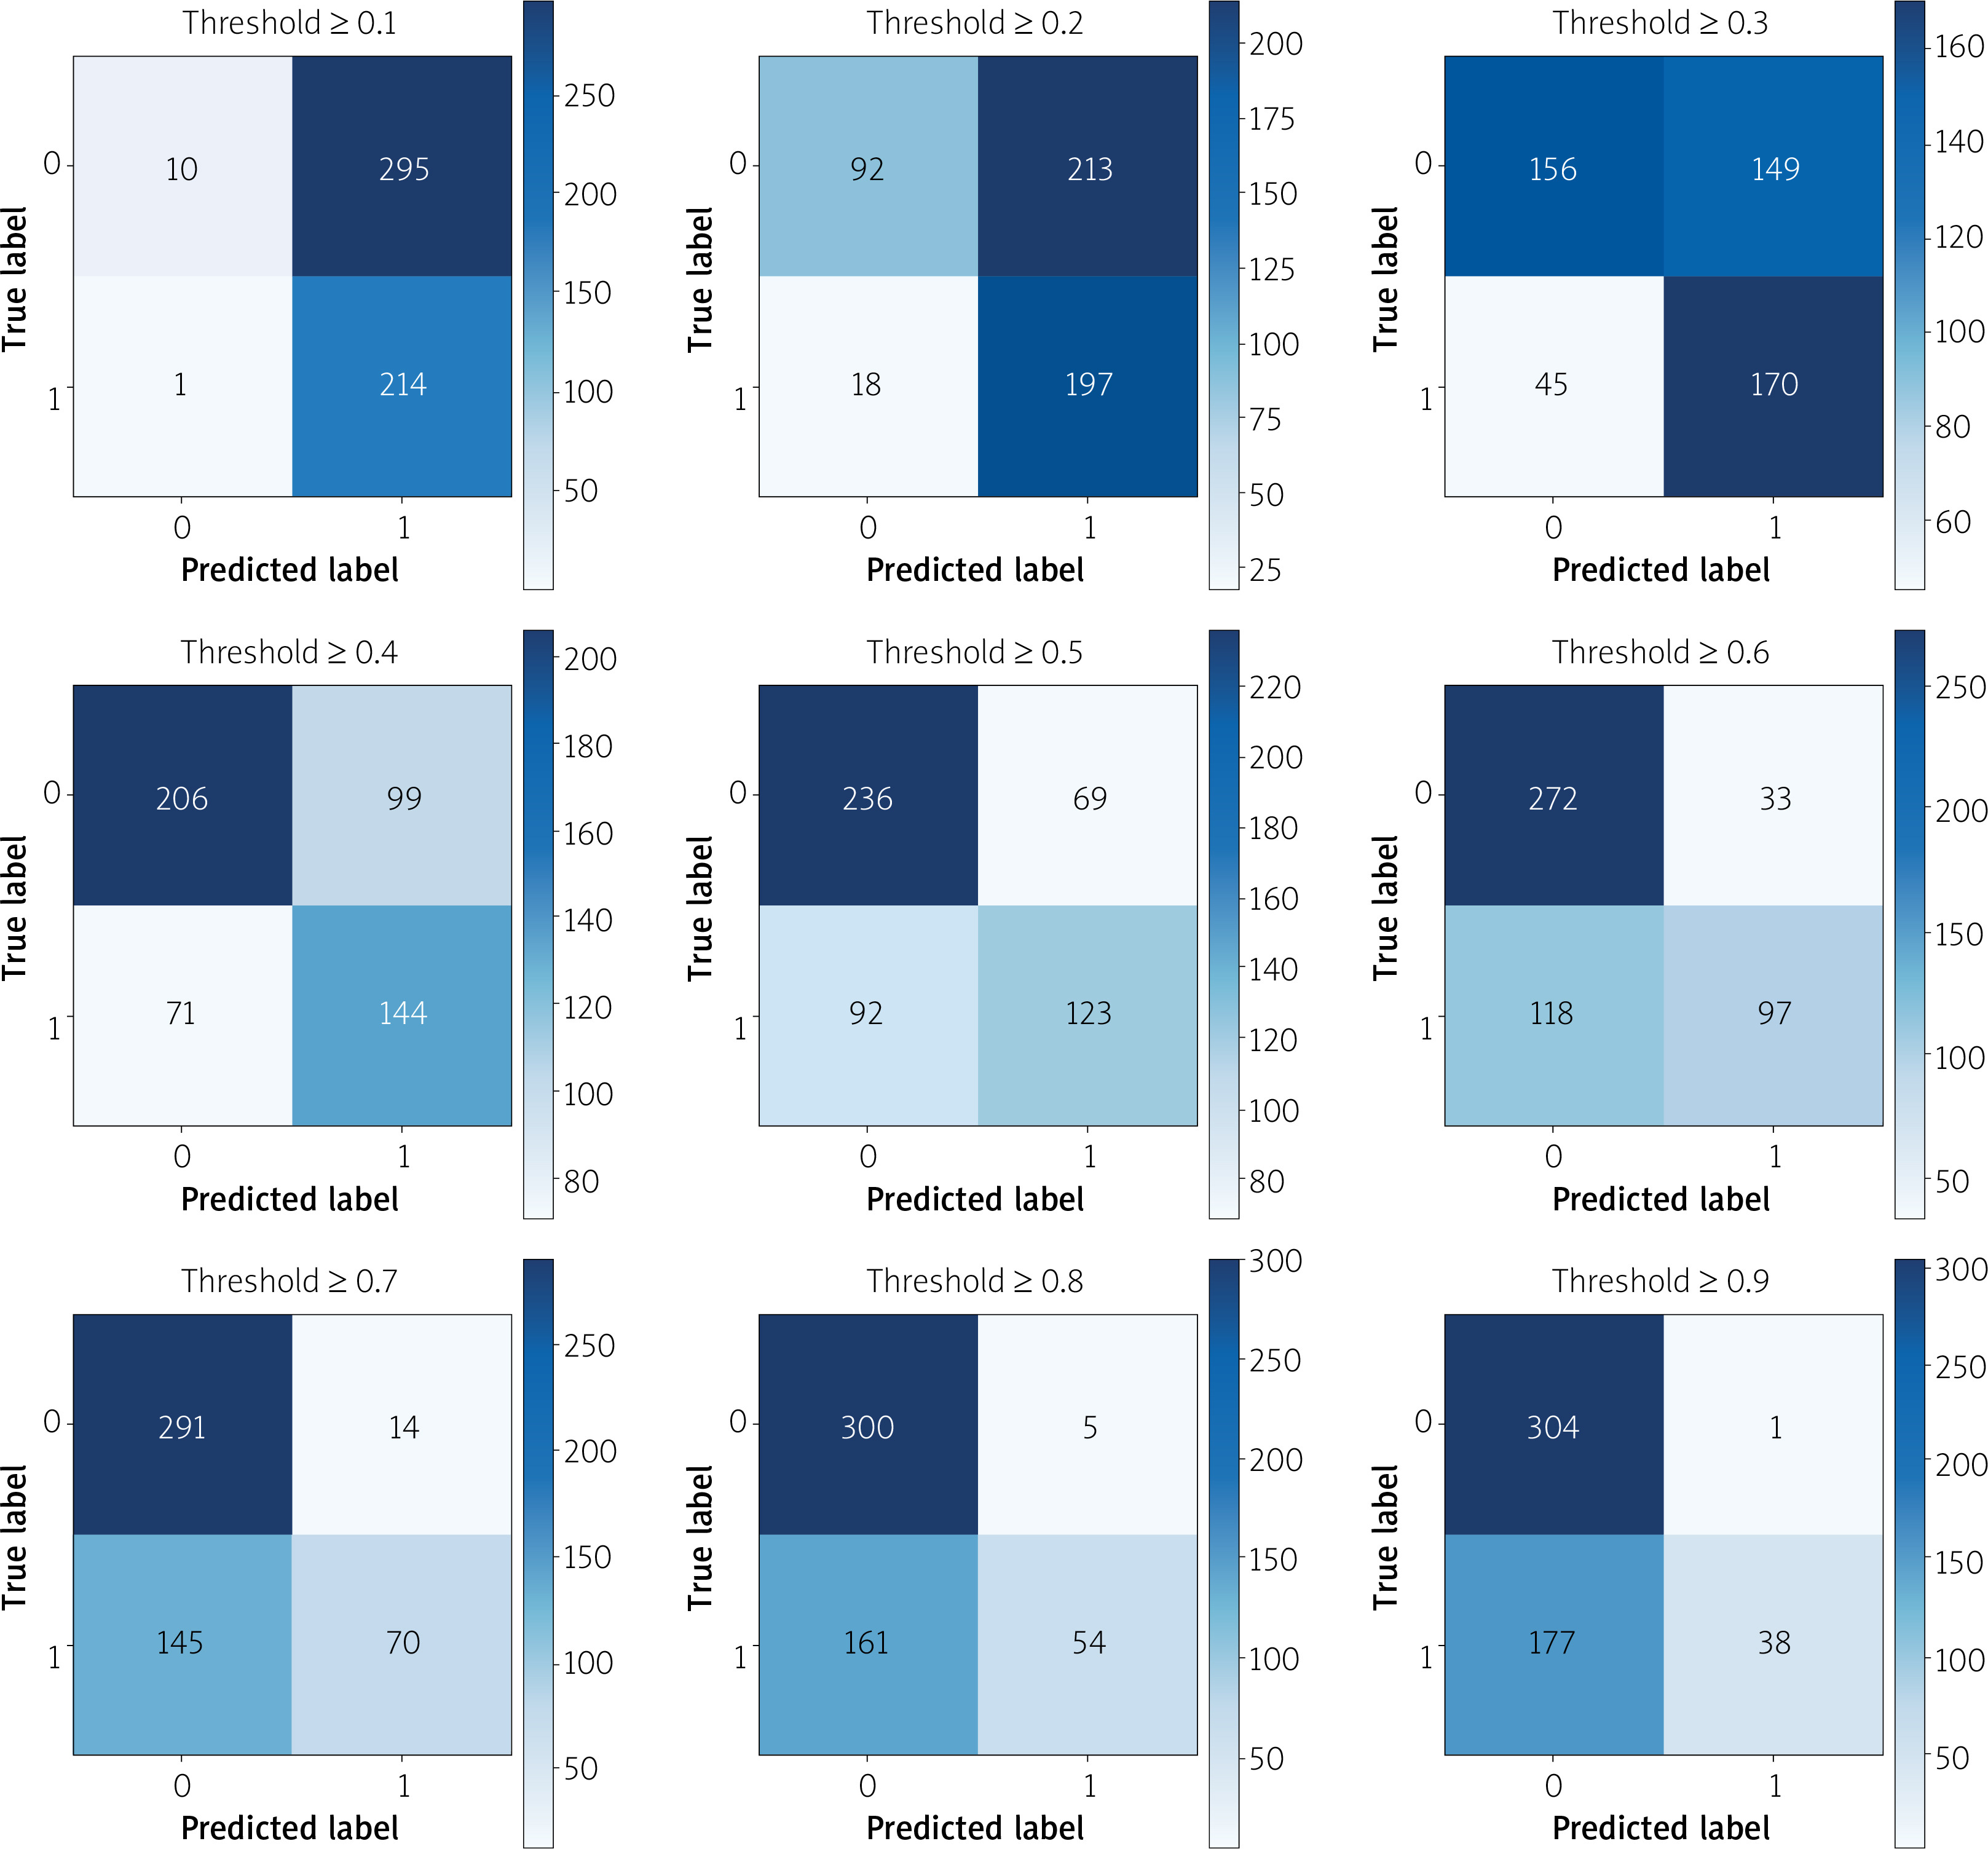
Our model would output the probability of having ‘severe CAD’. Figure 4 showed the confusion matrices under different thresholds in the test set. We would focus on the negative predictive value (NPV). When the probability predicted by the model was less than 0.1, 11 patients in the test set (520 patients) were screened out, and the NPV reached 90.9%. When the probability predicted by the model was less than 0.2, 110 patients in the test set were screened out, and the NPV reached 83.6%. Meanwhile, when the threshold was set to 0.9, the positive predictive value (PPV) reached 97.4%. When the threshold was set to 0.8, the PPV reached 91.5%.
Discussion
The indication of CAG mainly depends on the doctor’s judgment of symptom description. However, symptom-based diagnosis of CAD has moderate accuracy. Even taking the risk factors for CAD into account, doctors may still find a significant number of patients undergoing CAG or coronary computed tomography angiography (CCTA) with minimal or no CAD [2]. Therefore, precise, practical and cost-effective tools to screen CAD are urgently needed before CCTA or CAG. A wide variety of scoring systems were invented for the purpose of CAD screening, for example, updated Diamond and Forrester (UDF) score and the CAD consortium clinical score, etc. [7–9]. But none of them had satisfactory results. As artificial intelligence has evolved [10], machine learning and deep learning algorithms have become promising tools for disease diagnosis and prediction, which provides the perfect opportunity to use the increasingly complex data that are available while improving predictions in the era of precision medicine [5].
With the popularity of convolutional neural networks, tremendous progress has been made in medical image recognition, for example, tumor image recognition [11, 12], CCTA image processing [13, 14]. There is also a subset of studies aiming to enhance images, such as using CCTA to predict FFR [15]. In the most recent studies, disease detection from photos was performed successfully, which provided us with a new approach for disease detection. Facial photos can be recognized by deep learning algorithm to detect CAD [16]. Deep learning models can also be used to identify chronic kidney disease, type 2 diabetes and CAD solely from fundus images or in combination with clinical metadata [17, 18]. Machine learning not only excel at the processing of images, the algorithms are also good at the processing of structured data in the electronic medical history system [19–22].
Machine learning models for prediction of prognosis in patients with suspected CAD using cross-sectional data have been implemented so far [22–28]. People are also working on machine learning methods to find features to predict the pre-test probability of coronary artery disease in patients undergoing CCTA or CAG [29–32]. However, previous studies usually had high-quality data with few missing values, which made it relatively difficult to expand the amount of data for machine learning. Another problem is that researchers often took subjective indicators, ‘typical chest pain’ for example, as features in model establishment [5, 16].
Therefore, during the establishment of our models, we tried to avoid the problems mentioned above. We did not directly discard the samples with missing values, which would fit the actual situation better. The features we used in our model were all objective records and could be relatively easy to achieve as most of them could be done during routine examinations.
Finally, the algorithm achieved an average AUC of 0.77 in the training set during 10-fold validation and an AUC of 0.75 in the test set. We output the predicted probability and gave the confusion matrices under different thresholds. Then, we focused on the NPVs and PPVs of our model. As a result, when the probability predicted by the model was less than 0.1, 11 patients in the test set (520 patients) were screened out, and the NPV reached 90.9%. When the probability predicted by the model was less than 0.2, 110 patients in the test set were screened out, and the NPV reached 83.6%. The surgical indications of these patients should be controlled more strictly to avoid unnecessary CAG. When the threshold was set to 0.9, 39 patients were screened out, and the PPV reached 97.4%. When the threshold was set to 0.8, the PPV reached 91.5%. These patients were suggested to perform CAG directly.
The model we established has the following advantages. Firstly, we utilized a more advanced data imputation method to deal with missing values, which matched the actual circumstances better. Secondly, the data we used were all objective noninvasive indicators, which can be obtained even in routine examinations. We did not add the description of chest pain symptoms to the model, so the model did not rely on the experience of the physicians, nor the patient description. Thirdly, we used the results of coronary angiography instead of CCTA as the gold standard and we used 70% stenosis as severe CAD cutoff. We hoped to screen out those who did not need coronary intervention. Fourthly, during the establishment of our models, we did not utilize data from the test set which would bring stronger generalization capability of our models.
There are several limitations of the present study that are noteworthy to mention. Firstly, we only included patients from a single center of which most were Chinese population. It would limit the application of the model, but at least the performance of the model has confirmed the feasibility of the scheme. With the accumulation of the amount of data, the performance would be better. Secondly, as a retrospective study, the missing values in our data would certainly affect the performance of our model and cause bias, though we have performed GROUSE algorithm to improve the result. Another problem was that some of our patients had already been prescribed with statins, which would certainly cause the predictive value of LDL-C lower while some of our patients had not. However, this would certainly happen in clinical practice. Thirdly, we used 70% stenosis as the cut-off value of severe CAD. However, under certain circumstances, it is difficult to distinguish 30%, 50%, and 70% stenosis through CAG itself. Systematic errors may occur when a plaque is eccentric so that when assessed with intravascular ultrasound, the stenosis may be as great as 70% while being labelled as 40% by CAG. Fourthly, our NPVs were not particularly high, so in the future we may still need more data to refine our models to improve their performances. Considering that our models do not increase the cost or trauma of patients, and we did not include the symptoms in our model, the results are relatively acceptable.
Indeed, different populations, device differences, different CAD cutoffs, different methods of missing value imputation, different random seeds and model construction all affect the final results and the application of the models. For example, during our 10-fold validation, 10 different models were established, and the AUCs of them varied from 0.73 to 0.81. But at least, we found that machine learning algorithms were feasible in excluding patients without severe CAD. In the future, we might need to increase the number of features and expand the amount of data to improve the performances of the models.
Moreover, this study also showed two limitations. First, this study has not calculated and compared the predictive performance of updated Diamond and Forrester (UDF), CAD consortium 2 (CAD2), and CONFIRM registry scores in our cohort alongside the model. This kind of comparison might provide more valuable insights into the effectiveness of our approach. Second, the present model is based on the data from Chinese patients, therefore, it might bring some bias when applying this model to patients of different nationalities.
Conclusions
We developed machine learning models using data from the Electronic Hospital Information System for the exclusion and confirmation of severe obstructive CAD on CAG. The utilization of such models may improve decisions in low- to intermediate-risk patients regarding the need for further testing such as CCTA or CAG with a relatively low cost. This effort may be a potential step towards the development of a machine learning-based tool to help patients avoid unnecessary CAG in outpatient clinics or routine medical examination.


