
Introduction
Myasthenia gravis (MG) is a relatively uncommon neuromuscular disease. The thymus plays an important role in the pathogenesis of MG, with 70% of patients presenting with thymic follicular hyperplasia and 20% presenting with thymoma [1]. The World Health Organization (WHO) histologic classification and Masaoka classification are the most commonly used scales for thymoma management. The WHO histologic classification was established according to epithelial cell morphologies and the ratio of lymphocytes to epithelial cells and reflects the clinical and functional features of thymomas, which can be used in clinical practice to assess and treat patients with thymomas [2]. The WHO classification system classifies thymomas into five types: A, AB, B1, B2, and B3 [3]. In contrast, the Masaoka classification is established post-surgically, based on the tumor extent, and tumors are defined as stages I, II, III, and IV [4]. This classification system has been recognized as being a valuable prognostic indicator and has been significantly correlated with overall survival. Therefore, developing a method that can predict the subtypes and stages of thymomas preoperatively is an important goal. In clinical practice, thymomas usually are grouped into simplified subgroups, such as low-risk (types A, AB, and B1) and high-risk (types B2 and B3) or non-invasive (stage I) and invasive (stages II, III, and IV). Sadohara et al. found that magnetic resonance imaging (MRI) can help distinguish low-risk thymomas from high-risk thymomas [5]. Takahashi et al. suggested that MRI may be superior to computed tomography (CT) for defining the invasion of contiguous structures [6]. However, other studies have not revealed significant differences between the imaging characteristics with subtypes [7, 8]. Although Priola et al. determined that thymomas in patients with MG were smaller than those in patients without MG [9], available imaging data for thymomas in patients with MG remain limited. This study aimed to determine the MRI features of thymoma, according to the simplified WHO histologic classification and the Masaoka classification.
Material and methods
Patient population
The institutional review board of Hanoi Medical University approved this study (Ref: 164B/HĐĐĐĐHYHN, dated 10 December 2014). This study was conducted from August 2014 to September 2018 in Vietnam, and the data were prospectively assessed. The inclusion criteria were as follows: the new onset of generalized MG, an anterior mediastinal mass found on MRI, and a definitive diagnosis of thymoma, established pathologically following surgical resection. The exclusion criteria were as follows: under the age of 16 years and treated with neoadjuvant chemoradiotherapy before surgery. After criteria were met, 46 consecutive subjects (26 men and 20 women; age range 22–73 years, median age 48 years; men: 22–73 years, 46 years; women: 22–68 years, 52 years) were enrolled in this study. No significant age difference was identified between men and women (p = 0.349). MRI was performed shortly before surgery.
Magnetic resonance imaging
All examinations were performed using a 1.5-Tesla (T) MRI machine (Intera-Achieva; Philips Healthcare, Best, the Netherlands), with a phased-array surface coil (Torso coil with 8 channels), from the thoracic inlet to the cardiophrenic angle. The same protocol was performed for all patients, including T1- and T2-weighted imaging, with and without fat suppression, black blood technique, and T1-weighted in-phase and opposed-phase. Axial pre- and post-3-dimensional (3D) fast, spoiled gradient-echo imaging, with subtraction (THRIVE), was also performed. The sequence parameters are listed in Table 1.
Table 1
Thymic magnetic resonance imaging protocol
Imaging assessment
Two radiologists, with 20 and 23 years of experience, without knowledge of the patients’ information, independently analyzed all imaging data. Any discrepancies were resolved by discussion until a consensus was reached.
The collected data included the shape of the tumor, the level of necrosis, attenuation, and the signal intensity and homogeneity of T1- and T2-weighted images. The tumor signal intensities of T1- and T2-weighted images were divided into either higher than muscle but lower than fat or other. Necrotic or cystic components were presumed to be present when an area of low-signal intensity was observed on T1-weighted images and high signal intensity was observed on T2-weighted images [5]. Homogeneity was recorded as either homogeneous or heterogeneous signal intensity [5]. Tumor size was measured in three dimensions. The long axis was measured on the cross-sectional image, at the level at which the tumor appeared the largest. The short axis was measured perpendicular to the long axis, in the same image [5]. If the long axis to short axis ratio was less than 1.5, the tumor was considered to be round in shape [10]. The margin was divided into smooth and lobulated contours [10]. Smooth lesions are typically spherical or ovoidal in shape. A lobulated contour exhibits one or more lobulations, characterized as convex tumor contours, with adjacent notches between tumor lobules [11]. The mass capsule was defined as a low-intensity, thin rim, observed in the periphery of the tumor [5]. The invasion of the great vessels was determined when the tumor signal interrupted or obliterated a vessel wall signal on MRI or when overt tumor thrombosis and vascular occlusion were identified [5].
To calculate the chemical-shift ratio (CSR), signal intensity measurements within the thymus and chest wall muscles were obtained by using region-of-interest (ROI) analysis (area sizes of 0.5–1 cm2, for the thymus gland, and 1–2 cm2, for the chest wall muscle). The ROI selection was first performed on the opposed-phase image, in the area that exhibited the highest signal intensity. The ROI was then mirrored on the in-phase image, in the exact same position and at the same size. Measurements were made in the central position, instead of peripheral areas, to avoid partial volume effects. In addition, measurements were avoided in areas containing void signals, such as at the interfaces between fat-dominant and water-dominant tissues (India ink artifacts) [12]. Measurements were also avoided in cystic or necrotic components on T2-weighted images. In the chest wall muscle, we avoided measurements in fat strips [13].
The CSR was determined by comparing the signal intensity of the thymus gland (tSI) with that of the paraspinal muscle (mSI), on both in-phase (in) and opposed-phase (op) images. The CSR was calculated according to the following equation [13]:
Type and stage
The surgically removed tissues were examined by an experienced histopathologist. According to the 2015 WHO classification, the tumors were divided into six subtypes, based on histopathological features: type A (Fig. 1), AB (Fig. 2), B1 (Fig. 3), B2 (Fig. 4), B3 (Fig. 5), and thymic carcinoma (type C) [3]. To simplify the WHO histologic classification, the tumors were also regrouped into three subgroups: low-risk thymomas (types A, AB, and B1), high-risk thymomas (types B2 and B3), and thymic carcinomas (type C) [8].
Fig. 1
A 56-year-old man with type A thymoma, stage II. Transverse MR images show an anterior mediastinal mass with round shape, smooth margin, and complete capsule as low-intensity rim. The thymoma has relatively high signal intensity on both T1-weighted (A) and T2-weighted (B) images
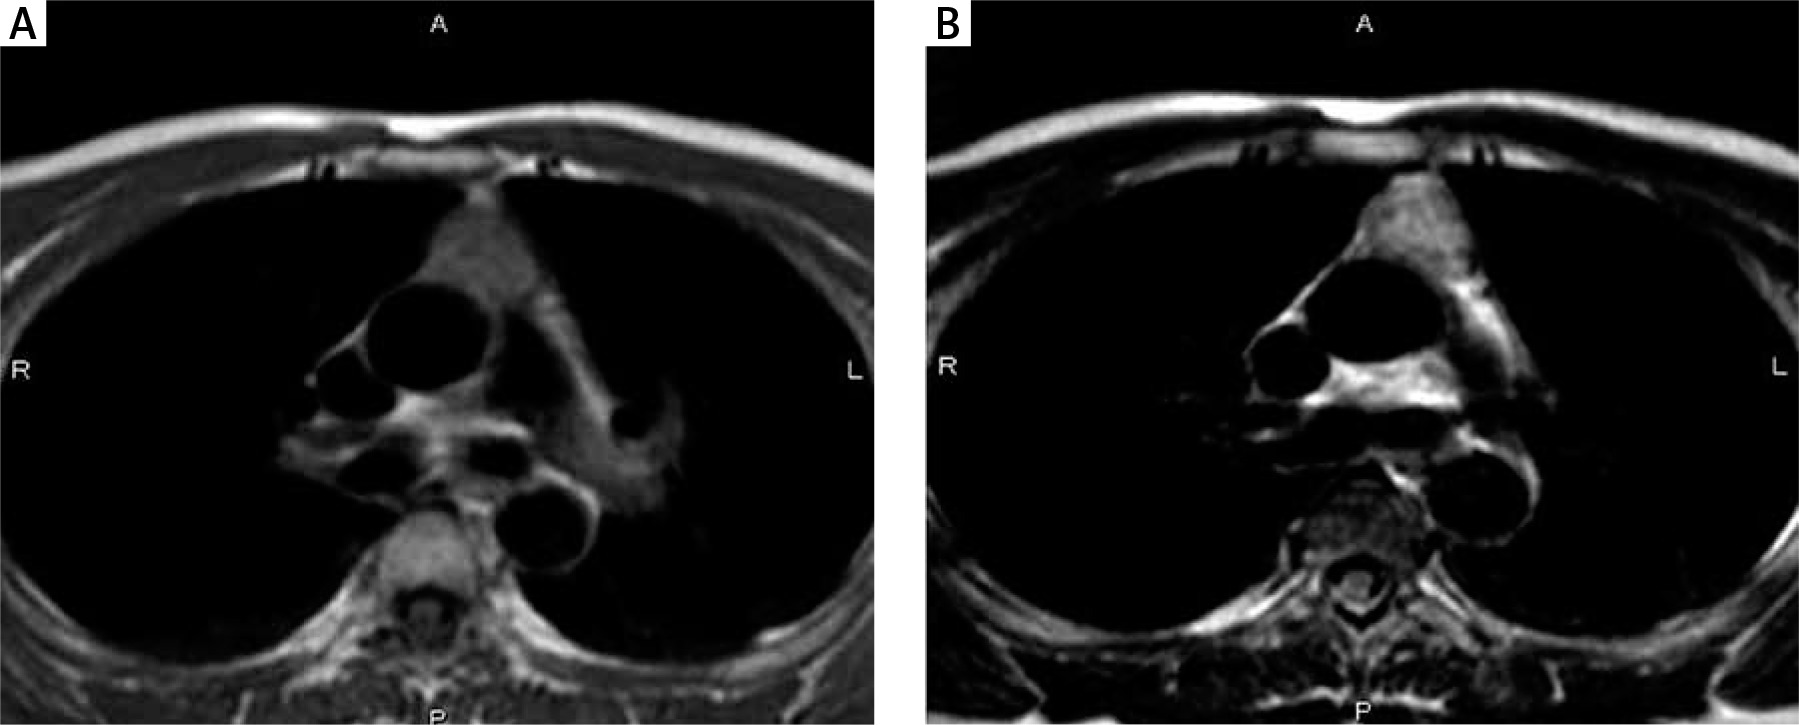
Fig. 2
A 53-year-old woman with type AB thymoma, stage I. Transverse MR images show an anterior mediastinal mass with round shape, smooth margin, and complete capsule as low-intensity rim. The thymoma has relatively high signal intensity on both T1-weighted (A) and T2-weighted (B) images
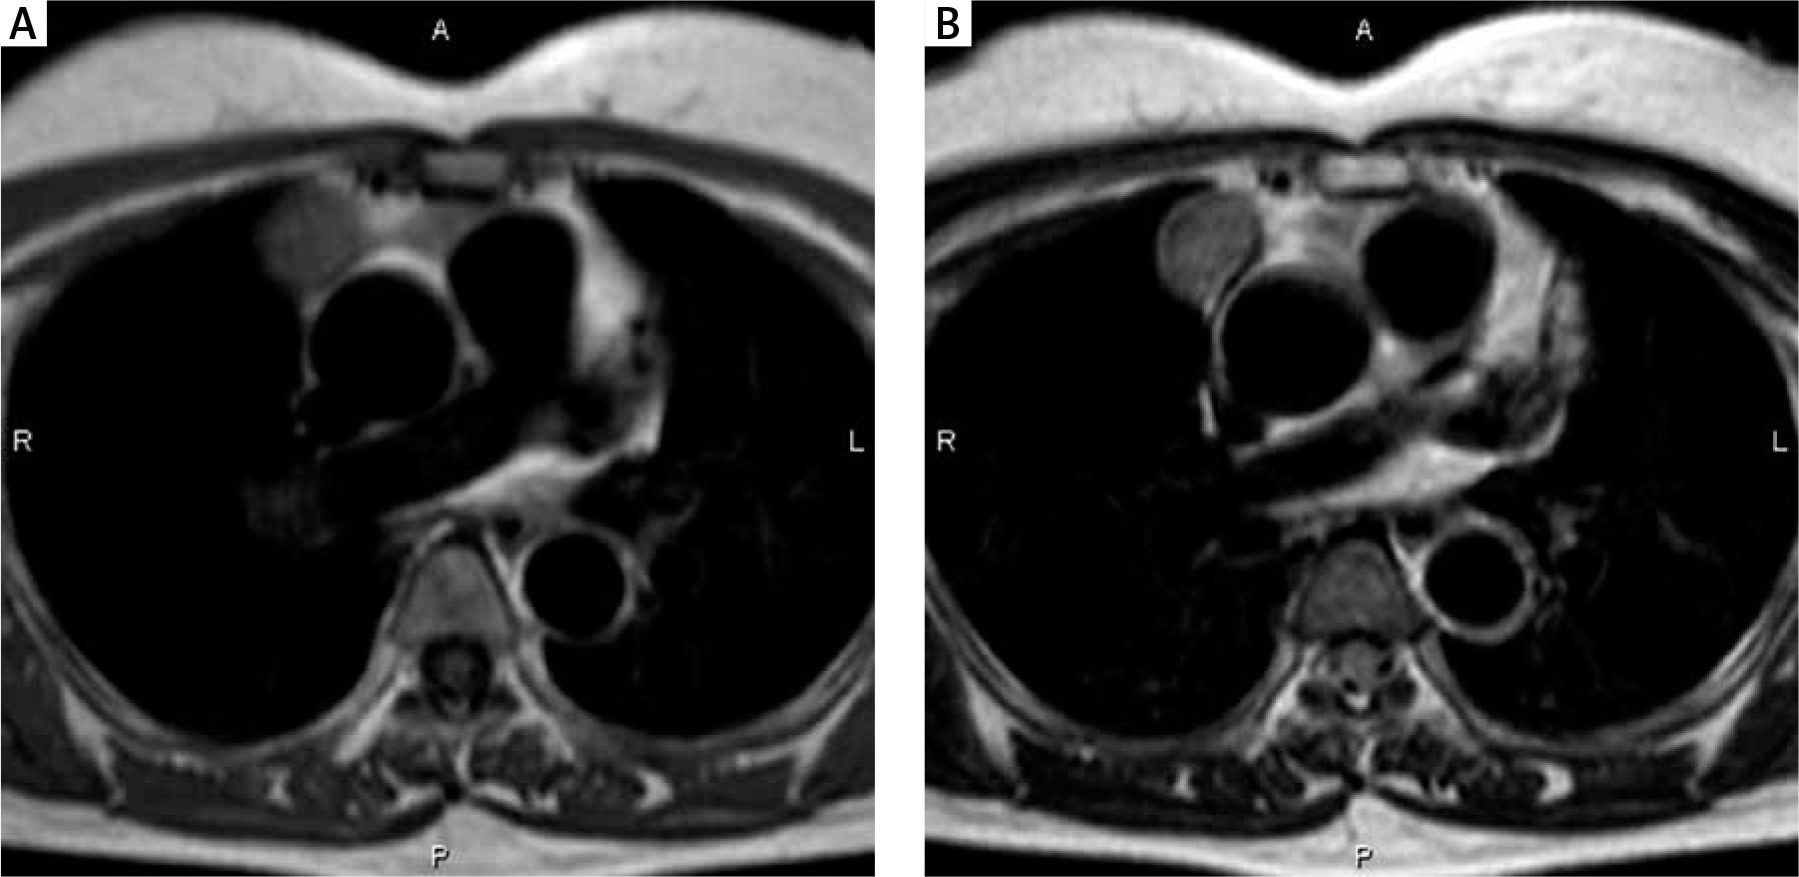
Fig. 3
A 45-year-old man with type B1 thymoma, stage III. Transverse MR images show an anterior mediastinal mass with round shape, smooth margin, partial capsule as low-intensity rim, and relatively high signal intensity on both T1-weighted (A) and T2-weighted (B) images
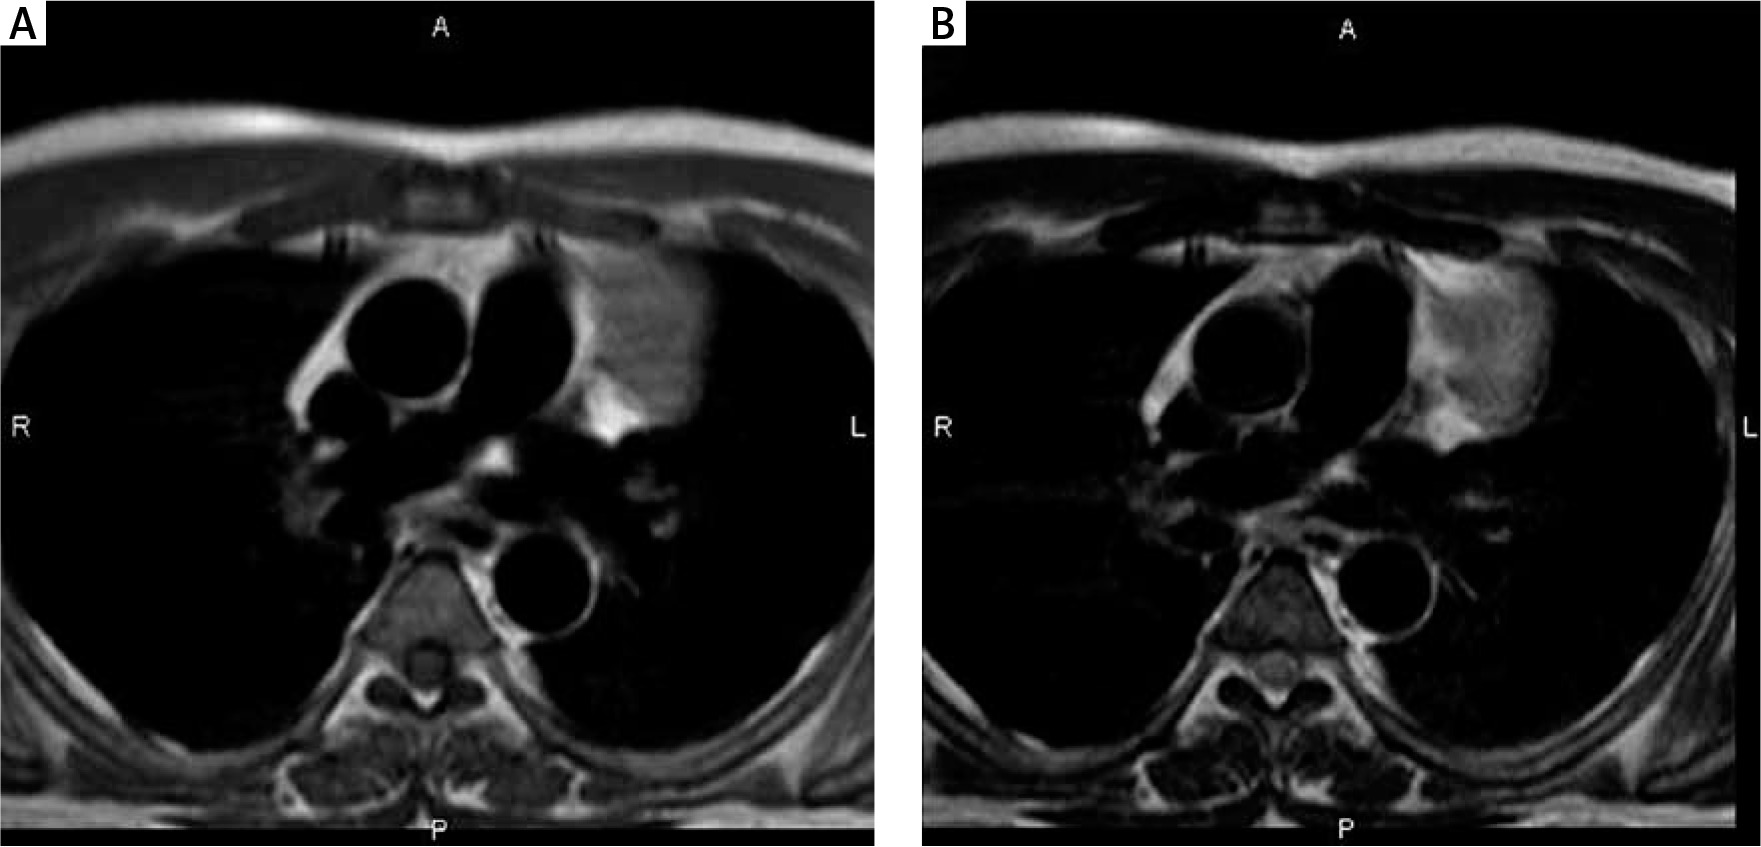
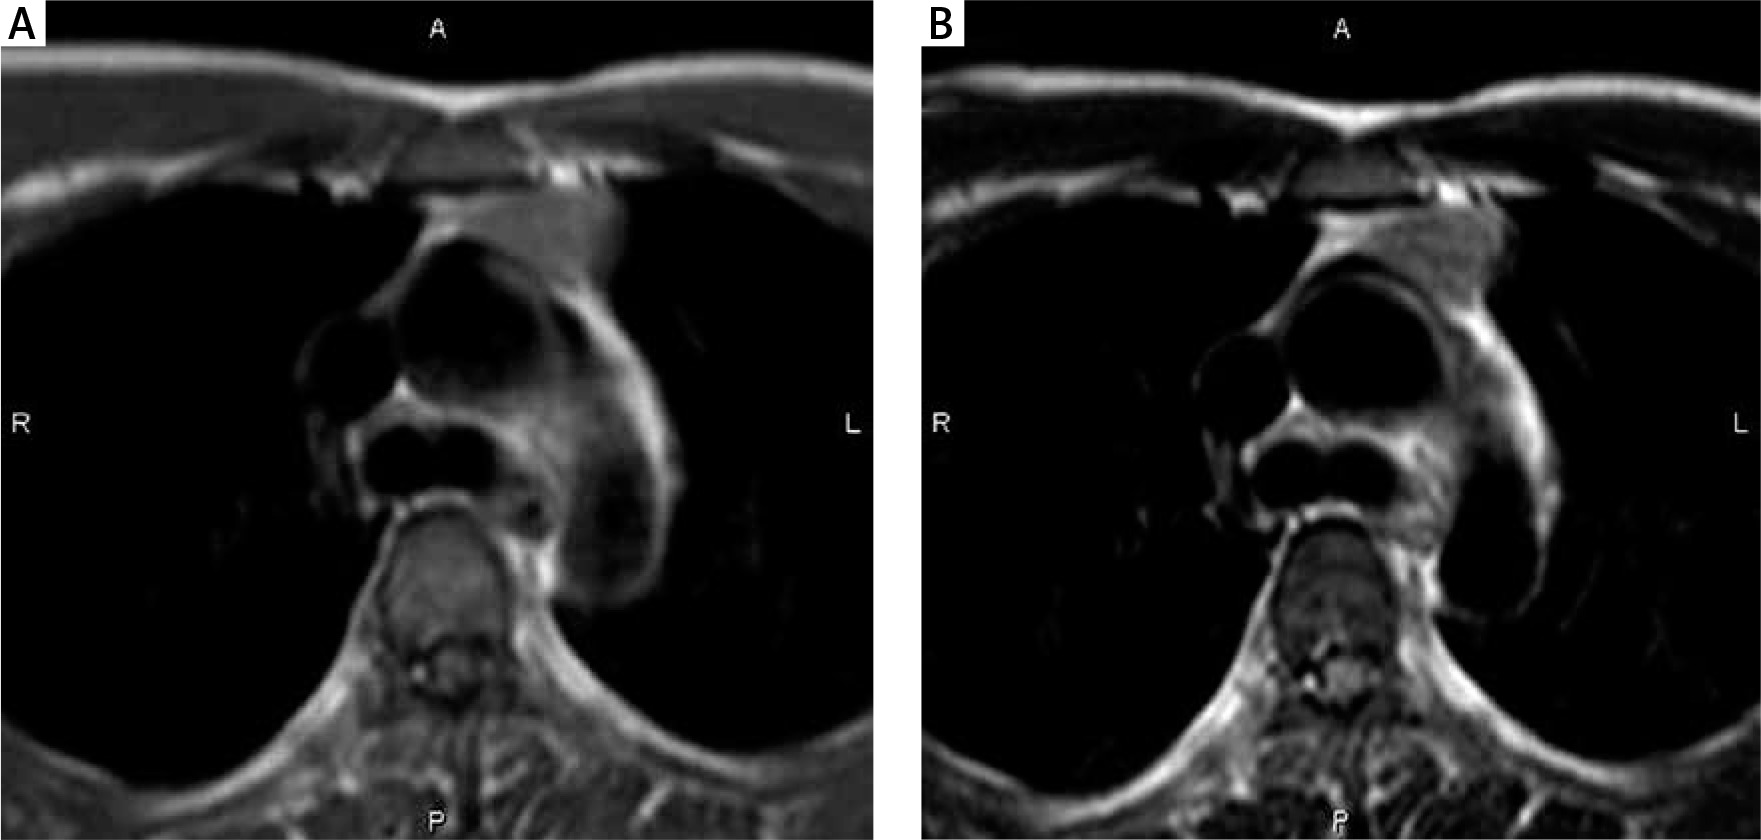
Fig. 4
A 52-year-old woman with type B2 thymoma, stage IVa. Transverse T1-weighted and T2-weighted MR images show a large mass with invasion of superior vena cava and innominate vein on both T1-weighted (A) and T2-weighted (B) images
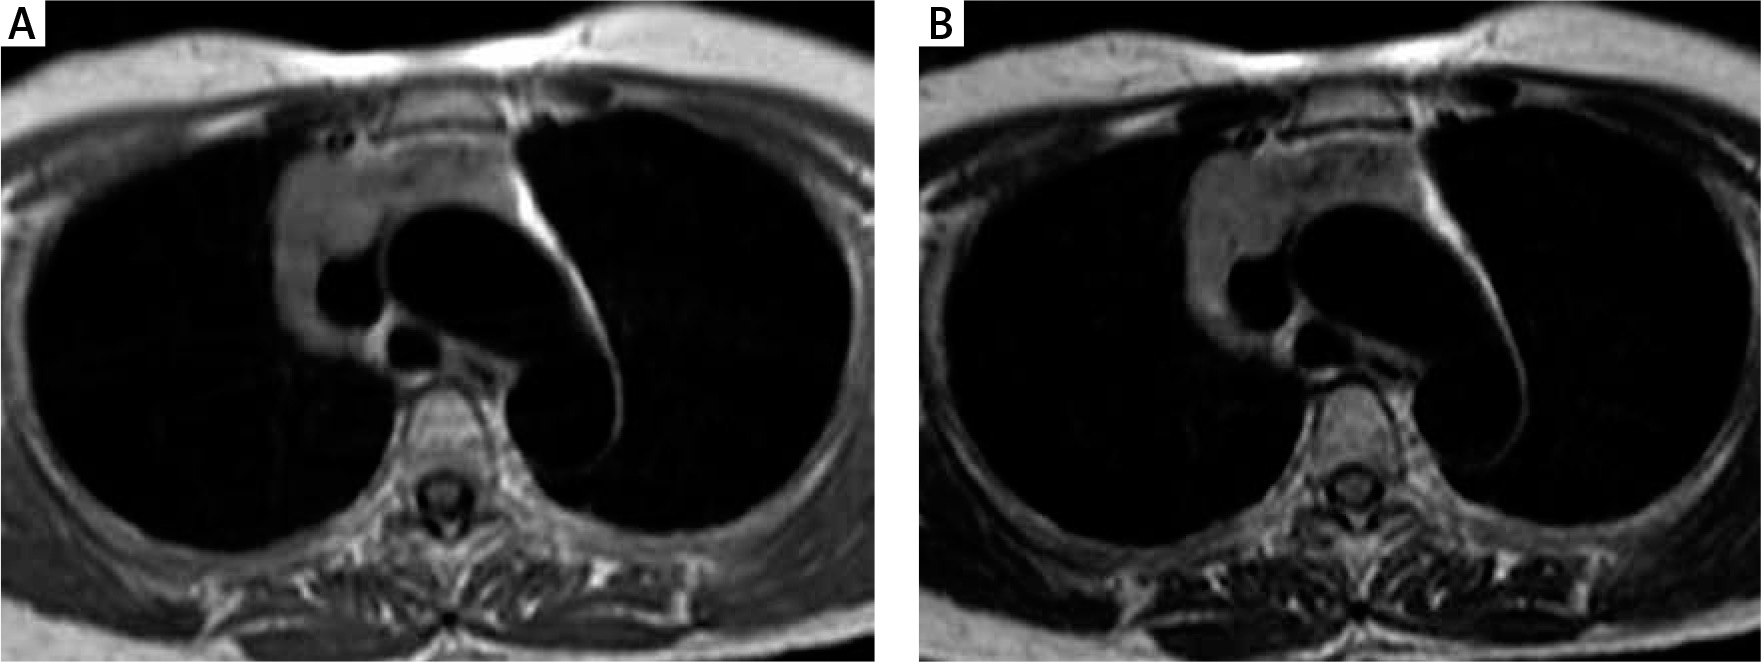
Fig. 5
A 42-year-old man with type B3 thymoma, stage III. Transverse T1-weighted (A) and T2-weighted (B) MR images show a mass with round shape, smooth margin, and heterogeneous signal intensity
According to the Masaoka classification, the tumors were also divided into four stages, according to both surgical findings and microscopic examinations, depending on the presence and extent of transcapsular invasion into adjacent mediastinal tissues. Stage I tumors were defined as non-invasive, whereas stages II, III, and IV were defined as invasive tumors [4].
Statistical analysis
SPSS version 16.0 (SPSS Inc., Chicago, USA) was employed for data analysis. Quantitative parameters are expressed as the mean ±standard deviation. All data were normally distributed, based on the Shapiro-Wilk test. The χ2 test or Fisher’s exact test and Student’s t-test were used for comparisons of qualitative and quantitative parameters, respectively, between the various subtypes and stages. A p-value < 0.05 was considered significant.
Results
According to the WHO classification criteria, the 46 thymomas in this study were subdivided into 7 type A, 18 type AB, 9 type B1, 11 type B2, and 1 type B3 thymomas. According to the Masaoka classification criteria, the thymomas included 16 stage I, 14 stage II, 13 stage III, and 3 stage Iva thymomas. The proportions of each type of thymoma that were found to be invasive were 28.6%, 61.1%, 66.7%, 90.9%, and 100%, for types A, AB, B1, B2, and B3, respectively. Generally, 65.2% of thymomas in patients with MG were classified as invasive. When the simplified WHO histological classification was correlated with invasiveness, based on the Masaoka staging classification, 19 of 34 low-risk thymomas were classified as invasive, whereas 11 of 12 high-risk thymomas were classified as invasive, which represented a significant difference (p < 0.05) (Table 2).
Table 2
Stage and incidence of invasive thymomas, according to WHO classification
| Types | Stages | Total | Incidence of invasive tumors (%) | |||
|---|---|---|---|---|---|---|
| I | II | III | IVa | |||
| A | 5 | 1 | 1 | 0 | 7 | 28.6 |
| AB | 7 | 5 | 6 | 0 | 18 | 61.1 |
| B1 | 3 | 4 | 2 | 0 | 9 | 66.7 |
| B2 | 1 | 4 | 3 | 3 | 11 | 90.9 |
| B3 | 0 | 0 | 1 | 0 | 1 | 100 |
| Total | 16 | 14 | 13 | 3 | 46 | 65.2 |
When comparing the MRI findings based on the simplified WHO histologic classification [low-risk thymomas (A, AB, and B1) vs. high-risk thymomas (B2 and B3)], heterogeneous signal intensities on T1- and T2-weighted images were more commonly observed in high-risk thymomas (10 of 12, 83.3% and 11 of 12, 91.7%, respectively) than in low-risk thymoma (13 of 34, 38.2% and 15 of 34, 44.1%, respectively). Necrosis and cysts were also more commonly observed in high-risk thymomas (9 of 12, 75%) than in low-risk thymomas (11 of 34, 32.4%). These differences were significant (p < 0.05, Table 3).
Table 3
Magnetic resonance imaging findings for thymomas, according to WHO classification
Table 4 presents the MRI characteristics observed among thymomas, classified according to the Masaoka classification. Non-invasive (stage I) thymomas were more likely to present smooth margins (12 of 16, 75%) than invasive (stage II, III, and IV) thymomas (11 of 30, 36.7%). Stage I thymomas were also smaller than the other stages, but the difference was not significant (p > 0.05). Differences observed in other characteristic figures were also not significant. Invasiveness was detected on MRI in only 5 of 30 invasive thymomas.
Table 4
Magnetic resonance imaging findings among thymomas, according to the Masaoka classification
Discussion
The characteristic thymoma features identified in this study were similar to those reported in previous studies [14, 15]. Thymoma appears as a mass, with low signal intensity on T1-weighted images and high signal intensity on T2-weighted images. Heterogeneity in both T1- and T2-weighted images was common, due to the presence of necrosis and cysts. The majority of thymomas presented round or ovoidal shapes, with a partial or complete capsule. All thymomas showed the absence of any decrease in signal intensity on opposed-phase images, compared with the in-phase images, with a mean CSR of 1.02 ±0.07.
The WHO histological classification has been associated with both prognosis and clinical characteristics. Type A and AB thymomas are considered benign and can be easily removed by endoscopic surgery. Additionally, types A, AB, and B1 thymomas develop more slowly and are easier to remove completely than types B2 and B3 [16, 17]. The WHO histological classification has also been associated with the clinical stage. The proportions of invasive tumors (stages II, III, and IV) tended to increase among high-risk thymomas (types B2 and B3) and thymic carcinomas compared with low-risk thymomas (types A, AB, and B1) [8]. In the present study, the proportion of invasive thymomas tended to increase in the following order: type A (28.6%), type AB (61.1%), type B1 (66.7%), type B2 (90.9%), and type B3 (100%). The portion of invasive thymomas identified in the high-risk group (11 of 12, 91.7%) was also higher than that in the low-risk group (19 of 34, 55.9%, p < 0.05).
In correlation with the WHO histological classification, Inoue et al. found that type A thymomas are more likely to display smooth contours and rounded shapes than other types of thymomas. The diameters of type A thymomas were also significantly smaller than those of type AB, B1, B2, and B3 tumors and thymic carcinomas [16]. Tomiyama et al. described smooth contours and a rounded shape as being the features most suggestive of type A thymoma, whereas irregular contours were more evocative of thymic carcinoma. Heterogeneity was more often observed in type B3 thymomas and thymic carcinomas than in type A, AB, B1, or B2 thymomas [18]. Previous studies have shown that differences in imaging characteristics were more commonly identified between thymic carcinoma and other types of thymomas, whereas the differences among the other types were minimal. In this study, because no carcinomas and only one type B3 thymoma were identified, we were only able to correlate the MRI features with the simplified WHO histologic classification. The present study demonstrated that heterogeneous signal intensities on T1- and T2-weighted images were significantly more common among high-risk thymomas (10 of 12, 83.3% and 11 of 12, 91.7%, respectively) than among low-risk thymomas (13 of 34, 38.2% and 15 of 34, 44.1%, respectively). The high-risk thymomas also displayed more necrosis and cysts than low-risk thymomas. Jeong et al. described lobulated contours as being more commonly observed among high-risk thymomas and thymic carcinomas than among low-risk thymomas [8]. Sadohara et al. described the MRI findings of an almost complete capsule, septum, and homogenous enhancement as being associated with low-risk thymomas but not with high-risk thymomas and thymic carcinomas. These differences were significant [5].
Invasive thymomas were more likely to display lobulated margins (19 of 30, 63.3%) than non-invasive thymomas (4 of 16, 25%). Invasive thymomas were non-significantly longer than non-invasive thymomas. Priola et al. reported that invasive thymomas more commonly presented lobulated margins (17/32, 53% vs. 9/26, 35%) or irregular margins (6/32, 19% vs. 1/26, 4%) than non-invasive thymomas. The long and short axes of the invasive group were significantly longer than those of the non-invasive group (p < 0.01 and p < 0.05, respectively). The same study reported that lesion sizes in patients with MG were smaller than those of the remaining subjects [9]. Tomiyama et al. demonstrated that invasive thymomas were more likely to display lobulated (16/27, 59%) or irregular (6/27, 22%) contours than non-invasive thymomas (8/23, 35% and 1.5/23, 6%, respectively). However, they also found that CT had low specificity for assessing the infiltration of adjacent mediastinal structures, including the pleura, lung, and chest wall [19]. Although MRI is considered to be superior to CT for identifying invasiveness, minimal invasion could not be detected on MRI. Although the complete obliteration of adjacent fat planes is highly suggestive of a mediastinal invasion, partial obliteration is indeterminate. The complete preservation of adjacent fat planes usually excludes extensive invasive disease but does not exclude minimal capsular invasion [6]. In our study, invasiveness was successfully detected in only 5 of 30 invasive thymomas, including 4 stage III thymomas and 1 stage IVa thymoma. Invasiveness was not detected in any of the 14 stage II thymomas and was also missed in 9 stage III thymomas and 2 stage IVa thymomas.
This study has some limitations. First, the sample size was small, and only one type B3 thymoma was identified. In addition, in this study, we had no patient with thymic carcinoma. Second, diffusion-weighted MRI was not performed. Some studies have reported that this sequence may be valuable for determining the malignancy of tumors, based on restricted diffusion and low apparent diffusion coefficient (ADC) values. Therefore, further studies with multicenter involvement and larger samples should be performed to validate our findings.


