


The mean systemic filling pressure (Pms) is the pressure that develops in the systemic circulation if the heart suddenly stops [1]. The importance of Pms for vascular status was first studied by the physiologist Arthur Guyton. His view was that the heart fills passively. Therefore, cardiac output (CO) is determined by the venous return (VR), which is, in turn, driven by the difference between Pms and the central venous pressure (CVP) and modified by other factors that oppose venous return (RVR). The theories surrounding the role of Pms as a key determinant of circulation are sometimes called “Guyton’s haemodynamics” and offer complementary views on how to interpret haemodynamic data [2]. Guyton’s experiments were performed on animals in a highly controlled laboratory environment; however, results in humans published during the past 20 years support key elements in Guyton’s haemodynamic theories [3].
The key problem is that Pms is difficult to measure, which has necessitated the development of predictive algorithms. One analogue, called Pmsa, is based on CVP, mean arterial pressure (MAP), and CO [4, 5]. This analogue is implemented in a commercially marketed monitor: Navigator (Applied Physiology, Pty Ltd., Sydney, Australia). Cecconi et al. [6] connected a Navigator module to a pulse contour haemodynamic monitor and recorded Guyton’s variables in postsurgical patients. Their reported haemodynamic changes showed great variability but agreed with Guyton’s views. Later evaluations have compared Pmsa with more invasive laboratory me-thods of measuring Pms [7–10]. A review by Cooke et al. found that Pmsa was lower in fluid responders than in non-responders, but the studied patients were usually subjected to complex treatments, including intensive care [11].
The objective of the present report was to evaluate if Pmsa can predict whether a patient is fluid responsive in the clinical setting with as few confounders involved as possible. Measurements were performed before general anaesthesia was induced and just before surgery was to begin, and without the involvement of adrenergic drugs. The assessment of fluid responsiveness is the key methodology used for clinical evaluation of the need for fluid administration during surgery and intensive care. A secondary objective was to let Pmsa estimate the increase in unstressed blood volume that occurs when general anaesthesia is induced. This shows how much the vascular space increases by anaesthesia-induced vasoplegia, and this is, to our knowledge, a novel use of Pmsa.
The hypotheses were that Pmsa predicts fluid responsiveness and that data on Pmsa can provide information about unstressed blood volume. The null hypotheses were that Pmsa could not predict fluid responsiveness and not indicate the anaesthesia-induced change in unstressed blood volume.
METHODS
Patients
This is a retrospective analysis of a prospective non-randomized clinical study that included patients with suspected or established gastric, colonic, or rectal cancer, who were recruited to participate in an open-label clinical trial [12, 13]. They underwent laparoscopic or open gastrointestinal surgery under combined intravenous and inhalational general anaesthesia. Exclusion criteria were liver or renal dysfunction (liver enzymes > 50% or serum creatinine > 50% of normal), coagulation disturbances, obstructive pulmonary disease, atrial fibrillation, and mental disorders.
The protocol was approved by the Ethics Committee of the First Affiliated Hospital, College of Medicine, Zhejiang University (Hangzhou, PR of China; No. 2011150, Official in charge: Zhangfei Shou). Written informed consent was obtained from each study subject.
Anaesthesia
The patients fasted overnight, and no premedication was given. At 8 a.m., anaesthesia was induced and tracheal intubation performed after injecting appropriate amounts of propofol, fentanyl, and cisatracurium. The patients were mechanically ventilated using a tidal volume of 8 mL kg–1, 12 breaths/min, and a positive end-expiratory pressure of 3 cm H2O. The anaesthesia was guided with 1-2% of sevoflurane and continuous infusions, and remifentanil to reach a bispectral index (BIS monitor) value of between 40 and 60. No adrenergic drugs were administered, but the attending anaesthetist was allowed to provide rescue drug medication to treat arterial hypotension.
Fluid program
No fluid was infused during the induction of general anaesthesia. Beginning 10–15 min after the tracheal intubation, 3 bolus infusions of 6% hydroxyethyl starch 130/0.4 (Voluven®; Fresenius Kabi Deutschland GmbH, Bad Homburg, Germany) were given in the volume at 3 mL kg–1 over 7 min via an infusion pump (IEC 601-1; Abbott Laboratories, Chicago, IL). The haemodynamic response was recorded 5 min after the end of each bolus infusion. The flat recumbent body position was maintained, and surgery was not initiated until all 3 optimizations had been completed. All patients received all 3 bolus infusions regardless of the haemodynamic response. No crystalloid fluid was given.
Measurements
When the patient entered the operating theatre, catheterization of the left radial artery and right internal jugular vein was performed under local anaesthesia and sedation by midazolam. The arterial line was connected to a FloTrac™ sensor, from which data were sent for analysis to a Vigileo monitor (Software version 3.6; Edwards Lifesciences, Irvine, CA). The arterial waveform pulse contour was used to calculate the stroke volume (SV). Monitoring also included central venous pressure (CVP), pulse oximetry, electrocardiography, and heart rate. These data were saved digitally on a multifunction monitor (Datex-Ohmeda, Hoevelaken, Netherlands).
The CVP was calibrated against the atmospheric pressure prior to induction of anaesthesia. The zero point corresponded to the level of the 4th rib in the anterior axillary line. The effect of a few extreme outliers was reduced by setting transient changes in CVP > 4 mmHg in response to a single bolus infusion at 4 mmHg.
Data on central haemodynamics were collected before and after induction of anaesthesia, just before the first bolus infusion was initiated, and again 5 min after each of the bolus infusions ended.
Fluid responsiveness
The target in flow-guided optimization with fluid loading is to reach the top of the Frank-Starling curve. Therefore, the patient is a responder if a bolus infusion raises the SV by ≥ 10% and a non-responder if the increase is < 10% [14, 15]. As flow-guided optimization implies a titration process, a bolus is indicated if given after an infusion in which the patient was fluid-responsive, but the subsequent bolus is warranted only if the SV increases by ≥ 10%.
Guyton’s haemodynamic variables
An analogue to the Pmsa has been derived from measurements of CVP, MAP, and CO, assuming a constant veno-arterial compliance of 24 : 1 [4–6]:
Pmsa = a CVP + b MAP + c CO,
where a = 0.96, b = 0.04 (a + b = 1), and c = 0.96 × 1/26 × systemic vascular resistance at rest. However, c is commonly derived from anthropometric data. The value of c varies between 0.3 and 1.2 depending on age and body constitution (average 0.6) and is calculated as follows [6]:
c = 0.038 (94.17 + 0.193 age)/[4.5 (0.99age-15 0.007184 (height0.725) weight0.425].
The pressure gradient for venous return (driving force for venous return – dVR) is obtained as: dVR = Pmsa – CVP.
The global pumping efficiency (Eh) is calculated as: Eh = (Pmsa – CVP)/Pmsa.
The resistance to venous return (RVR) was obtained as: RVR = dVR/CO.
Blood volume
The blood volume changes in response to the bolus infusions were calculated by multiplying the change in the blood haemoglobin concentration with the baseline blood volume, which was estimated based on the height and weight of each patient as follows [16]:
BV (L, females) = 0.03308 weight (kg) + 0.3561 height3 (m) + 0.1833,
BV (L, males) = 0.03219 weight (kg) + 0.3669 height3 (m) + 0.6041.
The BV expansion in response to a fluid bolus was calculated before (time 1) and after (time 2) the infusion according to the following equation:
△BV2 – 1 = BV1 [(Hb1/Hb2)] – BV1
Statistical analysis
The data are presented as mean ± SD, and differences in haemodynamic parameters between groups evaluated by one-way analysis of variance (ANOVA). Changes over time were studied by repeated measures ANOVA followed by the Scheffé test. No data with skewed distribution are reported. P < 0.05 was considered statistically significant.
Receiver operator characteristic (ROC) curves were used to calculate the sensitivity and specificity of Pmsa (continuous variable) to predict fluid responsiveness (dichotomous variable) using the IBM SPSS Statistics Version 22. The given prediction is statistically significant if the 95% confidence interval does not include 0.5.
RESULTS
The cohort consisted of 86 patients (65% males). Data were lacking from 7 patients, which was due to a missing central venous catheter (n = 5), arterial pressure (n = 1), and stroke volume (n = 1). Hence, the final analysis consisted of 79 subjects who were 56 ± 13 years old, had a height of 184 ± 8 cm, and body weight of 60 ± 8 kg. All these patients received 3 bolus infusions after general anaesthesia had been induced.
Haemodynamics
The haemodynamic data are summarized in Table 1. All parameters showed highly significant changes during the study (repeated-measures ANOVA, P < 0.001, except MAP, P < 0.01). SAV, MAP, Pmsa, Eh, dVR, and VR (but not CVP) decreased after the induction of anaesthesia but then showed an increasing trend. Each increase was statistically significant by P < 0.05 based on the Scheffé test, the only exceptions being MAP, dVR after the 3rd bolus, RVR between the 2nd and 3rd bolus, and VR between the 1st and 3rd bolus.
TABLE 1
Basic haemodynamic data for all patients. Data are presented as mean ± SD
Fluid responsiveness
Fluid responsiveness was present in 63%, 44%, and 21% of the patients during the 1st, 2nd, and 3rd bolus infusion, respectively, the criterion being that SV needed to increase by ≥ 10%.
Figure 1 shows that ROC curves revealed that Pmsa could separate responders from non-responders with an AUC of approximately 65–70% before administration of any of the bolus infusions; the 95% confidence interval never reached 0.5, and thus allows the first null hypothesis to be rejected. Fluid responsiveness could be indicated even before anaesthesia induction.
FIGURE 1
Receiver operating characteristic (ROC) curves were used to express the ability of Pmsa to predict whether a patient is fluid responsive during a subsequent bolus infusion. The thick numbers are the optimal cut-off, and the thin red digits provide orientation on the curve. The optimal cut-offs for Pmsa were 14, 12, 12, and 12 mmHg
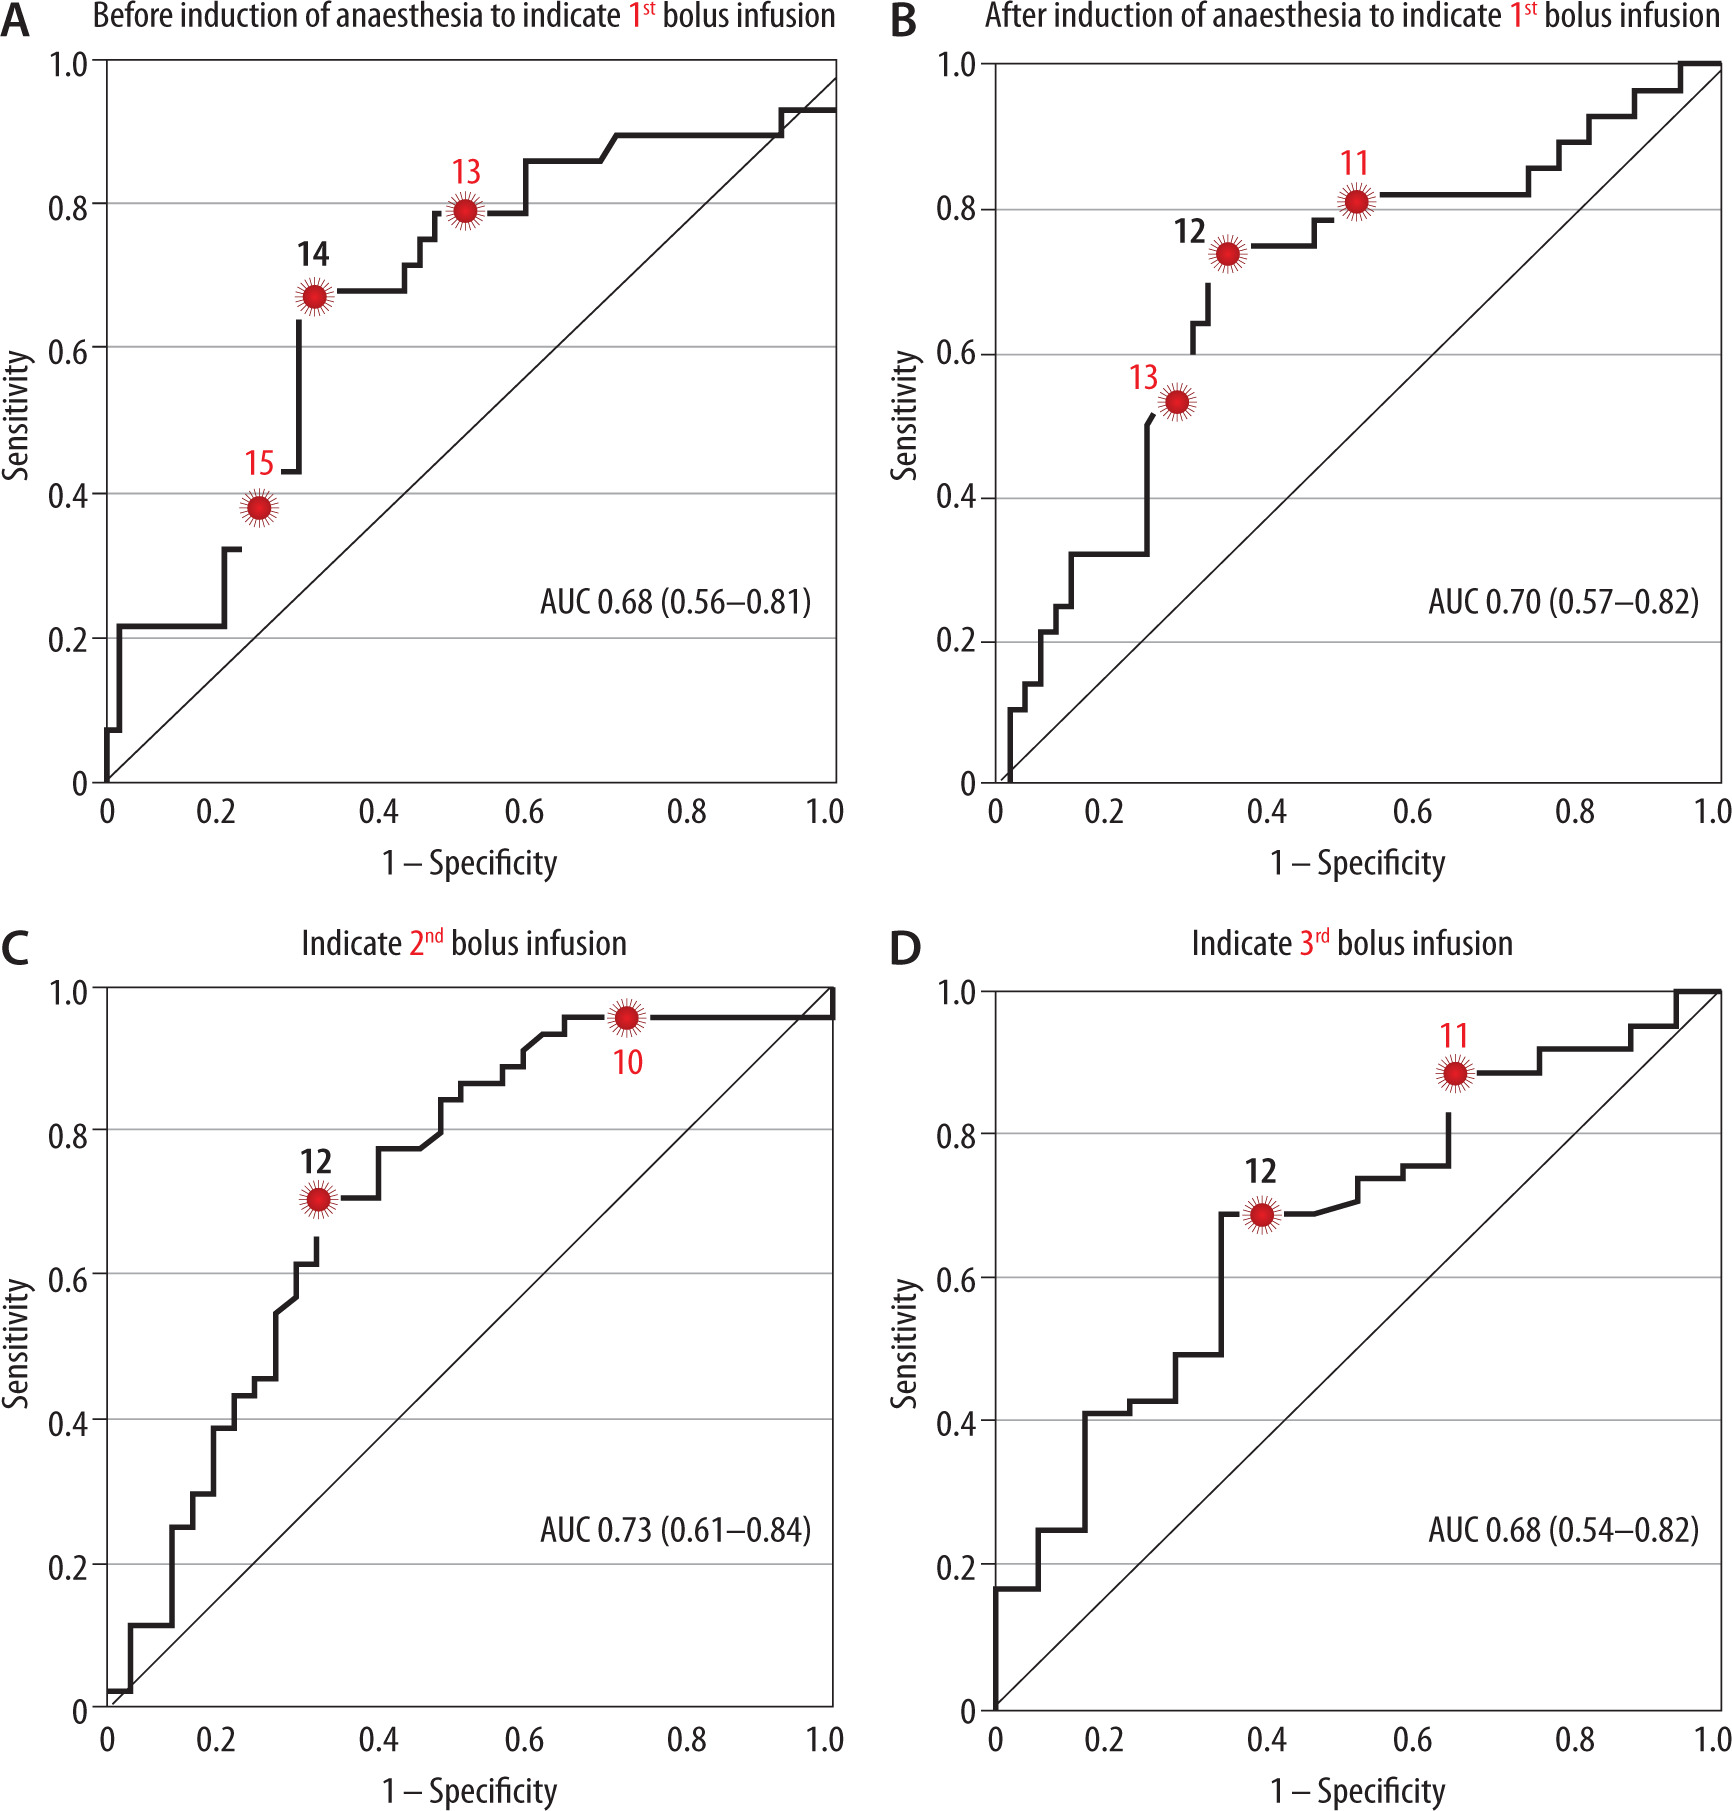
The cut-off point was 14 mmHg for Pmsa measured before anaesthesia (in the conscious state) to indicate fluid responsiveness at the end of the first bolus infusion that was given after anaesthesia induction and intubation (Figure 1A). The cut-off was 12 mmHg for the Pmsa obtained just before the 1st, 2nd, and 3rd bolus infusion to predict fluid responsiveness (Figures 1B–D).
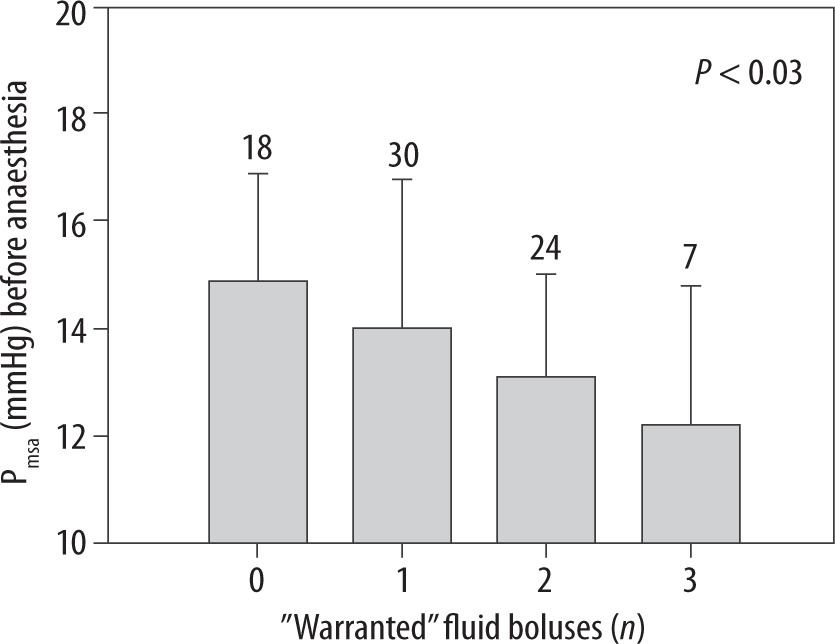
Pmsa measured before the induction of anaesthesia predicted how many of the bolus infusions would later become “warranted” (P < 0.03, Figure 2). Patients in whom none of the 3 bolus infusions was warranted most likely had a Pmsa of 14.9 ± 2.0 mmHg before anaesthesia was induced. By contrast, those in whom all 3 bolus infusions were warranted had a mean starting value of 12.2 ± 2.5 mmHg (P < 0.04).
FIGURE 2
The mean systemic filling analogue (Pmsa) measured prior to induction of general anaesthesia indicated how many of the 3 subsequent fluid boluses would be warranted (i.e. showed fluid responsiveness). Data are the mean, and the error bars are the standard deviation. Digits on top of each bar show the number of patients in each group. The P-value is the result of an ANOVA testing for differences in Pmsa with the number of warranted bolus infusions as a predictor
Fluid responders vs. non-responders
Pmsa differed significantly between subjects who proved to be non-responders and those who proved to be responders during the subsequent bolus infusion. This was a consistent finding throughout the study (Figure 3A).
FIGURE 3
Guyton’s haemodynamic parameters (A–D) and the stroke volume (E) depending on whether patients were nonresponders or responders before anaesthesia was induced and just prior to administration of the 3 subsequent fluid bolus infusions. Data are the mean, and the error bars represent the standard deviation. Statistical comparison was made by one-way ANOVA for each pair of data, and the resulting P-value is shown. The number of included patients changed for each comparison are shown on top of subplot A. The variable number invalidated paired testing
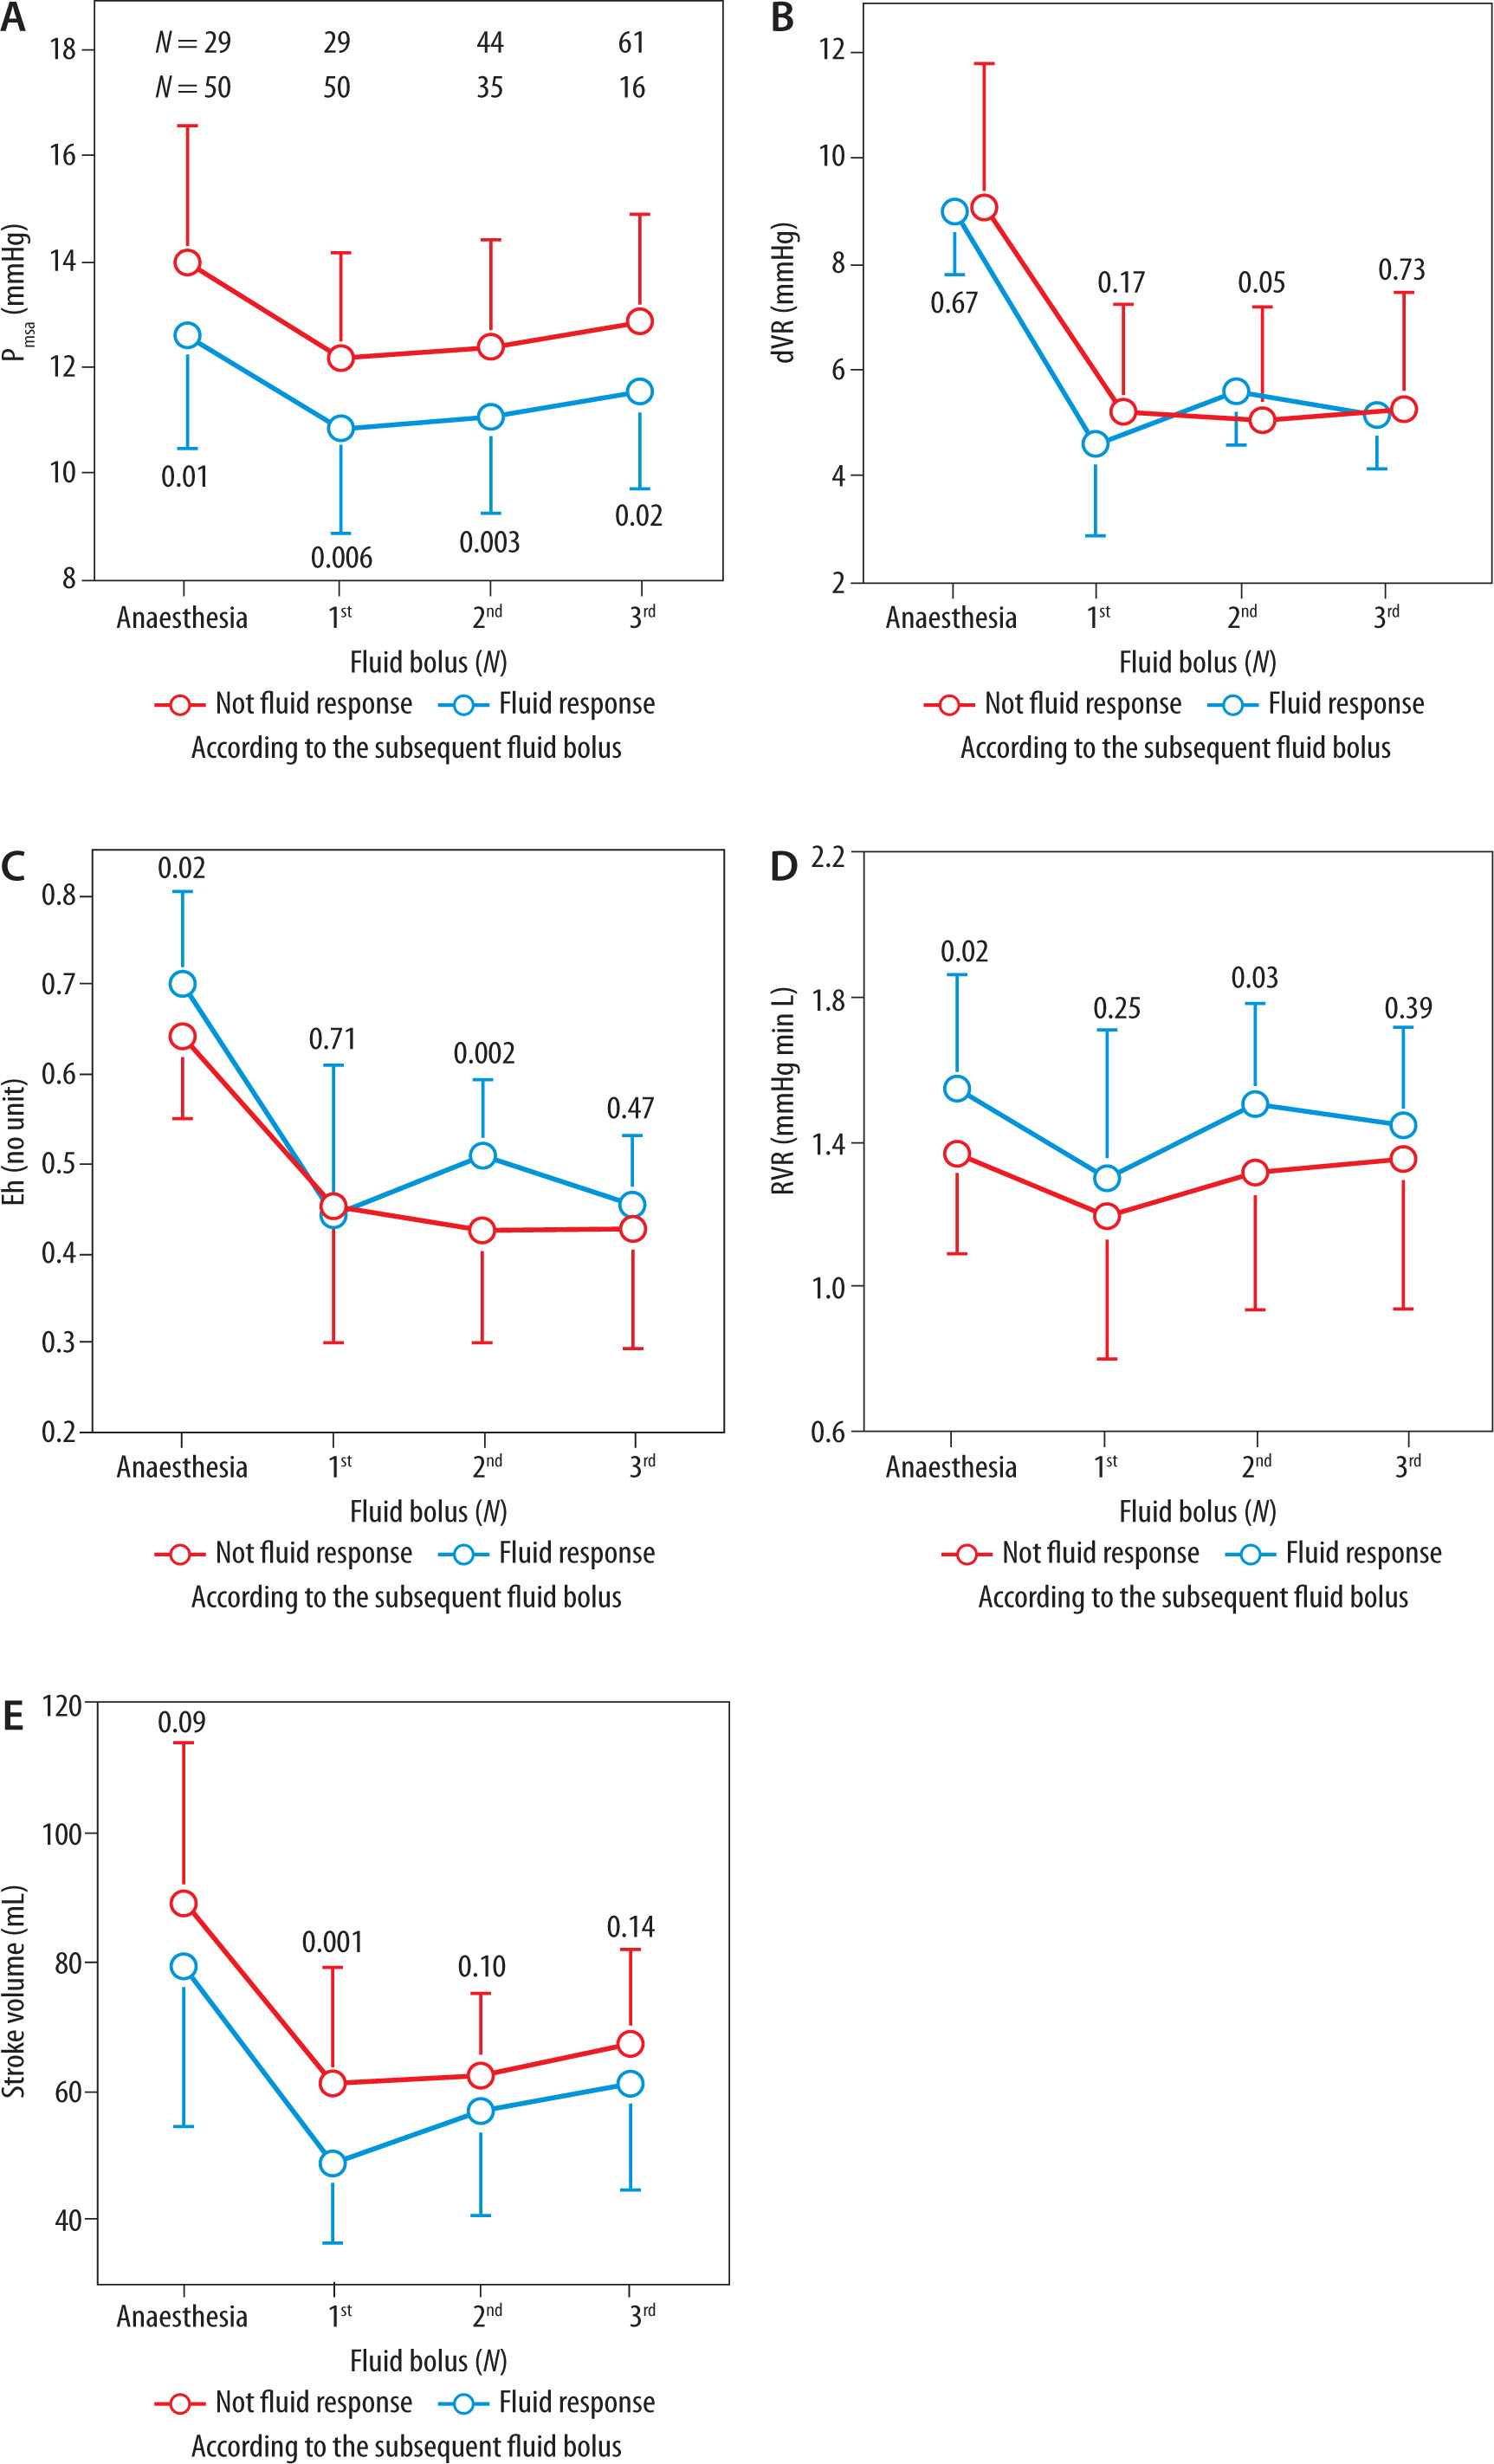
Induction of anaesthesia was followed by a marked decrease in both dVR and Eh, but further changes and differences between non-responders and responders were negligible (Figures 3B and C).
RVR tended to be higher in the responders, but the differences were minor (Figure 3D).
Stroke volume showed the same pattern as Pmsa, but the differences between responders and non-responders were smaller and not significant at all time points (Figure 3E).
To understand Figure 3, note that the patients were continuously redefined as non-responders and responders and that each patient could switch between these groups at different points in time.
Unstressed volume
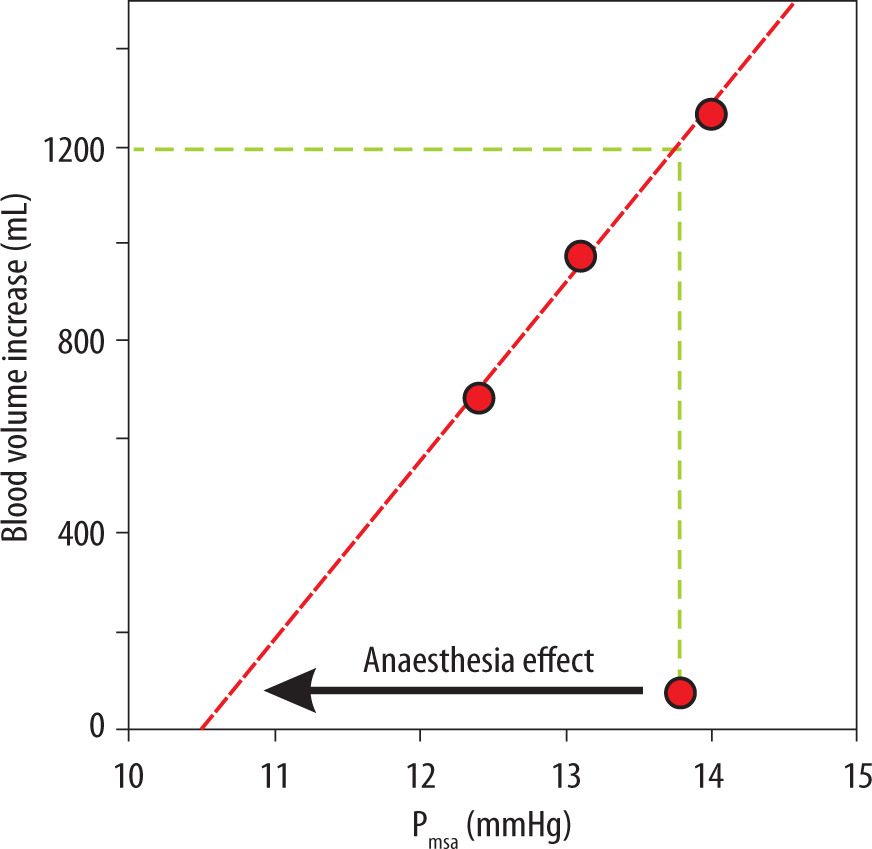
Figure 4 illustrates how the unstressed blood volume was increased by general anaesthesia. The onset of anaesthesia decreased Pmsa by 3.3 mmHg, which is indicated by an arrow. The blood volume at baseline amounted to 4.2 ± 0.8 L, and the plasma volume expansion resulting from the bolus infusions is plotted versus Pmsa to obtain a linear vascular compliance curve that represents the anaesthetized state. An increase in the unstressed blood volume occurred at the expense of the stressed volume during the induction of anaesthesia. This increase in unstressed blood volume is indicated by the vertical shift from the baseline Pmsa (13.8 mmHg, start of the arrow) to the vascular compliance curve. This distance corresponds to 1.2 L on the y-axis.
FIGURE 4
Increases in the unstressed blood volume by general anaesthesia. The plot shows the Pmsa for 3 successive bolus infusions versus the gradual increase in blood volume when general anaesthesia had been induced. The arrow indicates the reduction of the Pmsa from baseline, i.e. before induction of anaesthesia, to the vascular compliance curve, which represents the anaesthetized state. This vertical distance between the starting point of the arrow and the compliance curve indicates the anaesthesia-induced increase of the unstressed blood volume. Mean values for all patients were used
DISCUSSION
Key results
Pmsa predicted fluid responsiveness before a fluid bolus was infused during general anaesthesia. Pmsa also indicated the fluid responsiveness prior to anaesthesia induction and even how many fluid boluses would be needed until the SV no longer increased by ≥ 10%. However, the overall discriminating capacity of Pmsa to predict fluid responsiveness was not impressive; the ROC curves yielded confidence intervals that were statistically significant but only with modest margins.
We used the fluid-induced responses in Pmsa to estimate how much the anaesthesia-induced reduction in vascular compliance increased the unstressed blood volume, which is the fraction of the intravascular volume that does not generate pressure [3]. Figure 4 shows that 1.2 L of blood would be needed to restore Pmsa to its pre-anaesthesia level.
Guyton’s parameters
The research works by Arthur Guyton [2] from the 1950s link circulatory volume with pressure and flow. The central concept is the mean circulatory filling pressure (Pmcf), which is the pressure that develops in the vascular system if the blood flow is quickly stopped. A closely related variable is the Pms, which denotes the pressure when equilibrated throughout the systemic circulation. The Pms and Pmcf values are usually similar and are often used interchangeably.
The dVR is the difference between Pms and right atrial pressure, which is measured clinically as the CVP. Thus, a high CVP operates as a back pressure that reduces venous return, which governs CO. The flow gradient is stronger if Pms is high, which is expressed by the parameter denoted Eh, because the resistance to flow by the CVP then becomes less important. One may say that Eh is a measure of how effectively a volume change increases the CO.
Haemodynamic findings
The likelihood of fluid responsiveness was higher when Pmsa was low. This is logical because Pmsa reflects the “stressed” blood volume and the vascular compliance. The fluid-induced increases in Pmsa did not differ significantly between responders and non-responders, and this was also expected because the same fluid volume was given to all patients.
The dVR and Eh decreased by 30–40% after the induction of general anaesthesia, suggesting decreased inotropy, which was also reflected in a drop in stroke volume by 35%. By contrast, Pmsa only decreased by 25%, as shown in Figure 4. This difference can be explained by the increase in CVP, which is most likely due to the positive airway pressure that was initiated as soon as patients were anaesthetized. This suggests that 2/3 of the reduction of the SV could be accounted for by an anaesthesia-induced increase in vascular compliance. The resistance to venous return (RVR) is not expected to change during hyper- or hypovolaemia [8], and only small changes were found in the present study.
Unstressed blood volume
The unstressed blood volume is usually obtained from the intercept of the y-axis (volume) at zero pressure in a vascular compliance plot [3]. Figure 4 shows this type of plot, but it is based on just the changes within the narrow interval of the present measurements. Here, the horizontal shift between the baseline Pmsa and the compliance curve indicated the anaesthesia-induced decrease of Pmsa (the arrow). The increase in the unstressed blood volume due to general anaesthesia is given by the blood volume corresponding vertical distance between the baseline Pmsa (where the arrow begins) and the regression line. This is the volume that the anaesthetist aims to compensate for using intravenous fluid and/or combat with a vasopressor.
The particularly pronounced blood volume response to the first bolus infusion is probably because some capillary refill always occurs in response to the decrease in arterial pressure accompanying anaesthesia induction, even in the absence of intravenous fluid administration [17]. The blood Hb level will ultimately decrease in this process. Capillary refill is also the reason why the first post-induction Pmsa could not be used in Figure 4, because the blood volume change was not zero, and no matching haemoglobin value was taken (hence, no value on the y-axis was available for the plot).
Overall, the bolus infusions expanded the blood volume by more than the infused amount. This is reasonable because the colloid osmotic pressure of the fluid is 33% higher than normal blood plasma [18]. However, the intravenous retention of the infused fluid, being higher for colloids than for crystalloids, is unlikely to matter much for the present calculations.
Crystalloid fluid might even offer an alternative way to estimate the anaesthesia-induced increase of the unstressed volume. Kinetic analysis of haemodilution curves in women scheduled for abdominal hysterectomy showed that capillary leakage of fluid was arrested when 1.24 L (16.6 mL kg–1) of Ringer’s solution had been infused, which is similar to the value found here [19]. This finding suggests that a low Pmsa counteracts the capillary leakage of fluid when the blood volume is expanded by crystalloid fluid.
The marked increase in unstressed blood volume in this setting is relevant to our understanding of the haemodynamic response to general anaesthesia. It might explain the difficulty of preventing arterial hypotension by intravenous fluid alone [20].
Literature
The central idea of Guyton’s haemodynamics is that CO is determined by the venous return, whereas the heart plays a permissive role [3]. Despite critical views, this concept has received widespread attention among physiologists, anaesthetists, and intensivists [21].
Basic studies have been performed in pigs, where Pms has been derived by ventilatory manoeuvres [22, 23] and, recently, with extracorporeal membrane oxygenation [10].
Attempts to use Pms in the clinic have been made over the past decade. Three methods are used. One is to calculate Pms when VR is suppressed by deep stepwise inspirations. The second is to arrest the circulatory flow in one arm by inflating a blood pressure cuff and then obtain Pms when the arterial and venous pressures have become equal. The third method is to calculate the Pms analogue, called Pmsa, which was the approach used in the present work.
Comparisons between these methods in cardiac surgery have shown, in one study, an acceptable agreement between Pms values but good agreement between changes in effective blood volume [7]. Meijs et al. [9] compared inspiratory holds with Pmsa in cardiac surgery and found the methods to be interchangeable.
Cecconi et al. [6] measured Guyton’s haemo-dyna-mic parameters in 39 postoperative patients who received different vasoactive therapies and respiratory support. The Pmsa showed great variability and did not increase in response to a fluid bolus consisting of either crystalloid or colloid fluids.
A review by Cooke et al. [11] supports our finding that Pmsa is lower in fluid responders than in non-responders. Fluid challenges and passive leg raising increased Pmsa more in the responders, and by a greater incremental change than we found. These differences may be due to the anaesthetized state of our patients.
Limitations
The strengths of the study include the uniform anaesthetization of the patients and their freedom from acute disease. All patients also received the same fluid treatment. Sampling was carefully timed by a single set of investigators. No adrenergic drugs were used, as they may affect vascular tone and Pmsa [24]. Such drugs were still allowed as rescue treatment for arterial hypotension but were not considered necessary by the attending anaesthetists.
Non-responders to a bolus infusion may, in some cases, not be normovolaemic but have a limited cardiac capacity to increase stroke volume. This is a confounder in any comparison between Pmsa and fluid responsiveness, but it would probably have been a greater issue if the patients had been older.
CO was measured by the arterial waveform pulse contour analysis implemented in the FloTrac/Vigileo haemodynamic monitoring system, which requires a proprietary transducer (FloTrac) connected to a standard arterial catheter. The system can be used in conscious patients. It is uncalibrated and predicts vascular impedance based on demographic data. When compared with the pulmonary artery catheter, FloTrac/Vigileo showed a very small bias for cardiac index between 2 and 4 L min–1 per m2, while lower values could be overestimated and higher values underestimated by approximately 1 L. The concordance rate was 84% [25].
The data were collected in the clinical setting, and the occasionally high SV at baseline may be due to preoperative stress.
The fluid used for the bolus infusions, Voluven, is questioned in Europe due to the risk of kidney injury in septic patients. However, most studies of fluid responsiveness have used Voluven to challenge the SV response, and therefore Voluven appeared to be the most conservative choice of fluid. Recent studies do not support that the use of Voluven during routine surgery is associated with kidney injury [26, 27].
The present work is a retrospective analysis of a clinical trial for which other details have been published and studied previously. The original purpose of the study was not to calculate Pmsa. The original patient series included 25 patients who received volume loading with Ringer’s solution, in addition to the 86 who received colloid. Those who received Ringer’s solution were not included because 3 mL kg–1 of crystalloid could not adequately challenge fluid responsiveness [12]. Only 20% of these patients showed fluid responsiveness during the first bolus infusion, which is 1/3 of the fraction of patients who received the colloid bolus.
CONCLUSIONS
A mean systemic filling pressure analogue (Pmsa) indicated fluid responsiveness in patients who were given general anaesthesia followed by 3 successive bolus infusions of colloid fluid. If measured before anaesthesia was induced, Pmsa could indicate how many bolus infusions would later prove to be warranted. A comparison between the changes in Pmsa and the estimated blood volume changes suggested that general anaesthesia increased the unstressed blood volume by as much as 1.2 L.