
Introduction
Steatotic liver disease (SLD) is the most common liver disease globally, with a great economic burden [1]. In the past four decades, intensive research has been carried out to clarify its clinical and histological entities. Nonalcoholic fatty liver disease (NAFLD), first described in 1980, refers to hepatic steatosis in the absence of other etiologies, such as alcohol intake [2]. It has been reported that NAFLD was strongly linked to metabolic syndrome, including overweight or obesity, type 2 diabetes mellitus, dyslipidemia and hypertension [3-7]. In 2020, the nomenclature of metabolic (dysfunction) associated fatty liver disease (MAFLD) was proposed to replace NAFLD [8]. Rather than exclusion, the diagnostic criteria of MAFLD include hepatic steatosis and metabolic dysfunction, which is defined as having one of the following three criteria: overweight/obesity, presence of type 2 diabetes mellitus, or evidence of metabolic dysregulation [8]. However, the use of the new nomenclature of MAFLD remains under debate and not completely accepted by all societies. After a multi-society Delphi consensus, SLD was proposed to be an affirmative name and diagnosis for avoiding the stigmatizing effect of “fat” [9]. Metabolic dysfunction-associated steatotic liver disease (MASLD) was chosen to replace NAFLD [9]. The major differences of MASLD from MAFLD are the diagnostic criteria of metabolic dysfunction, defined as meeting one of five cardiometabolic risk factors, and the removal of homeostasis model assessment-insulin resistance index (HOMA-IR) and high-sensitivity C reactive protein (hs-CRP) [9]. SLD patients without any cardiometabolic risk factors or other etiologies of liver diseases are diagnosed with cryptogenic SLD [9]. Currently, some studies have confirmed that the diagnostic criteria of MAFLD could identify patients at higher risk of metabolic, liver, and cardiovascular complications [10-12]. As for the newly proposed diagnostic criteria of MASLD, whether they better meet clinical needs than the previous criteria of MAFLD requires clinical research for confirmation. The comparison between these two sets of diagnostic criteria will serve as the foundation for the global standardization of disease names and diagnostic criteria in the future. In this study, we used the large, population-based cohort of the Taiwan Bio-bank to investigate whether there is any difference in clinical presentations between MAFLD and MASLD patients identified in the same cohort according to the proposed diagnostic criteria.
Material and methods
The Taiwan Bio-bank is a population-based research database that was in operation from 2008 and was active until July 31st, 2023. It collected data from a total of 202,219 participants and is no longer accepting new participants. Data collection followed standard practices, as previously reported in earlier studies [10, 13, 14]. After providing consent, participants underwent comprehensive questionnaires, blood tests, and urine tests at the time of enrollment. The questionnaire covered basic information, medical history, smoking and drinking habits, dietary patterns, as well as details about work and physical activity. Regarding drinking history, participants were assigned to three groups: non-/social drinkers, those who had given up drinking, and “frequent drinkers”, defined as those who had been continuously drinking for more than 3 months. Additionally, the type, quantity, and frequency of alcohol consumption were recorded. Continuous follow-up was recommended for all participants, with tracking intervals ranging from two to four years. During the first follow-up, in addition to questionnaires and blood tests, abdominal ultrasound and carotid duplex ultrasound were also conducted. Access to the database can be obtained through a formal application process, subject to review and approval, allowing access to linked data.
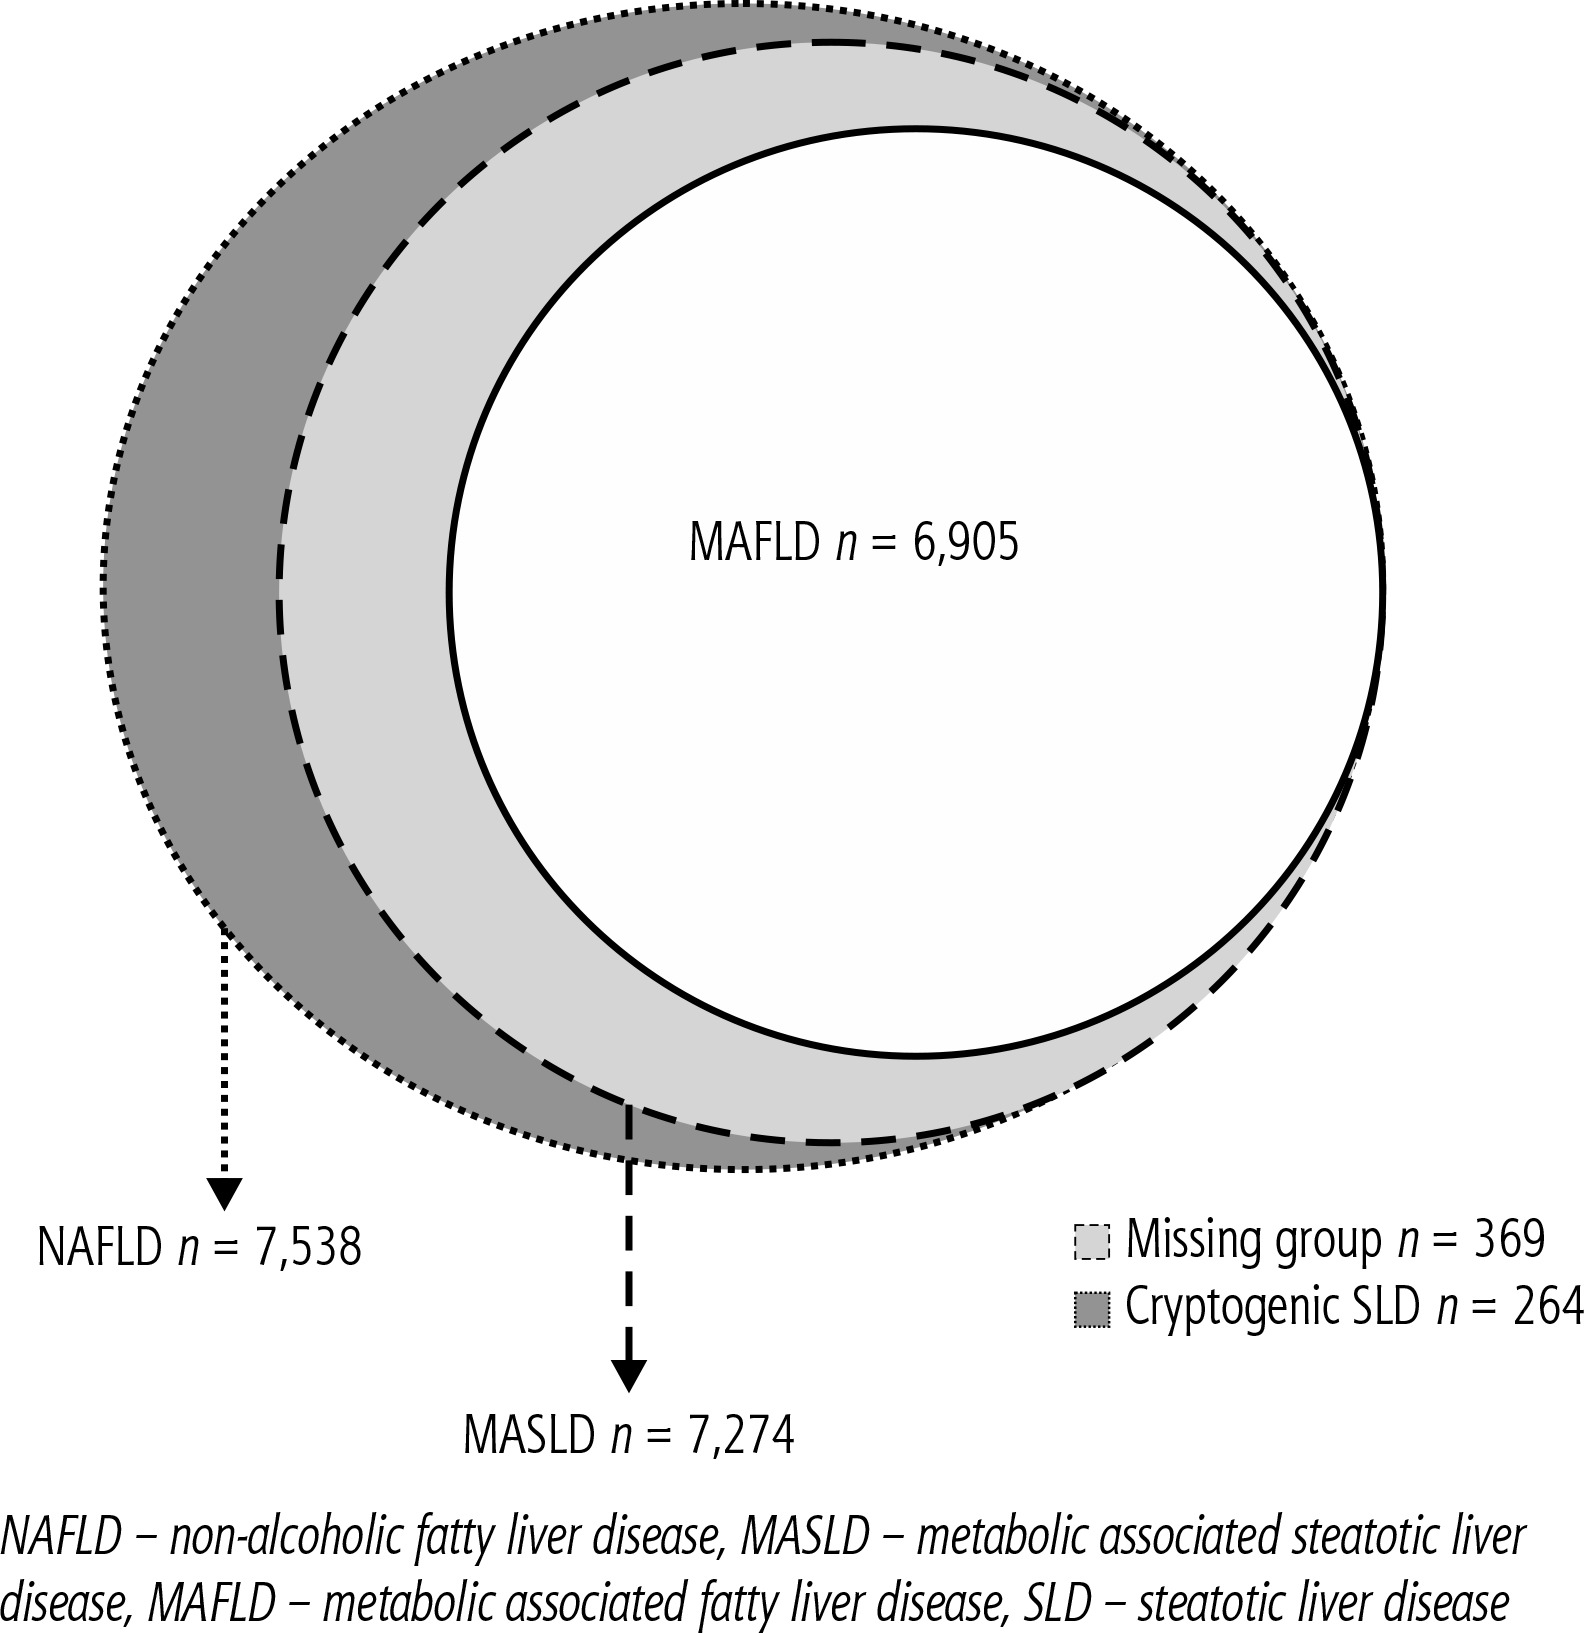
The current study obtained approval in 2021. It included participants who had undergone at least the first follow-up assessment with the data of liver ultrasonography. Exclusion criteria included participants with incomplete data, positive HBsAg, positive anti-HCV, and individuals who were identified as “frequent drinkers”. The primary objective of this study was to compare the risk of liver diseases and atherosclerosis between MAFLD and MASLD. Excluding participants with chronic hepatitis B virus, hepatitis C virus infection and “frequent drinkers” is aimed at avoiding the confounding effects of these factors on clinical outcomes. Since whether moderate alcohol consumption provides protection or increases the risk of advanced liver fibrosis is still inconclusive in NAFLD patients, a strict definition was applied for alcohol consumption, excluding all patients who had been drinking alcohol continuously for more than three months, even if they did not meet the definition of increased alcohol intake (weekly alcohol intake exceeding 210 grams in men and 140 grams in women) [15, 16]. This rigorous approach was taken to enhance the accuracy of the study results. The diagnosis of SLD was made based on liver ultrasound results. Given the exclusion of other liver diseases, it could also be diagnosed as NAFLD. For MASLD, the diagnostic criteria of metabolic dysfunction involve meeting any one of the cardio-metabolic criteria. On the other hand, for MAFLD, meeting any one of three criteria is required: being overweight/obese, having type 2 diabetes mellitus, or, if neither of the first two criteria is met, meeting at least two out of seven metabolic abnormalities. Subsequently, based on the two diagnostic criteria, patients were categorized into those meeting the criteria for MASLD or MAFLD. It is important to note that there is substantial overlap between these two groups (Fig. 1). SLD patients not meeting any of the cardio-metabolic criteria were equal to “cryptogenic SLD” patients. Meanwhile, those who met the criteria for the MASLD but not MAFLD were assigned as the “missing” group. The fatty liver index (FLI) was used to predict the grade of hepatic steatosis [17]. We used the NAFLD fibrosis score (NFS) to assess the severity of liver fibrosis and the presence of carotid plaques on carotid duplex examination to diagnose atherosclerosis [18, 19]. The lipid profiles included triglyceride, cholesterol, low-density lipoprotein (LDL), and high-density lipoprotein (HDL). The liver inflammatory markers included aspartate transaminase (AST), alanine transaminase (ALT), and γ-glutamyl transferase (GGT). We then compared the clinical presentations of patients between the MASLD and MAFLD groups to determine whether there were any differences. Additionally, we compared the cryptogenic SLD patients (considered as the control group due to the absence of metabolic dysfunction) with the “missing” group to assess differences in clinical presentations.
Ethical considerations
This study was performed in accordance with the principles of the 1975 Declaration of Helsinki and approved with waived informed consent by the Research Ethics Committee of Taipei Tzu Chi Hospital; Buddhist Tzu Chi Medical Foundation (approval numbers: 10-XD-055 and 11-X-074) and the Ethics and Governance Council of the TWB (approval number: TWBR11102-03).
Statistical analyses
The data were expressed as mean ± standard deviation for continuous variables and number (percentage) for categorical variables. Statistical analysis was performed using SPSS version 26.0 (IBM Corp.). The clinical characteristics and outcomes were compared between MASLD and MAFLD patients; and between cryptogenic SLD and “missing” groups. The clinical outcome of diabetes and overweight in MASLD patients was also compared and propensity score matching (PSM) was performed if age and/or sex was unmatched. These data were analyzed by the chi-square test and Student’s t test. A p value less than 0.05 was considered statistically significant.
Results
This study collected a total of 22,909 participants from the Taiwan Bio-bank database. We initially excluded 5,314 participants including those with missing data, positive HBsAg, positive anti-HCV, and frequent drinkers, defined as having persistent alcohol consumption more than 3 months. Among 17,595 participants, 7,538 patients with fatty liver on ultrasonography, diagnosed with NAFLD, were included in the final analysis. Among them, idiopathic SLD was diagnosed in 264 participants not meeting any of the cardio-metabolic criteria. A total of 7,274 (41.3%) and 6,905 (39.2%) participants met the criteria for MASLD and MAFLD, respectively. Additionally, 369 patients met the diagnostic criteria for MASLD but not for MAFLD due to stricter criteria for metabolic dysfunction. The group was defined as the “missing” group (Table 1, Fig. 1).
Table 1
Comparison of clinical characteristics and outcomes between MASLD and MAFLD
[i] MASLD – metabolic dysfunction-associated steatotic liver disease, MAFLD – metabolic associated fatty liver disease, BMI – body mass index, WC – waist circumference, HbA1c – glycated hemoglobin, TG – triglyceride, CHO – cholesterol, HDL – high-density lipoprotein, LDL – low-density lipoprotein, AST – aspartate aminotransferase, ALT – alanine aminotransferase, ULN – upper limit of normal, GGT – γ-glutamyl transferase, APRI – aspartate aminotransferase to platelet ratio index, NFS – NAFLD fibrosis score, eGFR – estimated glomerular filtration rate
Comparison of clinical characteristics and outcomes between those with MASLD and MAFLD
These two groups of patients had a 94.9% overlap. Compared to those with MAFLD, MASLD patients had lower body mass index (BMI), body fat percentage, FLI, and waist circumference. They had higher HDL levels. There were no differences in age, gender, metabolic disorders, glucose, lipid profiles, liver function tests, and the percentage of carotid plaque between these two groups.
Comparison of clinical characteristics and outcomes between the “missing” group and the cryptogenic SLD group
Compared to the cryptogenic SLD group, the “mis-sing” group was older. They had higher values of BMI, waist circumference, hypertension history, hyperlipidemia history, glucose, glycated hemoglobin (HbA1c), triglycerides, LDL, and uric acid levels. Additionally, FLI, NFS, and the percentage of carotid plaque were higher in the “missing” group. There were no differences between the two groups in terms of gender distribution, diabetes prevalence, cholesterol, liver function indices and kidney function indices (Table 2).
Table 2
Comparison of clinical characteristics and outcomes between cryptogenic SLD and “missing” groups
[i] SLD – steatotic liver disease, BMI – body mass index, WC – waist circumference, HbA1c – glycated hemoglobin, TG – triglyceride, CHO – cholesterol, HDL – high-density lipoprotein, LDL – low-density lipoprotein, AST – aspartate aminotransferase, ALT – alanine aminotransferase, ULN – upper limit of normal, GGT – γ-glutamyl transferase, APRI – aspartate aminotransferase to platelet ratio index, NFS – NAFLD fibrosis score, eGFR – estimated glomerular filtration rate
Comparison of clinical outcomes between the “diabetes or overweight” group and “without diabetes and overweight” group in MASLD patients before and after PSM for age and sex
As we know, MASLD is associated with obesity and diabetes mellitus. Therefore, we conducted a subgroup analysis based on the presence of diabetes or overweight in this population. If we divided the study population into two groups, one with “diabetes or overweight”, and the other “without diabetes and overweight”, and compared the two groups, we found that the group with “diabetes or overweight” had a significantly higher percentage of male and significantly higher values of BMI, WC AST, ALT, GGT, total bilirubin, FLI, and NFS but was younger than the “without diabetes and overweight” group. Using PSM for age and sex, the “diabetes or overweight” group had higher values of BMI, WC, AST, ALT, GGT, FLI, and NFS. As regards atherosclerosis, there was no significant difference between the two groups before and after PSM (Table 3).
Table 3
Comparison of clinical outcomes between “diabetes and/or overweight” group and “without diabetes and overweight” group in MASLD patients before and after propensity score matching for age and sex
Comparison of clinical outcomes between “diabetes alone” and “overweight alone” groups in MASLD patients before and after PSM for age and sex
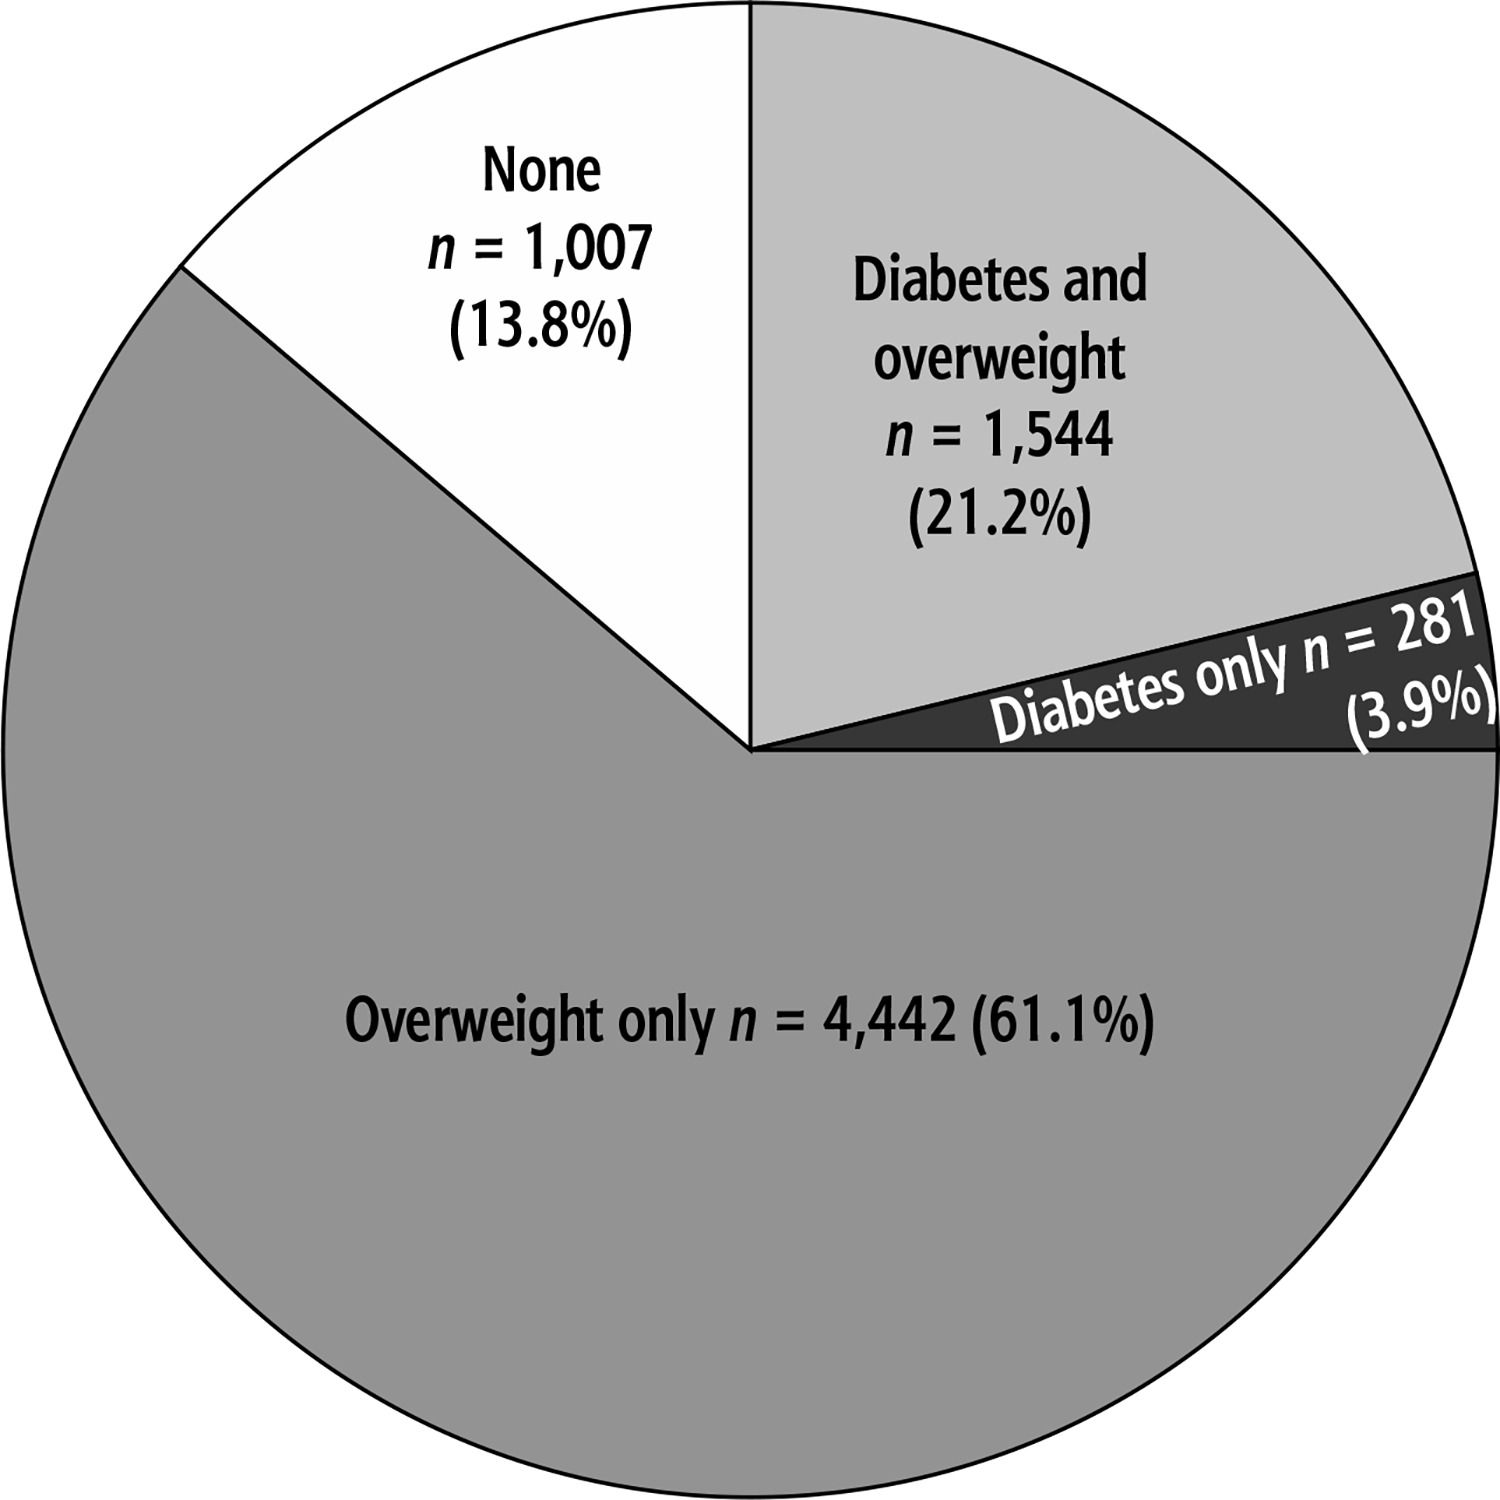
The study population was divided into four groups: “combined overweight and diabetes”, “diabetes alone”, “overweight alone”, and “without diabetes and overweight”. We found that the “combined overweight and diabetes” group represented 21.2%, “diabetes alone” patients represented 3.9%, “overweight alone” patients represented 61.1%, and patients “without diabetes and overweight” represented 13.8% (Fig. 2). When comparing the “diabetes alone” group to the “overweight alone” group, we observed a higher NFS and higher percentages of carotid plaques, female participants and older age but lower FLI in the “diabetes alone” group. After PSM for age and sex, the “diabetes alone” group consistently had a higher level of NFS and higher percentage of carotid plaques but lower FLI. Regarding liver inflammation, there was no significant difference between the two groups (Table 4).
Table 4
Comparison of clinical outcomes between “diabetes alone” group and “overweight alone” group in MASLD patients before and after propensity score matching for age and sex
Discussion
In this population-based study, we found that when comparing patients with MASLD with MAFLD, there were no differences in terms of metabolic factors, liver fibrosis, and carotid plaque proportions. However, due to a 94.9% overlap in recruited participants between the two groups, the distinction can be difficulty to identify. When we compared the “missing” group with the cryptogenic SLD group, we found that the “missing” group clearly had a higher risk of liver fibrosis and atherosclerosis compared to the control group. This study suggests that patients in the “missing” group should not be excluded, and it is advisable to use the name and diagnostic criteria of MASLD.
When the name of the disease is changed from NAFLD to MASLD, to be accurate, patients without metabolic dysfunction should be excluded. The condition of this particular group is named cryptogenic SLD, which was proposed in 2023 and defined as having no known causes and no cardio-metabolic risk factors, and we can use these patients as the control group. When the diagnostic criteria are changed from MASLD to MAFLD, patients with diabetes or overweight/obesity are not affected. The excluded group mainly consists of non-diabetic lean/normal weight patients, but having only one cardio-metabolic risk factor. Those aligning with the diagnosis criteria of MASLD but not for MAFLD are referred to as the “missing” group. This study compared the “missing” group with the control group. We found that the “missing” group still had a higher proportion of metabolic factors and diseases. Additionally, the proportions of carotid plaques and liver fibrosis marker were also higher. This indicates that the “missing” group has a higher risk of liver fibrosis and atherosclerosis. They should not be excluded from MASLD if using the diagnostic criteria of MAFLD and should be monitored in clinical practice.
MASLD is correlated with diabetes and obesity. To understand the impact of these two factors on MASLD, we conducted a subgroup analysis. We found that the “without diabetes and overweight” group represented only 13.8% of MASLD patients. Compared to the “diabetes or overweight” group, this group of patients had a lower risk of liver diseases. However, there was no significant difference in the risk of atherosclerosis between the two groups. When comparing the “diabetes alone” group to the “overweight alone” group, the “diabetes alone” group had higher risk of liver fibrosis and atherosclerosis.
This reveals that the adoption of the latest term, MASLD, is more appropriate. Several primary reasons support this conclusion. Firstly, it avoids a stigmatizing tone [9]. Secondly, the definition of metabolic dysfunction is simpler under the new terminology, as it only requires meeting any one of the five cardio-metabolic criteria, which are similar to the criteria of metabolic syndrome. In addition, insulin resistance and hs-CRP, not routinely tested clinically, are not included in the diagnostic criteria [20]. Thirdly, it aligns better with the nomenclature, as individuals can only be excluded if there are absolutely no factors indicating metabolic abnormalities. Fourthly, there is a higher overlap (7,274/7,538; 96.5%) between patients diagnosed with the new name MASLD and those previously diagnosed with NAFLD, indicating that research results from the previous NAFLD studies may remain applicable under the new definition for MASLD. Lastly, the study confirms that the “missing” group has higher risk than the cryptogenic SLD group, suggesting that any patient with factors indicating metabolic abnormalities should not be excluded to avoid missing high-risk patients clinically.
To replace the previous name of NAFLD, there have been two successive proposals of two different names and diagnostic criteria: MASLD and MAFLD. Whether the latest proposed diagnostic criteria are more appropriate and superior to the earlier ones needs to be confirmed through research in the current era of evidence-based medicine. To the best of our knowledge, this study appears to be the first to present research results on this matter. Having a globally consistent name and diagnostic criteria for a disease can greatly assist future research and communication [21].
This research has several strengths. Firstly, it appears to be the first study to compare the diagnostic criteria of MASLD and MAFLD. It also confirms that there are indeed differences between their diagnostic criteria. Secondly, this large-scale population study with available reports of carotid duplex ultrasound can assess the risk of atherosclerosis. Thirdly, the results of this study are highly beneficial for the global standardization of disease names and diagnostic criteria for MASLD in the future. However, there are some limitations to be noted. Firstly, the severity of liver fibrosis was based on the values of NFS rather than histological findings. Since conducting liver biopsies has its risks and is not suitable for large-scale research, NFS as a validated method can be used to predict the severity of liver fibrosis in a population-based study [22]. Secondly, the diagnosis of hepatic steatosis was primarily based on liver ultrasound, which may not be sensitive to patients with mild steatosis under histological examination [23]. Since ultrasonography is a widely used tool to diagnose fatty liver, the study results can be easily translated to clinical practice. Thirdly, the data in this study did not include HOMA-IR and hs-CRP levels, these two tests not being routinely conducted in clinical practice, which may lead to underestimation in the diagnosis of MAFLD.
In conclusion, this population-based study shows that there is significant overlap between patients with MASLD and those with MAFLD. Among the patients who meet the diagnostic criteria for MASLD but not for MAFLD, this “missing” group represents approximately 5.1%. When compared to the cryptogenic SLD group, they indeed exhibit a higher proportion of metabolic abnormalities, liver fibrosis, and atherosclerosis. The results suggest that the “missing” group should not be excluded from NAFLD, and it is recommended to adopt the diagnostic name and criteria of MASLD for replacing NAFLD. These findings are valuable for the future global standardization of the disease name and diagnostic criteria.


