
Introduction
Cushing disease (CD) is a rare disorder caused by an increased secretion of adrenocorticotropic hormone (ACTH) by/in a pituitary neuroendocrine corticotroph tumors (PitNETs) – TPIT lineage [1]. In the pediatric population, the prevalence of endogenous Cushing’s syndrome (CS) is estimated to be 1 to 1.5 per million children per year [2]. CD is the most common cause of CS in children over 5 years of age [3]. Among common symptoms of CD in children, e.g., weight gain, growth deceleration, a change in facial appearance, hypertension, metabolic consequences such as diabetes, and lipid disturbances can also occur [4]. These, when untreated, are the risk factors for higher morbidity and mortality [5]. The first-line treatment for CD is transsphenoidal pituitary surgery (TSS) [6]. The second pituitary surgery or radiotherapy (RT) are considered in the case of relapse. Pharmacotherapy is helpful to control hypercortisolemia during preparation for surgery or in case of refusal of surgical treatment as well as whilst awaiting the radiotherapy effects [7].
The aim of the study
There is still little known about the influence of disease remission on metabolic parameters in children. To fill the knowledge gap, we present our study’s results, which assessed the impact of remission of CD on metabolic status in pediatric patients with CD. Additionally, we compared the metabolic parameters in the patients with CD to age-matched and body mass index (BMI)-matched control groups.
Material and methods
Patients
This retrospective study analyzed 32 patients (17 girls and 15 boys) diagnosed with CD remaining under specialist care of the Department of Endocrinology and Diabetology of the Children’s Memorial Health Institute between 1993–2020.
The diagnosis of CD was based on the results of 24-hour urinary free cortisol (UFC) level, circadian cortisol rhythm, plasma ACTH level, low-dose dexamethasone suppression test (LDDST), high-dose dexamethasone test (HDDST), the corticotropin-releasing hormone (CRH) stimulation test (Table I), pituitary magnetic resonance imaging (MRI). In addition, bilateral inferior petrosal sinus sampling (BIPSS) was performed in selected cases. All patients underwent TSS of PitNET.
Table I
Clinical and biochemical characteristics at the moment of diagnosis of Cushing disease.
* One patient with result within normal range, in 5 patients missing data IQR – interquartile range; OGTT – oral glucose tolerance test; ACTH – adrenocorticotropic hormone; UFC – urinary free cortisol; CRH – corticotropin-releasing hormone; LDDST – low-dose dexamethasone suppression test; HDDST – high-dose dexamethasone suppression test; IQR – interquartile range; N – normal range
Postsurgical remission was defined as midnight serum cortisol within normal range, normal 24-h urine-free cortisol, and LDDST or continued need for hydrocortisone (HC), assessed periodically [8]. Low-dose HC were routinely given to patients with immediate surgical remission and gradually ceased to reduce the adverse effects of temporary hypopituitarism. Long-term HC replacement therapy was required for patients with central adrenal insufficiency (CAI).
The persistent disease was determined as hypercortisolism after TSS, absence of a diurnal rhythm, and increased nocturnal serum cortisol value > 4.4 µg/dl [6].
Cortisol was measured with the radioimmunoassay method until 1989 and then, with the chemiluminescent immunoassay method on the Alinity Abbott analytical system, with morning reference ranges of 4–25 µg/dl.
Until May 2021, ACTH was measured with the radioimmunoassay method, then with the chemiluminescent immunoassay method on the Cobas e411/Roche analytical system.
The 24-hour UFC excretion was measured by the gas chromatography-mass spectrometry (GC-MS) method, with the reference range varying by age.
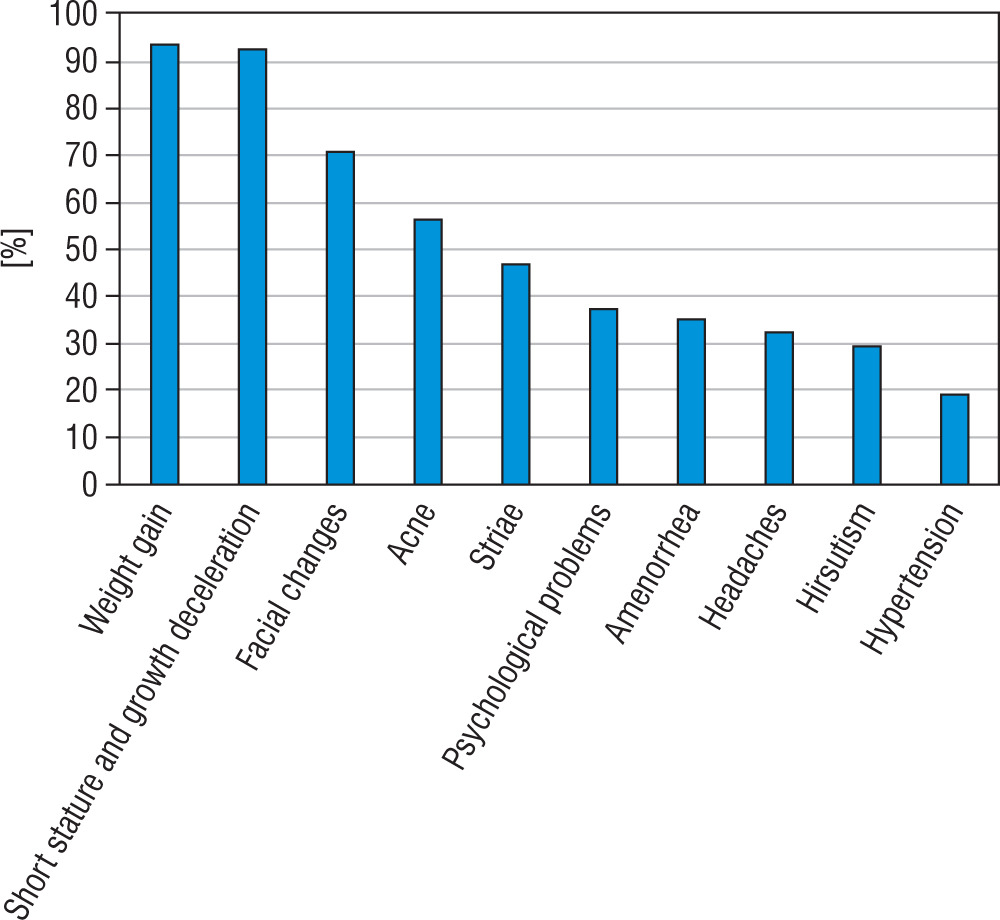
The prevalence of symptoms at the diagnosis of CD and biochemical evaluation are presented in Figure 1 and Table I.
Clinical and biochemical evaluation
We evaluated:
Anthropometric data in patients with CD: weight, weight standard deviation (SD), height, height SD, BMI, BMI SD in 2 time points: at the moment of TSS (32 patients) and at the average time 15.8 months (range 3.5–42.9) after TSS in 25 patients with disease remission (lacking data in 7 patients).
The obtained anthropometric parameters were presented as standard deviations (SD) for body height and BMI using the LMS method [9]. Z-score values were calculated from the formula:
X – measured anthropometric parameter, M – a median of the value, L – Box-Cox values for power, S – coefficient of variation.
The L, M, and S values referred to the average values of the population of healthy Polish children [10,11].
Laboratory parameters:
total cholesterol (TC); high-density lipoprotein cholesterol (HDL-c); low-density lipoprotein cholesterol (LDL-c), triglyceride (TG) levels – in 29 patients with CD at baseline and in 23 patients after TSS,
results of OGTT – in 31 patients with CD at baseline and in 16 patients after TSS. In the case of patients who did not have OGTT performed, we used fasting glucose and insulin levels to calculate the results in time point 0’.
All patients were in remission during the control. At follow-up, 16 patients (50%) were treated with HC (at a mean dose of 10.2 mg/m2/day), 16.7% received HC only under severe stress, and 33.3% were without glucocorticoid therapy. In addition, 14 patients were diagnosed with central hypothyroidism and had been receiving levothyroxine. All patients’ free thyroxine (fT4) and free triiodothyronine (fT3) levels were within the normal range at follow-up. OGTT was performed after the administration of HC and before levothyroxine.
Additionally, we compared the results with age-matched and BMI-matched control groups (patients with overweight or simple obesity).
OGTT was performed with a 1.75 g/kg (maximum dose 75 g) oral glucose load. Glucose and insulin blood concentrations were measured at 0, 30, 60, 90, and 120 minutes of the OGTT. Impaired fasting glucose (IFG) was defined as a glucose fasting level: 100–125 mg/dl (5.6–6.9 mmol/l). Impaired glucose tolerance (IGT) was diagnosed when 2-hour postload plasma glucose was 140–199 mg/dl (7.8 to < 11.1 mmol/l) and diabetes when fasting glucose was ≥ 126 mg/dl (≥ 7.0 mmol/l) and was confirmed by repeat testing or when 2-hour postload plasma glucose was ≥ 200 mg/dl (≥ 11.1 mmol/l). The diagnosis was made according to the Polish Diabetes Association guidelines [12].
Until March 2020, insulin concentration was measured with the immunoradiometric assay method, then from April 2020 by the chemiluminescent microparticle immunoassay method. Blood lipids profile and glucose level were measured with enzymatic methods on the Alinity Abbott analytical system.
Statistical analysis
The data was described by mean, standard deviation, median, minimal and maximum values, and 25 and 75 percentiles for parameters with no normal distribution. Differences between values with normal distribution were checked using Shapiro-Wilks, and Lileforts tests were tested using the t-Student test or Mann-Whitney U test, depending on the distribution. Parameters that did not have normal distribution: age, height, height SD, BMI SD, glucose level 0’ and 60’, all insulin levels, TG level, and after surgery height, height SD, glucose 30’, all insulin levels, LDL-cholesterol.
Differences between dependent variables were tested using a t-Student test for dependent variables or the Wilcoxon test (checked with sign test) (if the parameter was not normal in distribution). A level p < 0,05 was recognized as statistically significant. Tests were performed using TIBCO Software Inc. (2017) Statistica version 13 StatSoft Company.
Results
Clinical and biochemical characteristics of the patients with CD at diagnosis are presented in Table I. The mean age of CD patients was 13.1 ±3.1 years. (median 14.1, range 5.4–17.1). The mean time from TSS to control OGTT and lipids profile was 15.8 ±12.3 months (median 13.1, range 3.5–42.9) (Table I).
The most common symptoms of CD patients at diagnosis were: weight gain (93.7%), growth deceleration (92.6%), and facial changes such as a round face and a facial plethora (71.0%). Other features: acne (56.2%) and striae (46.8%) were also often diagnosed. Less common presenting features were: psychological problems such as depression, anxiety, irritability (37.5%), amenorrhea (35.3%), headaches (32.2%), hirsutism (29.4%), and hypertension (19.3%) (Fig. 1).
Characteristics of the study group (CD patients before TSS) and the control group are presented in Table II. Weight SD and height SD were statistically significantly lower in CD patients in comparison with the control group (0.31 ±1.91 vs. 3.69 ±0.52; p < 0.001 and -1.84 ±1.43 vs. 4.13 ±0.52; p < 0.001; respectively). There were no significant differences in BMI SD between CD patients and the control group (Table II).
Table II
Characteristics of the study and control group
BMI of CD patients before TSS was 25.05 ±6.86 kg/m2 (median 23.58, range 14.8-43.7), whereas BMI after surgery was significantly lower, 23.17 ±6.89 kg/m2 (median 22.10, range 14.69-45.37) (p = 0.019). The mean time between measurements was 15.8 ±12.3 months (median 13.1).
At diagnosis, 40% of patients were diagnosed with impaired glucose tolerance (IGT), 6.7% were diagnosed with diabetes mellitus (DM), and 3% had impaired fasting glucose (IFG) (one patient out of 32). After TSS, we detected only one patient (out of 16 who had controlled OGTT performed) (6.25%) with IGT.
Statistically significant differences between the study group (CD patients before TSS) and the control group in insulin levels at all-time points of the OGTT, but only in fasting glucose level and in 90 minutes of the test, were detected (Figs. 2, 3, and Table III).
Figure 2
The glucose level in the oral glucose tolerance test (OGTT) in the study group (before surgery) and the control group
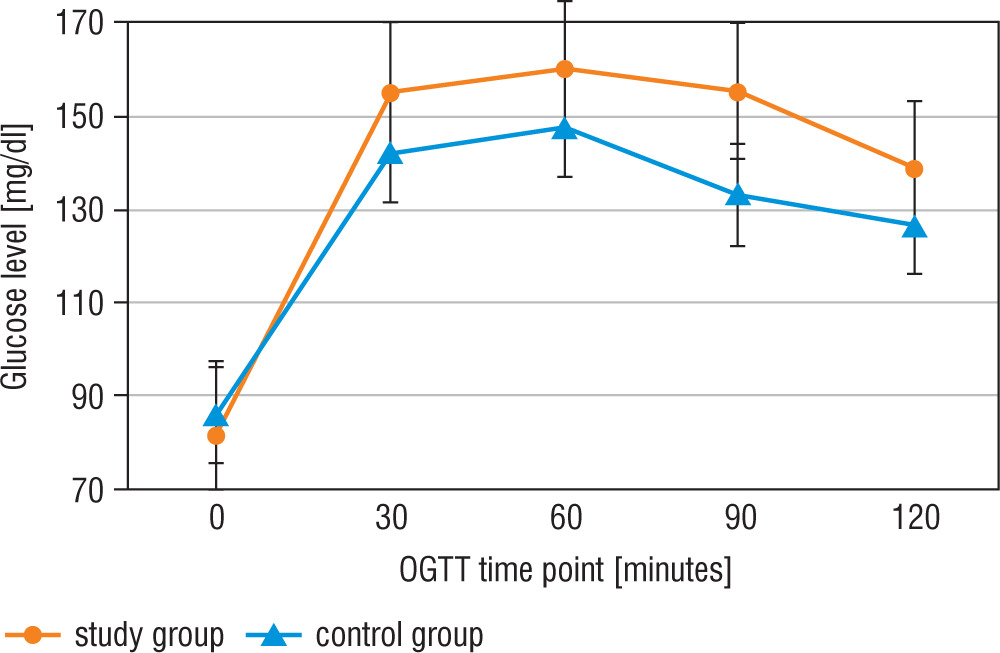
Figure 3
The insulin level in the oral glucose tolerance test (OGTT) in the study group (before surgery) and the control group
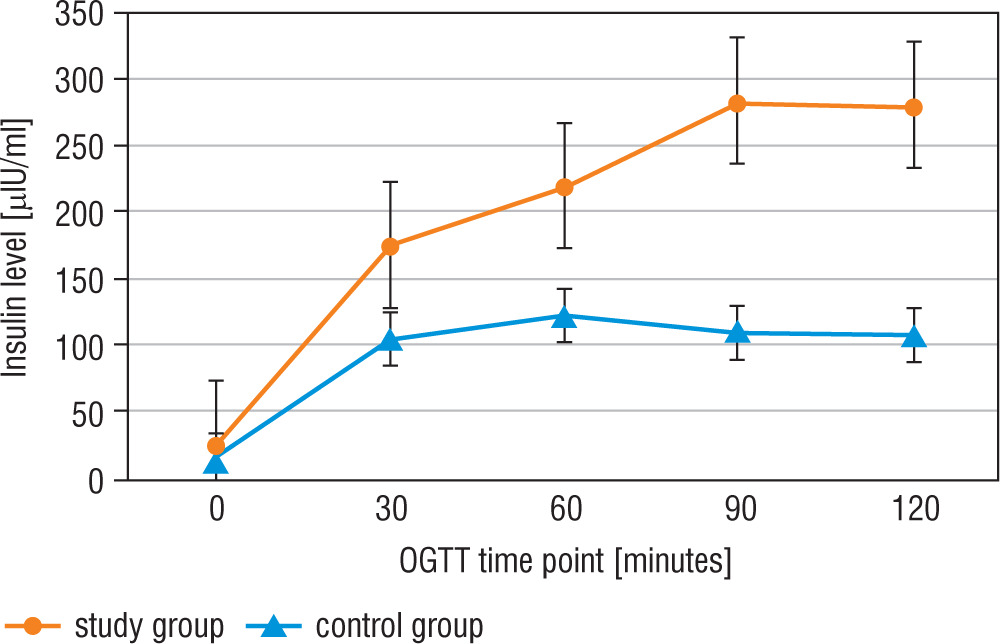
Table III
Oral glucose tolerance test (OGTT) in the study group before and after surgery and in the control group
After surgery, CD patients had statistically lower glucose levels in 0’, 30’, 90’, and 120’, and lower insulin levels in 0’, 30’, and 90’ compared to the results before TSS (Table III).
Before surgery in the CD group, 81% of patients had elevated TC, 10.5% had low HDL-c, and 66.7% had LDL-c above the upper reference range. In addition, 64% of patients also had elevated TG. After surgery, the percentage of high TC, low HDL-c, high LDL-c, and high TG were 59%, 12.5%, 25%, and 58%, respectively.
The lipid profile: TC, LDL-c, and TG levels were statistically higher in the CD group than in the BMI-matched control group (Table IV). After surgery, there were statistically lower levels of TC and LDL-c: 189.1 ±51.4 vs. 223.4 ±45.2 mg/dl (p < 0.002) and 100.8 ±40.7 vs. 129.8 ±37.4 mg/dl (p < 0.02), respectively (Table IV).
Table IV
Lipids profile in the study group before and after surgery and in the control group
Discussion
CS is a rare multisystem disease caused by prolonged exposure to excess glucocorticoids (GCS). The most frequent cause of endogenous CS in children is ACTH overproduction by/in a pituitary neuroendocrine corticotroph tumor (TPIT lineage) (85%). There is no predominance of either sex in CD children less than 15 years old [13].
In the pediatric population, autonomous cortisol secretion from the adrenal glands, or ACTH-independent CS, accounts for 15% of all cases of CS [14]. Ectopic adrenocorticotropic syndrome (EAS) is another rare cause of CS that accounts for less than 1% of adolescent cases. Most cases are neuroendocrine tumors (NETs) of the bronchi, thymus, and pancreas. Other peculiar etiologies include appendiceal, kidney, and duodenal tumors, as well as adrenal neuroblastoma, clear cell sarcoma, pancreatic tumor, gastrinoma, pheochromocytoma, medullary carcinomas of the thyroid, small cell carcinoma of the lung, Wilms’ tumor, and sacrococcygeal tumor [15].
CD often presents with central obesity, short stature or decreased linear growth in children. Linear growth is almost always severely diminished and may be useful in differentiating between childhood obesity and CS. Facial plethora, purple striae, easy bruising, acne, hirsutism, headache, and fatigue are common. In patients with CD, various complications such as hypertension, neuropsychological disturbances, osteoporosis, infections, sleep disturbances, and thromboembolic events are encountered [16]. Significant problems are metabolic consequences such as glucose and lipid disturbances – risk factors for higher morbidity and mortality.
In our research, as reported by other authors [3, 4, 13, 14, 16], the most common features were weight gain, growth deceleration, and facial changes. Other features, like acne and striae, were also often diagnosed. Less common presenting features were psychological problems, amenorrhea, headaches, hirsutism, and hypertension (Fig. 1).
The differential diagnosis of CS, especially ACTH-dependent CS, is challenging for clinical management. Neither biochemical nor imaging tests currently used exhibit a satisfactory sensitivity [17]. 90% of tumors in a CD are micro (< 10 mm), in 50% of cases, undetectable in gadolinium MRI [18]. Bilateral inferior petrosal sinus sampling (BIPSS) is the most reliable method with the highest available sensitivity and specificity in confirming pituitary ACTH production exceeding 95%; the test is performed in the case of equivocal or discordant biochemical diagnostic results and an invisible PitNET in pituitary MRI. This method is also used to detect the site of the tumor localization, thus guiding the surgeon during TSS – sensitivity for lateralization by BIPSS range from 54% to 100% [17, 19].
Because selective resection of TPIT-lineage PitNET produces immediate remission while maintaining the pituitary function, transsphenoidal surgery is the initial treatment.
The remission rates in the pediatric population after TSS are reported to be between 62% and 95%. The outcome depends on the neurosurgeon’s experience as well as on the time of follow-up [13, 16, 20–24].
In our research, we have analyzed metabolic parameters in patients with CD and the impact of the TSS on BMI, glucose, and lipids disturbances. All of our patients were in remission at follow-up. At the time of the second OGTT, 50% of patients were treated with HC (at a mean dose of 10.2 mg/m2/day), 16.7% received HC only during severe stress, and 33.3% were without glucocorticoid therapy.
BMI
TSS for pediatric CD is a procedure that results in a decrease in BMI. However, this effect is not achievable for every patient [25]. Our cohort found statistically significant improvement in BMI before TSS and after surgery. Before TSS, a BMI z-score was +1.31 (from –2.62 to 3.36), whereas a BMI z-score after surgery was significantly lower, +0.72 (from –2.65 to 3.56). The mean time between measurements was 15.8 ±12.3 months (median 13.1). These results are in line with observational studies conducted on children with CD. One of the largest analyses of pediatric patients with CD was reported by Libuit et al. [26]. They retrospectively evaluated 102 pediatric patients with CD. Pre- and post-TSS BMI z-scores were available in 27 female and 30 male patients. Before TSS, 88.9% of females and 93.3% of males had a BMI z-score higher than 0.89. After TSS, 59.3% of females and 63.3% of males had a BMI z-score higher than 0.89. These results indicate a decrease in metabolic syndrome incidence (defined by BMI status only) post-TSS in both sexes of approximately 30%. When considering WHO criteria, TSS resulted in a lower incidence of metabolic syndrome in female and male groups (i.e., 28.6% and 45%, respectively) [25]. Davies et al. [27] evaluated BMI before and after curative treatment of CD. Fourteen patients were treated with TSS, and six of them additionally underwent external beam pituitary irradiation due to persistent hypercortisolemia. The mean BMI SD at CD’s diagnosis was +2.7 (0.8–5.1) and was statistically higher than the BMI of the normal population (p < 0.01). BMI SD at the final assessment was lower than before CD’s treatment +1.7 (from −0.5 to 6.2); p < 0.05, but it was still higher than in the general population (p < 0,01) [27].
BMI improvement after TSS was also reported in the study of Valdes et al. [28]. Before the surgery, 89% of pediatric patients were overweight or obese. Although the BMI z-score after the procedure was statistically lower than baseline (2.0 ±0.7 to 1.0 ±1.2, p < 0.001), 44% of children remained overweight and obese. Two factors were related to reaching a normal weight: BMI z-score at diagnosis and BMI z-score change at 6 ±2 months [28]. Giovinazzo et al. [29] revealed that in the cured patients, BMI was significantly lower than at baseline (SD 1.46 ±1.09 vs. 0.39 ±1.07, p = 0.031); however, there was no difference in BMI among the patients with the persistent disease during follow-up [29]. In the research of Yordanowa et al. [30] among the 21 patients, BMI SDS was lower at the latest assessment (mean 0.58; from −1.9 to –2.71), compared to diagnosis mean BMI SDS 2.9 (0.1–6.9) (p = 0.000). The interval between definitive therapy and follow-up was 6.7 years [30].
Glucose disturbances
In CS, glucose disturbances are common complications. Hypercortisolemia may impair glucose metabolism through many complex pathophysiological mechanisms and is associated with varying degrees of glucose intolerance, including IGF, IGT, and DM. The American Diabetes Association (ADA) defined DM in CS as “A specific type of diabetes due to other causes, e.g., endocrinopathies” [31]. It is estimated that 20–45% of patients with endogenous CS suffer from DM, and 10-30% of glucose intolerance is diagnosed [32]. Diabetes ketoacidosis (DKA) as an initial presentation of CD in children is rarely reported in the literature [33, 34].
In our study, at the diagnosis of CD, 40% of patients had impaired glucose tolerance (IGT), 6.7% diabetes, and 3% impaired fasting glucose.
In the adult population, the prevalence of DM was significantly higher in an ectopic (74%) compared to the pituitary (33%) and adrenal (34%) CS [35]. This indirectly suggests that the degree of cortisol excess can be relevant for developing altered glucose metabolism. Apart from that, age, genetic predisposition, and the duration of hypercortisolemia are important risk factors for DM in CS [36].
The mechanism of glucose disturbances in CD is complex. Excessive production of cortisol leads to increased insulin resistance and impaired insulin secretion [5]. GCS activity on the liver, pancreas, skeletal muscle, and adipose tissue leads to hyperglycemia. Cortisol escalates gluconeogenesis directly by regulating several enzymes, e.g., phosphoenolpyruvate carboxykinase and glucose-6-phosphatase. GCS induces gluconeogenic enzymes by the forkhead box protein O1 (FOXO1), mitogen-activated kinase phosphatase 3 (MKP3), and other signaling pathways like liver X receptor (LXR) [5]. Additionally, hypercortisolism influences gluconeogenesis indirectly, providing substrates to this process by lipolysis and proteolysis. GCS decreases insulin’s inhibitory effect on glucose output by exacerbating selective insulin resistance in the liver.
Insulin resistance is also increased in skeletal muscle. Proteolysis in muscle tissue observed in chronic cortisol exposure results in glucose uptake impairment [37]. GCS decreases adipokine levels and increases leptin levels in visceral adipose tissue, which correlates with insulin resistance. Additionally, they elevate free fatty acid (FFA) production by causing lipolysis in adipose tissue. FFA impairs insulin receptor signaling and causes glucose uptake disturbances [5].
β-cells are also affected by GCS excess. Reduced insulin secretion results from decreased glucose transporter type 2 (GLUT2) and glucokinase expression, followed by reduced adenosine triphosphate (ATP) synthesis and calcium influx [5].
Additionally, GCS enhances the action of insulin-antagonist hormones such as glucagon or epinephrine.
DKA has long been considered a hallmark of type 1 DM; however, it can also occur in other types of DM - very rare as a complication of glucose disturbances in CD. There are three proposed mechanisms of DKA in type 2 diabetes and specific types of diabetes, e.g., endocrinopathy: insulinopenia, the elevation of counter-regulatory stress hormones, and increased levels of free fatty acids. However, the predominant mechanism is the deficiency or decrease in insulin secretion [38].
Correction of cortisol level after TSS is generally followed by improved glucose metabolism [32]. In our study, after TSS, we detected one patient with IGT. However, in this case, OGTT was performed soon after TSS (3.5 months), and obesity was still observed at follow-up. The patient was in remission and treated by HC at the dose of 10.2 mg/m2/day. Our research shows patients have statistically lower glucose levels in 0’, 30’, 90’, and 120’, and lower insulin levels in 0’, 30’, and 90’ after surgery. However, there are reports that insulin resistance and cardiovascular risk can persist even after normalizing glucocorticoid parameters. Colao et al. [39] found that adult patients, even after five years of curative treatment for CD, maintained higher fasting glucose and insulin levels, glucose load-stimulated glucose, insulin levels, BMI, total cholesterol, and LDL-c, versus sex and age-matched controls. Authors also report that patients who experienced immediate, post-surgical hypocortisolism had significantly lower BMI versus those who did not [39]. Giordano et al. [40] evaluated metabolic parameters (fasting and 2-hour glucose level after OGTT and lipid profile) in 14 patients with CD and 15 individuals with adrenal adenomas. Patients with previous CD had worse metabolic outcomes than those with cured adrenal adenomas. Multiple pituitary hormone deficiencies after surgery and subsequent hormonal replacement treatments could explain these outcomes [40].
In our study, 50% of patients at follow-up had been treated with hydrocortisone. The treatment was at a physiological dose however it can impact metabolic parameters. It is known that most patients in remission of CD present a transient CAI, usually requiring supplementation of steroids for about a year. Only patients with multihormonal pituitary axis dysfunction besides CAI, including hypothyroidism, hypogonadism, or arginine vasopressin deficiency, require steroid supplementation [41]. Wędrychowicz et al. [25] indicate that the longer the symptoms of CD lasted before its diagnosis, the longer supplementation after the procedure is required [25].
In our study, there are statistically significant differences between the study and control groups in insulin levels at all-time points of the OGTT, fasting glucose levels, and 90 minutes of the test. Faggiano et al. [42] reported significantly higher 2-hour glucose and insulin level in patients with CD than in the BMI-matched control group. Patients with CS present a higher HOMA index regardless of BMI, indicating that hypercortisolism by itself impacts insulin sensitivity [5]. These results may also be the effect of central obesity in CD patients. A visceral pattern of obesity leads to increased leptin and reduced apelin levels, which is associated with insulin resistance [5].
Dyslipidemia
Dyslipidemia can also be associated with CS. We can observe elevated TC, very low-density lipoprotein (VLDL), LDL-c, and TG levels. In our study, 81% of patients presented elevated TC, 64% of patients increased TG, and 66.7% had LDL-c above the upper reference range. Additionally, 10.5% had low HDL-c levels. GCS excess has a complex impact on lipid metabolism. Both lipogenesis and lipolysis are affected. Activated lipase lipoprotein causes increased triglyceride hydrolysis in adipose tissues and FFA turnover. On the other hand, GCS stimulates lipogenesis in the liver and VLDL production [43,44]. The mechanism can be mediated by AMP-activated protein kinase (AMPK), which is involved in metabolic changes observed in CS. GCS suppresses AMPK activity in visceral adipose tissue, causing an increase in lipogenesis, while in the liver, they stimulate AMPK activity. Kola et al. [44] revealed that the patients with CS exhibited 70% lower AMPK activity in visceral adipose tissue than control subjects increasing fatty acid synthase expression. Hypercortisolism was proportional to the inhibition of AMPK activity [45]. 11β-Hydroxysteroid dehydrogenase type 1 (11βHSD1) is an enzyme expressed in key metabolic tissues, including the liver and adipose tissue. 11βHSD1 reduces cortisone to the active hormone cortisol at a cellular level. Hepatic overexpression of 11βHSD1 results in insulin resistance, hepatic steatosis, and increased lipid synthesis. It suggests that 11βHSD1 can play a role in lipids abnormalities development in CS [43]. GCS influences metabolic effects through glucocorticoid receptors (GR). GR is a transcription factor that controls the transcriptional rate of selected genes. The metabolic axis consisting of GR and hairy enhancer of split 1 (Hes1) repressor components is probably involved in lipids regulation in CS. Hes1 regulates the hepatic production of pancreatic lipase. Liver-specific genetic restoration of Hes1 in steatotic animals normalizes hepatic TG levels [46].
In our study, TC, LDL-c, and TG levels are statistically higher in the CD group than in the BMI-matched control group. Among adult patients, Faggiamo et al. [42] revealed lower HDL-c cholesterol in patients with CD compared to the BMI-matched control group.
After one-year remission of CD in a pediatric population, the improvement of lipids variables (except HDL-c and apoA1) was evaluated by Makri et al. [2]. The study was conducted among 33 patients using nuclear magnetic resonance (NMR) spectroscopy to measure lipoprotein particles. In our research, TC and LDL-c levels were statistically lower after surgery. Similar results we found in Sun et al. [44] study in the adult population. TC and LDL-c levels decreased after surgery, and the prevalence of hypertriglyceridemia was unchanged. The authors evaluated that hyperlipidemia can persist in patients in remission and is associated with higher baseline TC levels [44]. In our study, compared to other authors, lipids concentration improved after TSS; however, the higher levels of TC, LDL-c, and TG persist in 59%, 25%, and 58% of patients, respectively. Additionally, HDL-c below the normal range was detected in 12% of patients (vs. 10.5% before TSS). These results suggest that follow-up is necessary to control the lipids profile, even in patients in remission.
Conclusions
In conclusion, our results confirm that metabolic consequences such as glucose disturbances and dyslipidemia, as well as central obesity, are often associated with CD in children. To our knowledge, this study is the first assessment of metabolic parameters before and after TSS in children with this rare disease. Disease remission significantly impacts the improvement of metabolic parameters in children, especially glucose, insulin, TC, and LDL-c levels, likewise BMI. Metabolic consequences are associated with hypercortisolemia and, in most cases, transient. In our study, triglycerides remained elevated at the time of testing. Our results also suggest that patients with CD require a higher insulin level to maintain normoglycemia than patients with obesity.


