
Introduction
Biliary atresia (BA) is an obliterative cholangiopathy characterized by inflammation of the bile ducts leading to progressive fibro-obliteration of the extrahepatic biliary tree and, to a variable extent, the intrahepatic bile ducts. The progressive destruction of the intra- and extrahepatic bile ducts leads to cholestasis, liver fibrosis and cirrhosis [1]. The exact etiology and pathogenesis of BA remain unknown. It is believed that genetic factors may have a significant role in BA pathogenesis [2].
The microRNAs (miRNAs) and their target genes cooperatively control life processes as they participate in complex regulatory networks and control gene expression in all biological processes, including cell development, immune responses, aging and cell death [3].
Many researchers have recently reported that the aberrant expression of miRNAs in hepatic tissue was related to the pathogenesis of liver disease, and different types of liver injury can elicit different miRNA secretion patterns and concentrations. Therefore, identifying disease-specific miRNAs could be used as potential diagnostic and therapeutic tools [4]. Single nucleotide polymorphisms (SNPs) are the most common genetic variations in a population [5]. These single-nucleotide polymorphisms may have a potential to affect the efficiency of miRNA binding to the target sites or can create or disrupt binding sites. The resulting gene dysregulation may involve changes in phenotype and may eventually prove critical for the susceptibility to different disease processes [6].
miR-499 participates in many biological processes which are crucial in the development and progression of many disease conditions [7]. An important polymorphism in the miR-499 with A to G change (rs3746444) was reported in 2008. This polymorphism is located in the stem region opposite to the mature miR-499 sequence and results in a change in the stem structure of miR-499. Compared with the A allele, the secondary structure for the G allele is less stable [8].
The aim of this study was to evaluate the association of miRNA-499 rs3746444 A>G polymorphism with BA risk and its correlation with clinic-pathologic features of BA in Egyptian children.
Material and methods
This study was carried out at laboratory medicine department, National Liver Institute, Menoufia University, Egypt from October 2017 to November 2019. This study was conducted on 300 pediatric patients (100 BA patients, 100 non-BA patients, and 100 matched healthy controls). Among the 100 patients with BA 86 patients underwent Kasai portoenterostomy. The non-BA group included 64 cases with progressive familial intrahepatic cholestasis (PFIC), 9 cases with Alagille syndrome, 1 case with non-syndromic bile duct paucity, 2 cases with galactosemia, and 24 cases with idiopathic neonatal hepatitis. They were collected from the inpatient ward and outpatient clinic of pediatric hepatology, gastroenterology and nutrition department, National Liver Institute – Menoufia University, Egypt.
Diagnosis of BA was confirmed by intra-operative cholangiography when possible before corrective surgery (Kasai operation), and patients were subjected to intraoperative wedge liver biopsy. The diagnosis of BA was ruled out in patients with cholestasis due to causes other than BA. The diagnosis of these patients depended on a set of specific laboratory tests according to the expected etiology, liver imaging, liver biopsy, negative intra-operative cholangiography finding (in some patients), and applying the BA score [9]. The control group comprised 100 age- and gender-matched children without any evidence of liver disease. Ethical committee approval of the National Liver Institute was taken and informed written consent was obtained from all patients’ and controls’ legal health authorities before involvement in the study.
All individuals were subjected to clinical assessment, including full history and clinical examination, abdominal ultrasound, and routine laboratory investigations comprising liver function tests: total bilirubin, direct bilirubin, albumin, total protein, aspartate aminotransferase (AST), alanine aminotransferase (ALT) and γ-glutamyl transferase (γ-GT) on the Cobas 6000 analyzer (c501 module), which is a photometric unit of the autoanalyzer, serum hepatitis C virus antibody (HCV-Abs) and serum hepatitis B virus surface antigen (HBsAg) by electrochemiluminescence immunoassay, complete blood count (CBC) using the Sysmex XT1800i automated hematology analyzer, international normalized ratio (INR) by Dade Behring Marburg GmbH, D-35041 Marburg, Germany, miRNA-499 rs3746444 gene polymorphism analysis by real-time polymerase chain reaction (PCR), and allelic discrimination analysis.
After the Kasai operation, those who underwent the Kasai operation were subjected to evaluation six months after the procedure by total bilirubin, direct bilirubin, serum albumin, and INR determination.
MicroRNA-499 rs3746444 genotyping analysis
Deoxyribonucleic acid (DNA) extraction: DNA was extracted from whole blood samples using the Thermo Scientific Gene JET Whole Blood Genomic DNA Purification Mini Kit, as recommended by the manufacturer.
TaqMan SNP Genotyping assay: MicroRNA-499 Rs3746444 was genotyped by Rotor Gene real-time PCR fluorescence (QIAGEN, GmbH) using fluorescent labeled probes which are sequence-specific oligonucleotides with a fluorophore and a quencher. Two TaqMan probes, each specific for one of the available alleles (A or G), are present in the reaction, specifically annealing to the target region between the two primers. The proximity of the fluorophore with the quencher results in efficient quenching of fluorescence from the fluorophore. The Taq DNA polymerase extends the primer. When the enzyme reaches the TaqMan probe, its 5’–3’ exonuclease activity degrades the probe, resulting in physical separation of the fluorophore from the quencher. Increased fluorescence associated with the measured Rn values from the released fluorophore indicates which alleles are present in the sample.
PCR cycling conditions: 1 min cycle at 60°C (pre-read) and 90 min cycles (amplification steps) stage 1: hold at 95°C for 10 min and stage 2: 40 cycles (each cycle consists of 15 s at 95°C and 1 min at 60°C) followed by 1 min cycle at 60°C for (post-read).
The SNP ID: Rs3746444 SNP in the MIR499 gene was determined by real-time detection PCR using the ABI TaqMan allelic discrimination kit (catalogue #4351379, assay ID C-2142612-40, Applied Biosystems, Carlsbad, CA) and the Rotor Gene Real Time PCR System (QIAGEN, GmbH).
Context sequence [VIC/FAM]
ATGTTTAACTCCTCTCCACGTGAAC[A/G]TCACAGCAAGTCTGTGCTGCTTCCC (VIC dye for allele A, FAM dye for allele G).
Statistical analysis
Results were statistically analyzed using SPSS 18 (SPSS Inc., Chicago, IL). Quantitative data were shown as median and interquartile range (IQR). Qualitative data were expressed as frequency and percent. The χ2 test was used to measure the association between qualitative variables. The adjusted odds ratio (ORs) with 95% confidence interval (95% CIs) was used. The Kruskal-Wallis test was done to compare medians of more than 2 sets of quantitative data and the Mann-Whitney U test was done to compare medians of 2 sets of non-parametrically distributed quantitative data. The p (probability) value was considered to be of statistical significance if it was less than 0.05.
Results
All groups were gender and age matched (Table 1). The levels of liver profile tests (AST, ALT, γ-GT, total bilirubin, direct bilirubin, albumin, and INR) and hemoglobin values showed statistically significant differences (p < 0.05) among the three studied groups, except for hemoglobin; no significant difference was found between BA and non-BA group (Table 1).
Table 1
Gender, age and baseline laboratory investigations among the studied groups
[i] p1 – significance between the control and non-BA groups, p2 – significance between the control and BA groups, p3 – significance between the non-BA and BA groups BA – biliary atresia, ALT – alanine aminotransferase, AST – aspartate aminotransferase, g-GT – gamma-glutamyl transferase, INR – international normalized ratio, HB – hemoglobin
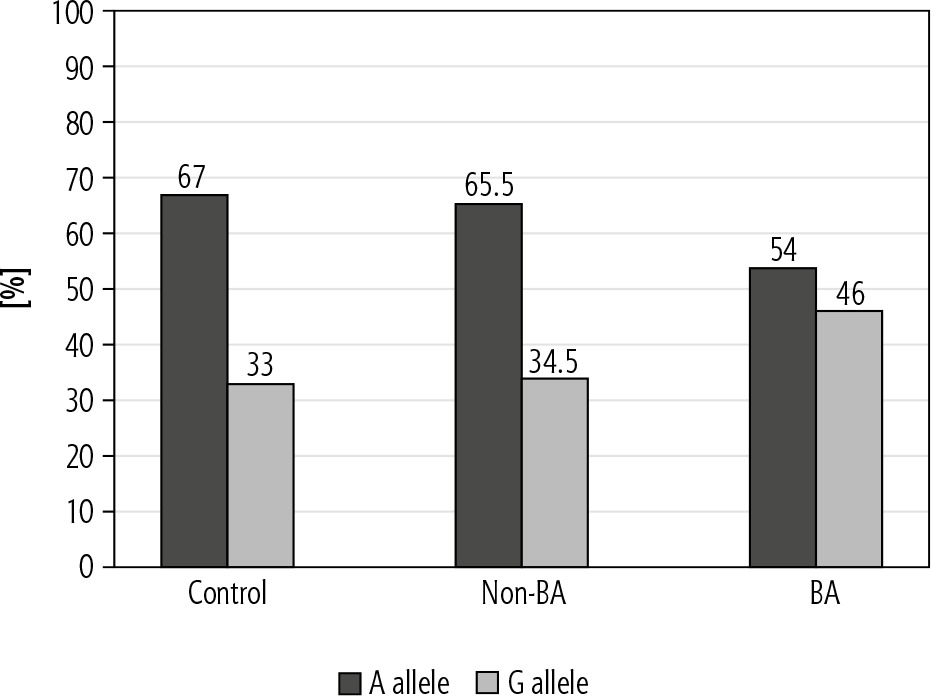
Our results revealed a significant difference concerning the genotype distribution among the three studied groups (p < 0.05). In the dominant model (GG + AG vs. AA), the distribution among the studied groups revealed no significant difference (p > 0.05), while in the recessive model (GG vs. AA + AG) a significant difference was found between the studied groups (p < 0.05). The wild allele A was more frequent in the control and non-BA groups while the variant allele G was more frequent in the BA group (p < 0.05) (Table 2).
Table 2
Genotype distribution and allele frequencies of miR-499 polymorphism (rs3746444) among the studied groups
The comparison of genotype distribution and allele frequencies of miR-499 SNP (rs3746444) between control and BA groups showed that GG genotype was associated with a significantly increased risk of BA as compared with AA genotype (OR = 3.9, 95% CI: 1.54-9.86, and p = 0.003) while AG genotype was not significantly associated with the risk of BA as compared with AA genotype (OR = 1.25, 95% CI: 0.68-2.3, and p = 0.481).
The subjects with the variant G allele had a significant risk of BA compared with wild allele A (Fig. 1) (OR = 1.73, 95% CI: 1.15-2.59 and p = 0.008). The G allele also showed a significant association with BA risk in the recessive model [GG vs. AG + AA (OR = 3.44, 95% CI: 1.45-8.11, and p = 0.003)], while the dominant model showed no significant association with disease risk (p = 0.106).
The comparison of genotype distribution and allele frequencies of miR-499 SNP (rs3746444) between BA and non-BA groups showed that GG genotypes were associated with a significantly increased risk of BA as compared with AA genotype (OR = 3.04, 95% CI: 1.27-7.31, and p = 0.011), while AG genotypes were not significantly associated with the risk of BA as compared with AA genotype (OR = 1.24, 95% CI: 0.67-2.30, and p = 0.491). The subjects with the variant G allele had a highly significant risk of BA compared with wild allele A (OR = 1.62, 95% CI: 1.08-2.42, and p = 0.019). The G allele also showed a significant association with risk of BA in the recessive model [GG vs. AG + AA (OR = 2.69, 95% CI: 1.21-6.00, and p = 0.013)], while in the dominant model no statistical significance was found [AA vs. AG + GG (OR = 1.55, 95% CI: 0.86-2.77, and p = 0.141)].
Concerning the laboratory, clinical and histopathological assessment, there was a significant difference between different genotypes in the BA group regarding baseline ALT, AST, γ-GT, and total bilirubin. Furthermore, the multiple pairwise comparisons regarding the levels of ALT, AST and γ-GT showed that no significant difference was found between AA and AG genotypes, while a significant difference was found between the AA and GG genotypes and AG and GG genotypes (p < 0.05) with higher values with GG genotype. Regarding total bilirubin, a significant difference was found between AA and GG genotypes, while no significant difference was found between AA and AG genotypes and AG and GG genotypes. No significant difference was found between different genotypes regarding albumin, INR and hemoglobin values. The present study showed no significant difference in the clinical data (hepatomegaly and splenomegaly) among different genotypes in the BA group, while there was a significant difference among different genotypes as regards the degree of fibrosis (Table 3).
Table 3
Comparison between different miR-499 genotypes regarding laboratory investigations, clinical data and histopathological assessment in the BA group
Table 4 shows a significant difference (p < 0.05) regarding change in the laboratory parameters before and after the Kasai operation among genotypes of miR-499 SNP (rs3746444) polymorphism in the BA group except for albumin; no significant difference was found (p > 0.05). Furthermore, the multiple pairwise comparison showed no significant difference in TB, DB and INR between AA and AG genotypes. Also, no significant difference was found between AG and GG genotypes, while a significant difference was found between AA and GG genotypes regarding TB, DB and INR.
Table 4
Changes in the laboratory parameters before and after the Kasai operation among genotypes of miR-499 SNP (rs3746444) polymorphism in the biliary atresia group
Discussion
Biliary atresia is the most common cause of end stage liver disease in infants and is associated with poor prognosis and high mortality. The etiology of BA is not known, but irrespective of the cause, histological evidence at diagnosis supports the involvement of the immune system in mediating injury to the bile duct epithelium, which is facilitated by adhesion molecules that help recruitment of inflammatory cells [10].
In this study, we investigated the effects of the miR-499 rs3746444 polymorphism on the risk of BA, the association with the liver function status and the clinic-pathologic data and whether this gene polymorphisms affect the prognosis after the Kasai operation in patients who underwent this procedure. To the best of our knowledge, this is the first study to investigate miR-499 rs3746444 gene polymorphism in cases of BA among the Egyptian population.
The AG genotype was the most prevalent genotype in the studied population, while the GG genotype was associated with a significantly increased risk of BA by 2.9 times as compared to AA and AG. The subjects with the variant G allele had a significant risk of BA as compared with wild allele A. Additionally, in the recessive model, the G allele showed a significant association with increased risk of BA by 2.4 times. On the other hand, the distribution of miR-499 SNP (rs3746444) genotypes, alleles frequencies, dominant, or recessive models were non-significantly associated with the risk of non-BA disease. Consistent with our study, Fattah et al. investigated the association between miR-499 SNP (rs3746444) and rheumatoid arthritis (RA) [11]. They demonstrated that the AG genotype was the most prevalent in the study population. In addition, it was found that the G allele was associated with RA. Several lines of evidence suggest that miR-499a plays critical roles in orchestrating the immune response in various human disorders. Many studies have claimed a key role for miR-499 in modulating the immune response, cell proliferation, apoptosis, inflammation, and immune response. Exploring gene targets of miR-499a identified inflammatory-related gene targets, including interleukin (IL)-13 and IL-23, IL6, IL-2 and IL-17 [12].
The significantly higher values of the liver function tests with GG genotype at presentation and its association with the severity of fibrosis indicate that there is an effect of the gene polymorphism on the disease severity due to its effect on the biological processes such as inflammation and immune response. In agreement with our results, Shan et al. observed that GG genotype was significantly associated with severity of fibrosis in BA patients, but they failed to observe any difference in the preoperational liver function indices [13].
Regarding the effect of genotypes on the outcome 6 months after the Kasai operation, it was found that the change in total and direct bilirubin, and INR levels were significantly more improved in patients carrying AA or AG genotypes but not GG, revealing bad prognosis after the Kasai operation for patients with the GG genotype.
Finally, the obtained data support our assumption that mutation in the seeding area of miR-499 may affect affinity of miRNA, interfering with the perfect binding to target mRNA, and thus may modify BA susceptibility and affect the concentration of inflammatory cytokines, which may be associated with disease severity and outcome after the Kasai operation. So, polymorphism of miR-499 may not only play a role in biliary pathogenesis but also have a longterm effect on the post-Kasai prognosis.
Conclusions
There is an association between the miR-499 SNP genotypes and the incidence of BA in Egyptian patients. The variant allele G was higher in the BA group than the other two groups. miR-499 rs3746444 polymorphism was significantly associated with severe liver inflammation and bad prognosis after the Kasai operation.


