
Introduction
The symptoms of ovarian cancer are unclear, and ovarian cancer is known as the “silent killer”. In addition to the silent and slow progression of ovarian cancer, there is no universal screening method for dia-gnosis of ovarian cancer [1]. The preoperative discrimination between benign and malignant adnexal masses is important to decide further management [2].
Women with malignant tumours should be referred to a gynaecology oncologist because the quality of surgical staging/lymph node dissection is an important prognostic factor in ovarian cancer [3]. Furthermore, appropriate and timely referral to a gynaecology oncologist has been proven to increase the overall survival of women with ovarian cancer [4].
Pelvic assessment, tumour markers, and radiological investigations have been proposed for screening and early detection of ovarian tumours, but each parameter is not sensitive nor specific when considered separately. The ovarian cancer screening trial UK Collaborative Trial of Ovarian Cancer Screening recommended screening for ovarian malignancy using serum cancer antigen-125 (CA-125) with transvaginal sonography (TVS) (multimodal screening) to calculate the risk malignancy index (RMI) [5, 6]. The risk of malignancy index is calculated from the CA-125 absolute value (IU/ml), menopausal status (M), and ultrasound findings (U) [5, 6].
Recently, Dora et al. evaluated the diagnostic performance of RMI in women with adnexal masses and found RMI was simple and applicable tool in the primary evaluation of women with pelvic masses in non-specialized gynaecology centres [1]. In addition, Al-Asadi et al. found RMI was a practical and reliable tool in preoperative discrimination between benign and malignant adnexal masses [7]. Therefore, this study was designed to detect the morphological parameters of ovarian masses, and measure the accuracy of RMI in diagnosing ovarian malignancy.
Material and methods
Women ≥ 18 years old presented with adnexal masses, scheduled for surgical intervention were included in this prospective study after approval of institutes’ Ethics Committee and informed consents in accordance with the Helsinki declaration.
Sexually inactive women, those with adnexal masses with pregnancy, or with pelvic inflammatory disease (PID), women with ovarian malignancy under treatment, or pelvic masses arising from the urinary tract or gastrointestinal tract (GIT), and women who refused to participate were excluded from this study.
Participants were subjected to thorough history and examination to detect their age, parity, weight, and body mass index (BMI), followed by TVS examinations using a 7.5-MHz transvaginal probe.
After the routine preoperative investigations which were done according to the hospital protocol, and including complete blood picture, liver and kidney function, chest X-ray, and β-hCG (to exclude pregnancy). A blood sample was obtained preoperatively from each participant to measure serum CA-125, followed by TVS by an expert sonographer (blinded to the participants’ clinical data to avoid potential bias) for evaluation of the suspected ovarian masses. The suspected ovarian masses were evaluated regarding its consistency (cystic or solid), and whether the suspected masses were unilateral or bilateral, uni-locular or multi-locular, with ascites and/or extra ovarian metastasis [8, 9].
The preoperative RMI was calculated for participants using RMI-1, introduced by Jacobs et al. in 1990 [10], and using the CA-125 absolute value (mIU/ml) X Menopausal status (M) X Ultrasound score (U).
Cancer antigen-125 is a tumour marker commonly used in the screening of high-risk women for ovarian cancer. The normal serum level of CA-125 is 0–35 IU/ml [11]. Cancer antigen-125 produced in low quantities by normal ovarian epithelial cells, peritoneal lining cells, lining cells of GIT, pancreas, breast, and lung. High CA-125 is frequently associated with epithelial ovarian tumours [10]. Cancer antigen-125 is also elevated in other malignancies (breast, lung, GIT, pancreatic, endometrial, and fallopian tube cancers) and benign conditions (endometriosis, adenomyosis [12–15], fibroid uterus, PID, normal, and ectopic pregnancies, peritonitis, diverticulitis, inflammatory bowel disease, tuberculosis, and liver diseases) [14, 15].
The menopausal status (M) is 1 for premenopausal women and 3 for postmenopausal women. Postmenopausal status defined as > one year of amenorrhoea or women > 50 years old after hysterectomy (confirmed by serum FSH) [10]. Women > 40–50 years who did not meet the postmenopausal criteria were included in the premenopausal group.
The ultrasound score (U) is based on ultrasound parameters, and it includes bilateral lesion, multi-loculation, solid lesion, ascites, and extra ovarian metastasis [8, 9].
U score is 0 if no ultrasound parameters are detected, 1 if one ultrasound parameter is detected, and 3 if ≥ 2 ultrasound parameters detected [16, 17].
The collected data were statistically analysed to detect the morphological parameters of the studied ovarian masses (primary outcome), and the calculated preoperative RMI was compared to postoperative histology (gold standard) to assess the accuracy of RMI in diagnosing ovarian malignancy (secondary outcome).
Sample size
The required sample size for this study was calculated using data from previous studies [1, 2, 4, 7] and G Power 3.1.9.4 for sample size calculation, setting α-error probability at 0.05, power (1β-error probability) at 0.95%, effective sample size (w) at 0.5, and t-test for statistical analysis. An effective sample size of ≥ 264 women (88 in each group) was needed to produce a statistically acceptable figure.
Statistical analysis
Numerical variables were presented as mean ±SD, while categorical variables were presented as number and percentage (%). The studied women were divided into 3 groups: a reproductive group (≥ 18–40 years), a premenopausal group (> 40–50 years), and a postmenopausal group (> 50 years), to detect the morphological parameters of ovarian masses in the 3 studied groups (especially reproductive group) and accuracy of RMI in diagnosing ovarian malignancy.
One-way ANOVA test with post-hoc Bonferroni correction was used for analysis of variance between the 3 studied groups. Student’s t and chi-square (χ2) tests were used for analysis of quantitative and qualitative data, respectively. The receiver operating characteristic (ROC) curve was used to detect the cut-off value of RMI with highest sensitivity, specificity, positive predictive value (PPV), and negative predictive value (NPV) in diagnosing ovarian malignancy. The correlation coefficient analysis was also used to detect the relationship between RMI and participants’ variables in the ovarian malignancy group. P < 0.05 was considered significant.
Results
In total, 264 women in 3 groups: reproductive, premenopausal, and postmenopausal (88 in each group), were included in this prospective comparative multicentre study, which was conducted over 3 years (2018–2021) to detect the morphological parameters of ovarian masses in the 3 studied groups (especially the reproductive group), as well as an assessment of the accuracy of RMI in diagnosing ovarian malignancy.
The characteristics of the 3 studied groups are shown in Table 1. There was no significant difference between the groups regarding mean age, weight, BMI, CA-125, ultrasound score, and RMI. Only the parity was significantly lower in the premenopausal group compared to the reproductive group (2.4 ±1.65 vs. 3.05 ±1.02, respectively) (p = 0.0003) (Table 1).
Table 1
Characteristics of the 3 studied groups
DF – difference of freedom between groups, F – statistical test of ANOVA analysis (ANOVA coefficient), MS – mean of squares between groups, N – number (one way ANOVA test used for analysis of variance between the 3 studied groups), SD – standard deviation (significant value < 0.016 according to post-hoc test Bonferroni correction), SS – sum of squares between groups
The incidence of malignant ovarian tumours was significantly higher in the premenopausal and postmenopausal groups [35.2%, (31/88)] compared to reproductive group [9.1% (8/88)], (p = 0.0008). The incidence of serous ovarian and endometriotic cysts was significantly higher in the reproductive group [38.75% (31/80) and 5% (4/80), respectively] compared to the postmenopausal group [14.0% (8/57) and 0% (0/57), respectively], (p = 0.001 and 0.03, respectively). The incidence of ovarian cystadenoma was significantly higher in the premenopausal group [31.6% (18/57)] compared to the reproductive group [13.75% (11/80)] (p = 0.04). The incidence of ovarian fibroma was significantly higher in the premenopausal and postmenopausal groups [5.3% (3/57)] compared to the reproductive group [0% (0/80)], (p = 0.01). In addition, the incidence of ovarian fibro-thecoma, and thecoma was significantly higher in the postmenopausal group [8.8% (5/57) and 3.5% (2/57), respectively] compared to the reproductive group [0% (0/80) and 0% (0/80), respectively] (p = 0.002 and p = 0.04, respectively) (Table 2).
Table 2
Histological types of the studied ovarian masses, documentation of intraoperative findings and surgical procedures
The incidence of ovarian cystadenocarcinoma was significantly higher in the premenopausal and postmenopausal groups [32.2% (10/31)] compared to the reproductive group [0% (0/8)], (p = 0.04) (Table 2).
The incidence of malignant and benign ovarian tumours in the reproductive group was 9.1%, and 90.9%, respectively, while it was 35.2% and 64.8%, respectively, in the premenopausal and postmenopausal groups (Table 2).
The clearly documented intra-operative findings (i.e. whether the studied masses were unilateral or bilateral, unilocular or multilocular, solid or cystic, mobile or fixed, presence of ascites, and extra ovarian metastasis), and the surgical procedures done (i.e., whether unilateral or bilateral salpingo-oophorectomy or total hysterectomy with unilateral or bilateral salpingo-oophorectomy, with or without omentectomy ± lymphadenectomy) were significantly higher in the postmenopausal group [88.6% (78/88)] compared to the reproductive and premenopausal groups [40.9% (36/88) or 47.7% (42/88), respectively] (p = 0.01 and 0.01, respectively) (Table 2).
Only the parity in the reproductive group was significantly lower in malignant ovarian tumours compared to benign tumours (1.25 ±1.4 vs. 3.2 ±0.8) (p = 0.006) (Table 3).
Table 3
Malignant vs. benign ovarian tumours in the reproductive group
There was no significant difference between the ma-- lignant and benign ovarian tumours in the premenopausal group regarding mean age, weight, BMI, parity, CA-125, ultrasound score, and RMI (Table 4).
Table 4
Malignant vs. benign ovarian tumours in the premenopausal group
Body mass index in the postmenopausal group was significantly higher in malignant ovarian tumours compared to benign tumours (32.8 ±2.9 vs. 25.7 ±2.2 kg/m2, respectively), (p = 0.03) (Table 5).
Table 5
Malignant vs. benign ovarian tumours in the postmenopausal group
Regarding malignant ovarian tumours
The histological types of malignant ovarian tumours in the studied groups are listed in Figure 1. The malignant ovarian tumours (7 in the reproductive group, 31 in the premenopausal group, and 31 in the postmenopausal group) were compared to benign tumours (194) in the studied groups, with no significant difference regarding mean age, weight, BMI, parity, CA-125, ultrasound score, and RMI (Table 6).
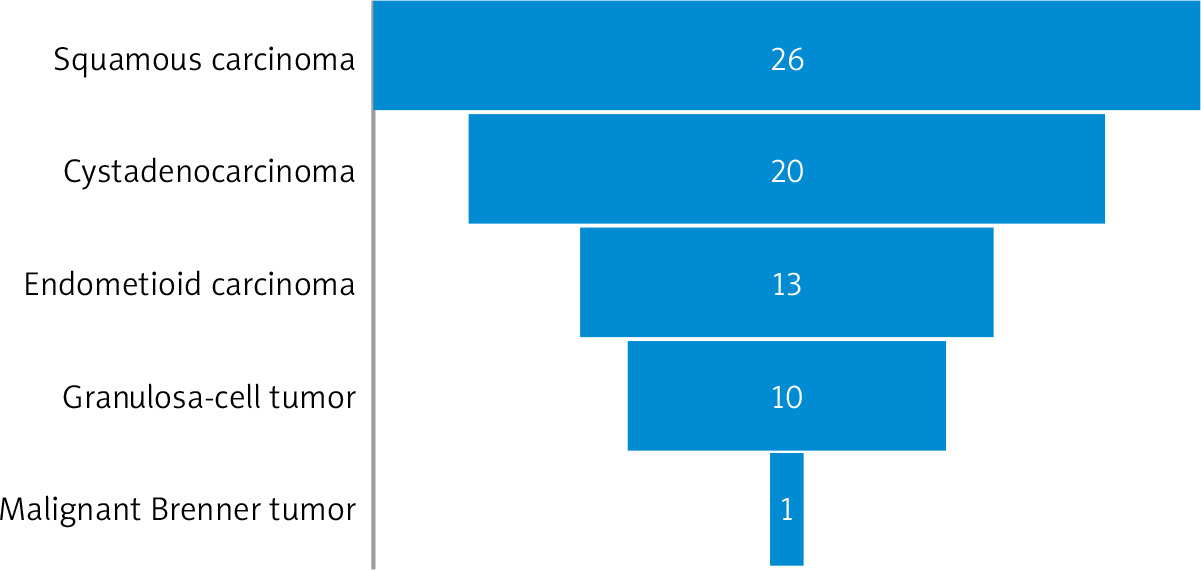
Table 6
Malignant vs. benign ovarian tumours in the 3 studied groups
Risk of malignancy index
The risk of malignancy index at a cut-off value of 200 had 75% sensitivity, 98.75% specificity, 85.7% PPV, and 97.5% NPV in diagnosing ovarian malignancy in the reproductive group (Table 7). The ROC showed that RMI at a cut-off value > 231.6 had 75% sensitivity, 100% specificity, 100% PPV, and 97.3% NPV in diagnosing ovarian malignancy in the reproductive group [area under curve (AUC) 0.950, 95% CI: 0.88–0.98, p < 0.001] (Fig. 2).
Fig. 2
The receiver operating characteristic curve for risk malignancy index at a cutoff value > 231.6 in the reproductive group
RMI – risk malignancy index
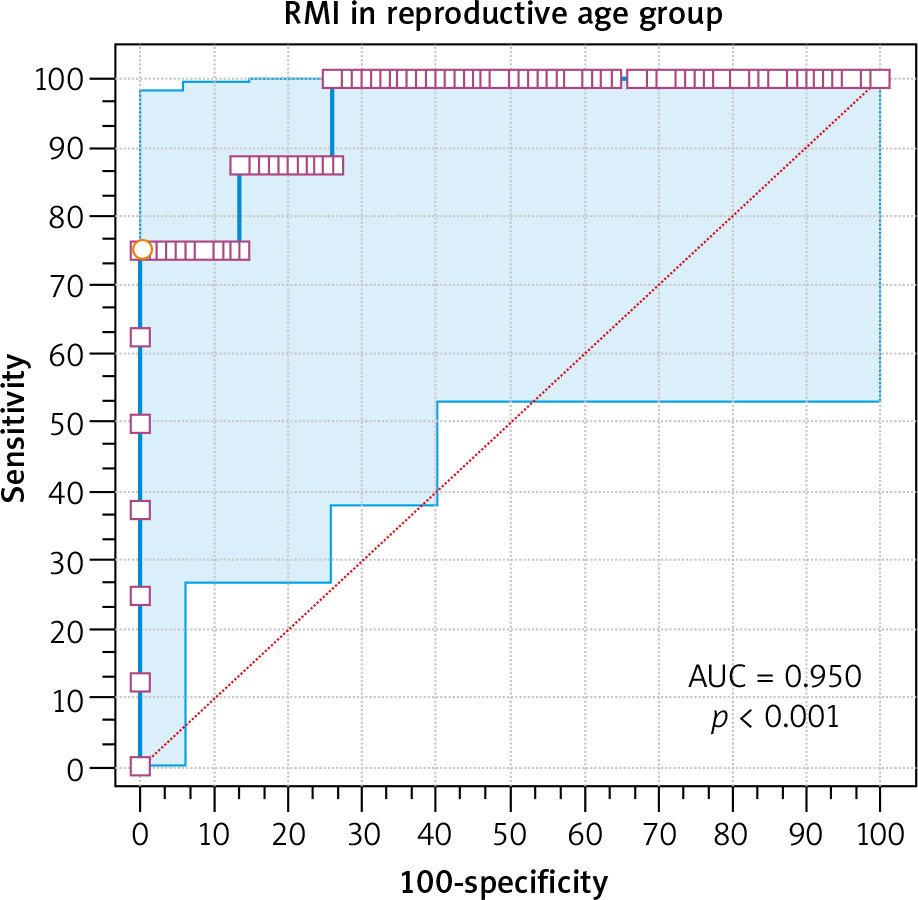
Table 7
Accuracy of the risk of malignancy index at a cut-off value of 200 in diagnosing ovarian malignancy in the 3 studied groups
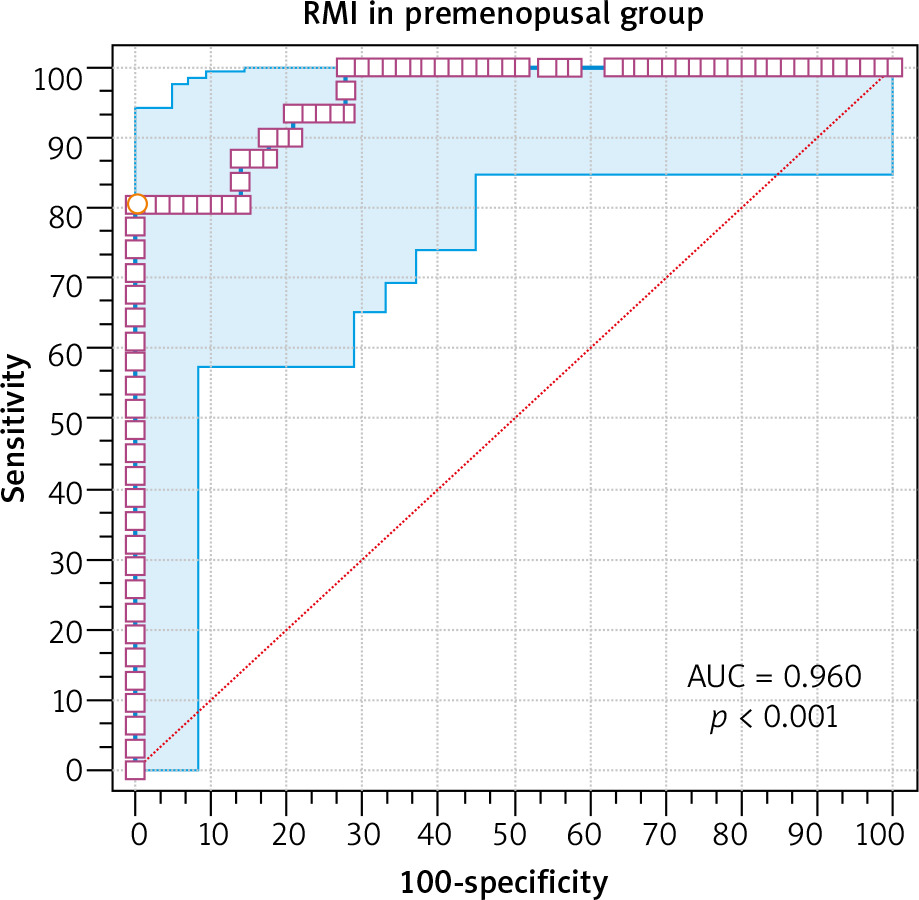
The risk of malignancy index at a cut-off value of 200 had 80.6% sensitivity, 91.2% specificity, 83.3% PPV, and 89.7% NPV in diagnosing ovarian malignancy in the premenopausal group (Table 7). The ROC showed that RMI at a cut-off value > 247.5 had 80.65% sensitivity, 100% specificity, 100% PPV, and 97.9% NPV in diagnosing ovarian malignancy in the premenopausal group (AUC 0.96, 95% CI: 0.89–0.99, p < 0.001) (Fig. 3).
Fig. 3
The receiver operating characteristic curve for risk malignancy index at a cutoff value > 247.5 in the premenopausal group
RMI – risk malignancy index
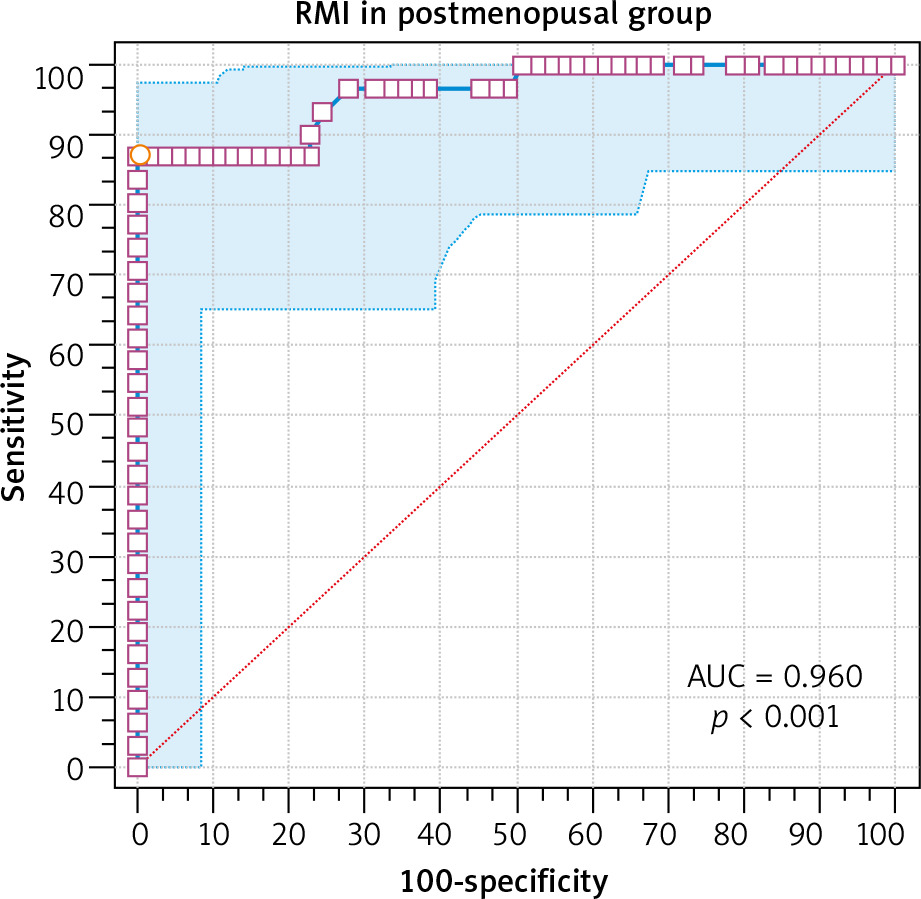
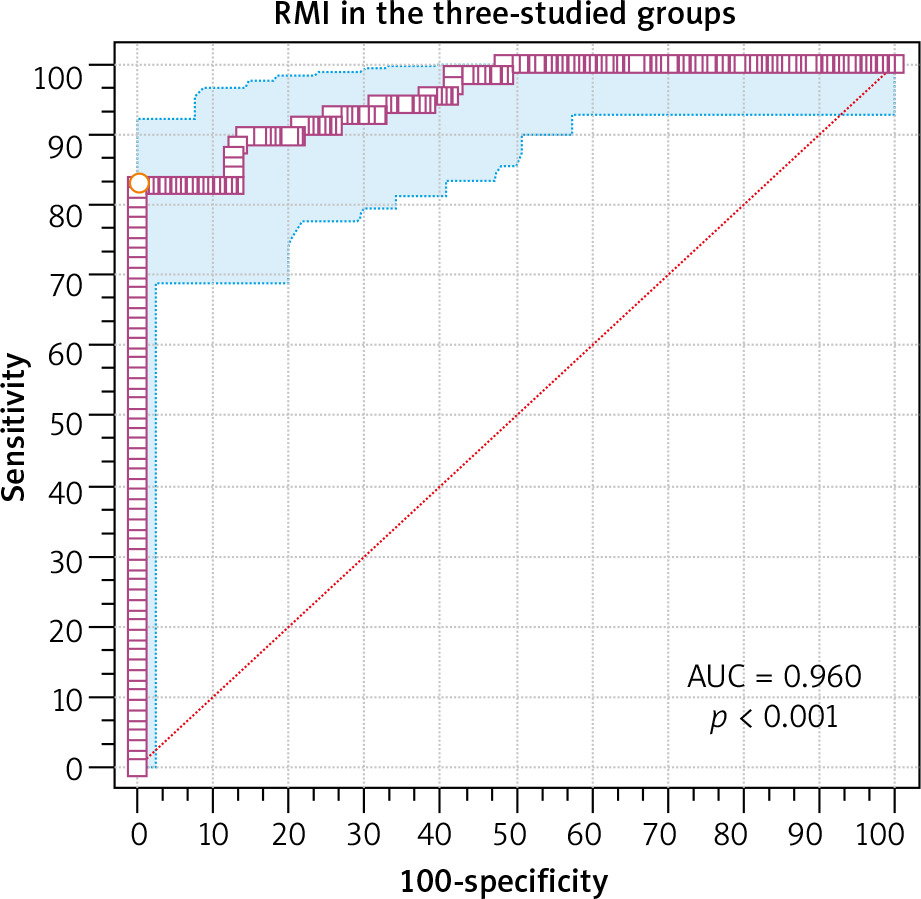
The risk of malignancy index at a cut-off value of 200 had 87.1% sensitivity, 89.5% specificity, 81.8% PPV, and 92.7% NPV in diagnosing ovarian malignancy in the postmenopausal group (Table 7). The ROC showed that RMI at a cut-off value > 245.7 had 87.1% sensitivity, 100% specificity, 100% PPV, and 98.6% NPV in diagnosing ovarian malignancy in the postmenopausal group (AUC 0.960, 95% CI: 0.89–0.99, p < 0.001) (Fig. 4).
Fig. 4
The receiver operating characteristic curve for risk malignancy index at a cutoff value > 245.7 in the postmenopausal group
RMI – risk malignancy index
The risk of malignancy index at a cut-off value of 200 had 82.9% sensitivity, 93.8% specificity, 82.9% PPV, and 93.8% NPV in diagnosing ovarian malignancy in the 3 studied groups (Table 7). The ROC showed that RMI at a cut-off value > 247.5 had 82.9% sensitivity, 100% specificity, 100% PPV, and 98.1% NPV in diagnosing ovarian malignancy in the 3 studied groups (AUC 0.96, 95% CI: 0.92–0.97, p < 0.001) (Fig. 5).
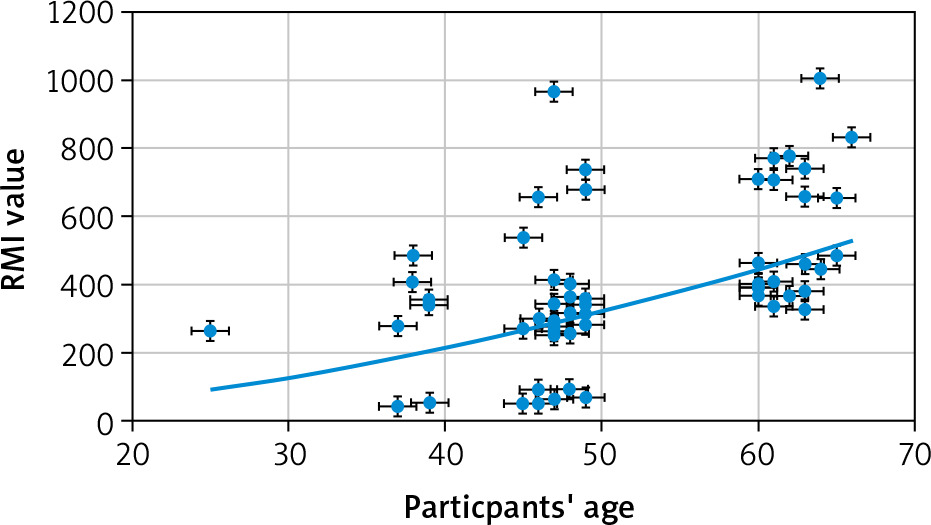
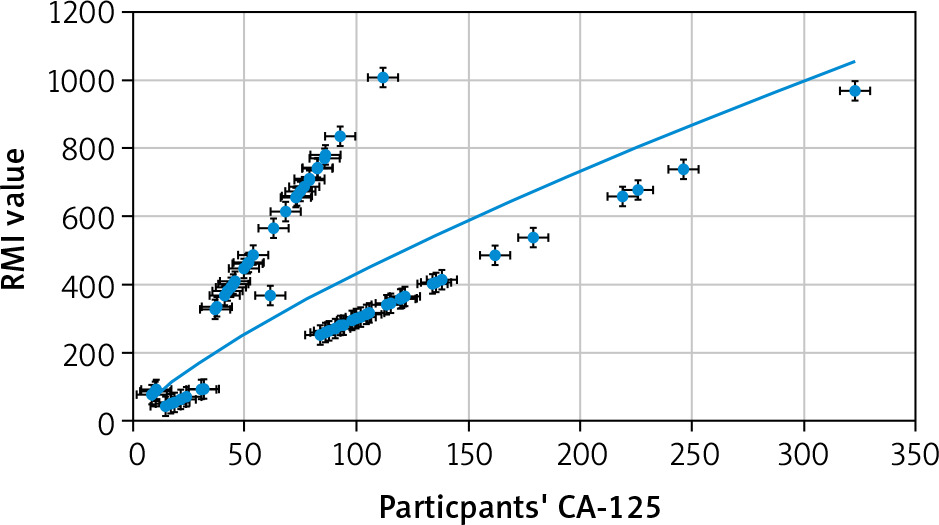
The correlation between participants’ variables and the risk of malignancy index in the ovarian malignancy group
A significant positive correlation between participants’ age and RMI (r = 0.38, p = 0.001, 95% CI: 016–0.57) (Fig. 6), and between participants’ CA-125 and RMI (r = 0.55, p < 0.0001, 95% CI: 0.37–0.70) was detected (Fig. 7). There was no significant correlation between participants’ weight and RMI (r = –0.058, p = 0.6), participants’ BMI and RMI (r = 0.012, p = 0.9), participants’ parity and RMI (r = 0.117, p = 0.3), or ultrasound score and RMI (r = 0.16, p = 0.1). Only one participant in the ovarian malignancy group had an ultrasound score of 1 (multi-locular), while 69 had an ultrasound score of 3 (43 multi-locular with solid nodules and ascites, 22 multi-locular with solid nodules, and 4 multi-locular with ascites).
Discussion
Multimodal screening combines various diagnostic parameters to improve the accuracy of diagnosing ovarian malignancy [18]. The risk of malignancy index was introduced as RMI-1 by Jacobs et al. in 1990 as a product of the CA-125 absolute value (IU/ml), menopausal status (M), and ultrasound findings (U) [10]. The original RMI-1 was modified in 1996 by Tingulstad et al. to RMI-2 [19] and again to RMI-3 [20]. The new indices have different scoring points for the ultrasound findings and menopausal status [19–20]. The preoperative discrimination between benign and malignant adnexal masses is important to decide further management [2]. Therefore, 264 women in 3 groups: reproductive, premenopausal, and postmenopausal (88 participants in each group), were included in this study to detect the morphological parameters of ovarian masses in the 3 studied groups (especially the reproductive group), and to assess the accuracy of RMI in diagnosing ovarian malignancy.
The incidence of malignant and benign ovarian tumours in the reproductive group was 9.1% (8/88) and 90.9% (80/88), respectively. Nowak et al. found that the incidence of malignant and benign ovarian tumours in reproductive age was 4.6% and 93.1%, respectively [21]. Nowak et al. also found that the reproductive age ovarian tumours were mainly benign, and only a few cases were malignant [21]. Mythily et al. found that 94.3% of ovarian tumours diagnosed at reproductive age were benign [14].
However, Nowak et al. found that 31.1% of the reproductive benign ovarian tumours were endometrioid cysts, 28.9% were teratomas, 19.3% were serous cysts, 3.7% were mucinous, and 17% were others (haemorrhagic, functional, or inflammatory) [21]. This study found that serous ovarian cysts were the commonest benign ovarian tumours in reproductive age (38.75%), followed by functional follicular cysts (21.25%), dermoid cysts (16.25%), cystadenomas (13.75%), thecal lutein (5%), and endometriotic (5%) cysts.
Dora et al. found that the most common benign ovarian tumours were mucinous cystadenoma and dermoid cysts (11.9% and 10.32%, respectively) [1]. Al-Asadi et al. reported dermoid cysts in 28.8%, functional corpus luteum in 26.2%, and simple cysts in 20% of benign ovarian tumours [7]. The difference between this study and other studies regarding the incidence of different benign ovarian tumours can be explained by the exclusion criteria and participants’ age [16, 17].
The incidence of endometriotic cysts was significantly higher in the reproductive group [5% (4/80)] compared to the postmenopausal group [0% (0/57)], (p = 0.03).
Endometriosis is a disease of adolescents and reproductive-age women, commonly occurring in the ovaries (chocolate cyst), and associated with pelvic pain and infertility [16, 17].
The parity of the reproductive group was significantly lower in the malignant ovarian tumours compared to benign tumours (p = 0.006). A retrospective study concluded that women who give birth have significantly reduced risk of all subtypes of ovarian cancer [22]. Mythily et al. found that most ovarian tumours (78.3%) in multiparous women were benign and concluded that infertility increases the risk of ovarian malignancy [14]. In addition, Tung et al. found that ovulation-supressing agents and pregnancy were inversely associated with increased risk of all histological subtypes of ovarian malignancy [23].
The incidence of malignant and benign ovarian tumours was 35.2% (31/88) and 64.8% (57/88), respectively, in the premenopausal and postmenopausal groups. The commonest benign ovarian tumour reported in the studied premenopausal and postmenopausal groups was cystadenoma (31.6% and 29.8%, respectively). Cystadenomas are common benign ovarian tumours with excellent prognosis. The serous and mucinous cystadenomas are the commonest types of ovarian cystadenomas [24, 25]. The serous ovarian cystadenoma commonly occurs at a mean age of 40–60 years [24], while the mucinous ovarian cystadenoma commonly occurs during the 3rd to 6th decades [25].
The incidence of ovarian fibroma was significantly higher in the premenopausal and postmenopausal studied groups (5.3%) compared to the reproductive group (0%) (p = 0.01). In addition, the incidence of ovarian fibrothecoma and thecoma was significantly higher in the postmenopausal group (8.8% and 3.5%, respectively) compared to the reproductive group (0% and 0%, respectively) (p = 0.002 and p = 0.04, respectively). Ovarian fibromas generally occur in perimenopausal and postmenopausal women [26]. Similarly, Dai et al. reported high incidence of ovarian fibromas and thecomas in postmenopausal women [27].
Ovarian cystadenocarcinomas were the commonest malignant ovarian tumours in the premenopausal studied group (32.2%), followed by squamous carcinomas (25.8%) and endometrioid carcinomas (22.6%). Squamous carcinomas were the commonest malignant ovarian tumours in the postmenopausal studied group (35.5%), followed by cystadenocarcinomas (32.2%) and endometrioid carcinomas (16.1%).
In this study, the incidence of cystadenocarcinomas was significantly higher in the premenopausal and postmenopausal groups (32.2%) than in the reproductive group (0%), (p = 0.04).
Al-Asadi et al. found that more than half of ovarian cancers (52.4%) were cystadenocarcinomas (mucinous and/or serous) [7]. Mythily et al. found that 60% (14/23) of their studied malignant tumours were cystadenocarcinomas (6 papillary serous, 5 serous, and 3 mucinous) [14].
Aktürk et al. reported 18 cystadenocarcinomas (10 mucinous and 8 serous) out of 20 malignant ovarian tumours (90%) [4]. Dora et al. also reported 32 cases of serous cystadenocarcinomas (25.39%) and 15 cases of mucinous cystadenocarcinomas (11.9%) out of 126 cases of suspected ovarian masses [1].
The incidence of studied malignant ovarian tumours was significantly higher in the premenopausal and postmenopausal groups (35.2%) than in the reproductive group (9.1%) (p = 0.0008). Similarly, Mythily et al. found that 66.7% of malignant ovarian tumours were diagnosed at the age of 51–60 years, and 88.8% of malignant ovarian tumours were diagnosed in postmenopausal women [14]. Jung et al. found that malignant epithelial and sex cord stromal ovarian tumours frequently occur in postmenopausal women [28].
The body mass index of studied postmenopausal group was significantly higher in malignant ovarian tumours compared to benign tumours (p = 0.03). A meta-analysis showed increased risk of ovarian cancers in postmenopausal women with a 5 kg weight gain [29]. Obesity is also associated with increased risk of endometrioid and mucinous ovarian cancers [30], and obese women with low- or high-grade serous carcinoma had poor outcome compared to non-obese controls [31]. Another meta-analysis found that regular physical activity was associated with decreased risk of ovarian cancers by 30–60% [32].
Accuracy of the risk of malignancy index
Jacobs et al. reported 85.4% sensitivity and 96.9% specificity for the RMI at a cut-off value of 200 in diagnosing ovarian malignancy [10]. Subsequently, several studies reported increased diagnostic accuracy of RMI at a cut-off value of 200 [33–36].
Therefore, in this study the accuracy of RMI in diagnosing ovarian malignancy was evaluated in each studied group (reproductive, premenopausal, and postmenopausal) separately and in the 3 studied groups collectively at a cut-off value of 200, and at the best cut-off value according to ROC.
The risk of malignancy index at a cut-off value of 200 had 75% sensitivity, 98.75% specificity, 85.7% PPV, and 97.5% NPV in diagnosing ovarian malignancy in the reproductive group, while the ROC showed that RMI at a cut-off value > 231.6 had the best performance (75% sensitivity, 100% specificity, 100% PPV, and 97.3% NPV) in diagnosing ovarian malignancy in the reproductive group (p < 0.001).
The risk of malignancy index at a cut-off value of 200 had 80.6% sensitivity, 91.2% specificity, 83.3% PPV, and 89.7% NPV in diagnosing ovarian malignancy in the premenopausal group, while the ROC showed that RMI at a cut-off value > 247.5 had the best performance (80.65% sensitivity, 100% specificity, 100% PPV, and 97.9% NPV) in diagnosing ovarian malignancy in the premenopausal group (p < 0.001).
The risk of malignancy index at a cut-off value of 200 had 87.1% sensitivity, 89.5% specificity, 81.8% PPV, and 92.7% NPV in diagnosing ovarian malignancy in the postmenopausal group, while the ROC showed that RMI at a cut-off value > 245.7 had the best performance (87.1% sensitivity, 100% specificity, 100% PPV, and 98.6% NPV) in diagnosing ovarian malignancy in the postmenopausal group (p < 0.001).
The risk of malignancy index at a cut-off value of 200 had 82.9% sensitivity, 93.8% specificity, 82.9% PPV, and 93.8% NPV in diagnosing ovarian malignancy in the 3 studied groups, while the ROC showed that RMI at a cut-off value > 247.5 had the best performance (82.9% sensitivity, 100% specificity, 100% PPV, and 98.1% NPV) in diagnosing ovarian malignancy in the 3 studied groups (p < 0.001).
The difference in the RMI cut-off value in diagnosing ovarian malignancy was explained by Dora et al. and Simsek et al., and it depends on the prevalence of malignancy in the studied population [1, 37]. Similarly, Dora et al. found the best performance of RMI at cut-off value of 236 with 72.5% sensitivity, 98.2% specificity, 98.1% PPV, and 74.4% NPV [1]. Dora et al. found that the RMI at cut-off value ≥ 236 increased the probability of diagnosing ovarian malignancy from 54.8 to 98.15% [1].
Enakpene et al. also found that the RMI at a cut-off value of 250 had 88.2% sensitivity, 74.3% specificity, 71.3% PPV, and 90% NPV in diagnosing invasive ovarian lesions [38]. In addition, Yamamoto et al. reported 75% sensitivity and 91% specificity for the RMI at a cut-off value of 450 [39].
The lower cut-off values increase the RMI sensitivity at the expense of its specificity, while the higher cut-off values increase the RMI specificity at the expense of sensitivity [1]. The ideal RMI to diagnose ovarian malignancy should have a zero or close to zero false negative rate [40] with high sensitivity and specificity at the same time. Therefore, the RMI cut-off value should balance the sensitivity and specificity, and the availability of specialized oncology centres. When specialized oncology centres are not available or referral to such centres is limited because of local resources, the RMI cut-off value can be increased to achieve higher specificity [1].
The correlation analysis in this study showed significant positive correlation between participants’ age and RMI (p = 0.001) in the ovarian malignancy group. Similarly, Mythily et al. found that 66.7% of ovarian malignancies were diagnosed at the age of 51–60 years, and 88.8% of ovarian malignancy were diagnosed in postmenopausal women [14]. Jung et al. also found that malignant epithelial and sex cord stromal ovarian tumours frequently occur in postmenopausal women [28], and Dora et al. found that 81.6% of postmenopausal ovarian masses were malignant [1].
The correlation analysis also showed significant positive correlation between participants’ CA-125 and RMI (p < 0.0001) in the ovarian malignancy group. Cancer antigen-125 is widely accepted as a biomarker for estimating the risk of ovarian cancers. Aktürk et al. found that the CA-125 was significantly higher among malignant tumours compared to benign ovarian tumours [4]. Simsek et al. reported 78.6% sensitivity and 63.5% specificity for CA-125 at a cut-off value 35 IU/ml in diagnosing ovarian malignancy [37].
However, the analysis in this study showed no significant correlation between the ultrasound score and RMI in the ovarian malignancy group (p = 0.1). Only one participant in the studied ovarian malignancy group had an ultrasound score of 1, while 69 had an ultrasound score of 3.
Dora et al. found that an ultrasound score of 3 and the presence of solid nodules and/or ascites were associated with increased risk of ovarian malignancy [1]. Adilgereyeva et al. also found that the presence of ascites and/or solid nodules within the ovarian mass raises the suspicion of malignancy, especially in premenopausal or postmenopausal women [9].
This study found that the incidence of malignant and benign ovarian tumours was 9.1% and 90.9%, respectively, in the reproductive group (serous ovarian cysts were the commonest benign ovarian tumour in the reproductive group). The incidence of malignant and benign ovarian tumours was 35.2% and 64.8%, respectively, in the premenopausal and postmenopausal groups (cystadenomas were the commonest benign ovarian tumour in the premenopausal and postmenopausal groups). The incidence of malignant ovarian tumours and cystadenocarcinoma was significantly higher in the premenopausal and postmenopausal groups than in the reproductive group. The risk of malignancy index at a cut-off value of 200 had 82.9% sensitivity, 93.8% specificity, 82.9% PPV, and 93.8% NPV in diagnosing ovarian malignancy in the 3 studied groups, while the ROC showed that RMI at a cut-off value > 247.5 had the best performance (82.9% sensitivity, 100% specificity, 100% PPV, and 98.1% NPV) in dia-gnosing ovarian malignancy in the 3 studied groups. The correlation analysis showed significant positive correlation between participants’ age and RMI and between participants’ CA-125 and RMI in the ovarian malignancy group.
This study concluded that multimodal RMI is an effective tool for primary evaluation of suspected ovarian masses. The RMI at a cut-off value of 200 had 82.9% sensitivity, 93.8% specificity, 82.9% PPV, and 93.8% NPV in diagnosing ovarian malignancy in the 3 studied groups, while the ROC showed that RMI at a cut-off value > 247.5 had the best performance (82.9% sensitivity, 100% specificity, 100% PPV, and 98.1% NPV) in diagnosing ovarian malignancy in the 3 studied groups. The higher RMI cut-off values increase its specificity, and the ideal RMI cut-off values to diagnose ovarian malignancy should have high sensitivity and specificity at the same time. Therefore, the RMI cut-off value should balance the sensitivity, specificity, local resources, and availability of oncology centres.
The current study was the first prospective comparative multicentre study conducted to detect the morphological parameters of ovarian masses and the accuracy of RMI in diagnosing ovarian malignancy, including a large number of participants (264 women) in 3 groups (reproductive, premenopausal, and postmenopausal) over 3 years.
In this study, the authors were unable to compare the RMI to intra-operative findings and surgical procedures done, because the intra-operative findings and surgical procedures performed were only documented in 40.9% of the reproductive group, 47.7% of the premenopausal group, and 88.6% of the postmenopausal group.
Women who refused to participate, failure to compare the RMI to intra-operative findings and surgical procedures done, and absence of postoperative follow-up were the limitations of this study.
Conclusions
Multimodal RMI is an effective tool for primary evaluation of suspected ovarian masses. The risk of malignancy index at a cut-off value > 247.5 had the best performance (82.9% sensitivity, 100% specificity, 100% PPV, and 98.1% NPV) in diagnosing ovarian malignancy in the 3 studied groups. There was significant positive correlation between participants’ age and RMI, and between participants’ CA-125 and RMI in the studied malignant ovarian tumours. The ideal RMI cut-off values to diagnose ovarian malignancy should balance the sensitivity, specificity, local resources, and availability of oncology centres.