
Introduction
Globally, colorectal cancer (CRC) is the leading cause of cancer-related mortality; however, there are currently insufficient specialized and sensitive tools for the early detection and targeted treatment of CRC [1]. The utilization of high-throughput sequencing technology has proved that the expression of long-chain non-coding RNAs (lncRNAs) in different cancers disrupts several biological processes, either directly or indirectly [2]. LncRNAs are a class of transcripts > 200 nucleotides in length, which modulate gene expression at the posttranscriptional levels. LncRNAs are essential for many biological processes and have an important role in the development of tumors [3].
Bioinformatic analysis of CRC provides a comprehensive understanding of the molecular biology of CRC, contributing to early diagnosis and precise therapy in patients [4]. The availability of microarray and RNA-sequencing technology, along with public databases such as Gene Expression Omnibus (GEO) and The Cancer Genome Atlas (TCGA), facilitates gene expression studies on cancer such as CRC [5]. The carcinogenesis of colon cancer is accompanied by changes in many molecules, including lncRNAs, microRNAs (miRNAs), and mRNAs [6].
A recent study used GEO to retrieve and integrate four different datasets for gene expression to offer a comprehensive understanding of CRC and verify the new biomarkers for prognosis and targeted therapy of CRC [4]. Another study that used data retrieved from TCGA identified differentially expressed genes (DEGs), differentially expressed lncRNAs (DELs), and differentially expressed miRNAs (DEMs) in left and right sides of CRC samples. Additionally, bioinformatics has been a driving force in investigation of the regulatory roles of miRNSs and lncRNAs for example, miR-21 as a miRNA, known for its oncogenic properties [7]. Similarly, lncRNAs such as plasmacytoma variant translocation 1 (PVT-1) which interacts with the MYC oncogene and other downstream molecules, promote tumorigenesis and cancer progression [8]. Moreover, neuroblastoma associated trans-cript 1 (NBAT1) has been shown to inhibit the proliferation and migration of cancer cells through various signaling pathways, including the miR-21/PDCD4/AP-1 axis [9]. Its expression is often aberrant in multiple cancers, and it can limit tumor cell proliferation, invasion, and metastasis [10].
PVT-1, an oncogenic lncRNA, has been linked to poor overall survival, advanced stage, and an increased risk of tumor invasion in a number of cancer types, including CRC. Additionally, chemoresistance to drugs that are frequently used to treat CRC may be related to it. Because of PVT1’s relative resistance to endogenous RNases, it may be easier to use as a biomarker [11]. PVT-1 genetic polymorphisms can impact a variety of tumors, such as lymphoma, cancers sensitive to sexual hormones, and gastrointestinal tumors [12]. Evidence has accumulated to demonstrate that in a variety of malignancies, plasmacytoma variant translocation 1 functions as a tumor suppressor and oncogene. A tumor suppressor gene associated with neuroblastoma has been identified as NBAT1. The prognosis of neuroblastoma patients is correlated with NBAT-1 expression, which is low in this disease. NBAT-1 functions by preventing neuroblasts from proliferating, invading, and differentiating [13].
miRNAs are endogenous noncoding RNAs with a length of about 18–24 nt [14] that regulate gene expression via posttranscriptional repression [15]. It is possible that lncRNAs act as miRNA sponges, helping to modify miRNAs on their targets [16]. It has been established that a large number of miRNAs are found in sensitive locations and geno-mic areas related to different types of cancer [17, 18]. This implies that miRNAs are involved in the pathophysiology of malignancies in humans. Tumor suppressor miR-145 is present in a number of malignancies [19]. MiR-145, found on chromosome 5q32, is thought to function as a tumor suppressor in a number of cancers, including CRC [20]. The lncRNA– miRNA–mRNA competing endogenous RNA (ceRNA) network has been suggested to play an important role as the-rapeutic targets or markers for diagnosis and prognosis [21].
The aim of the bioinformatic analyses in this study is to serve as external validation, supporting the hypothesis and novelty of our work. Also, we aimed to provide a comprehensive approach for identifying potential targets such as DEGs, DEMs, and DELs in CRC and their interactions. The ceRNA network was constructed based on in-silico analyses of miRNA–mRNA and lncRNA–miRNA interactions, serving as a potential database platform guiding the detection of potential diagnostic and therapeutic targets in CRC. In addition, we aimed to investigate the impact of single nucleotide polymorphisms in the rs13255292 lncRNA PVT-1 on miR-145 expression levels and the lncRNA-NBAT1/miR-21 axis in the progression of CRC, as well as their potential use as non-invasive diagnostic markers for the prediction and progression of the disease.
Material and methods
The current case-control study enrolled 250 subjects. Eighty-five subjects who were chosen to match the subject population’s age and sex made up the healthy control group. The study’s inclusion criteria comprised colonoscopy results that were negative for cancer, inflammatory bowel disease (IBD), or polyps, and no family or personal history of CRC. Patients with IBD, patients who had received chemotherapy or radiation therapy for CRC in the past, patients who had cancer at another site at the time of selection, and patients with a history of recurrent tumors were excluded from the study. The study group comprised 170 Egyptian adult patients aged 25 to 60 who presented to the Gastrointestinal Endoscopy Unit (Internal Medicine Hospital, Faculty of Medicine, Cairo University). Colonoscopy examination was performed for lower gastrointestinal tract manifestations such as irregular bowel habits, chronic constipation/diarrhea, and bleeding per rectum, in addition to symptoms and signs suggestive for CRC including signi-ficant unexplained weight loss, anemia, and the need for CRC screening. Metastases were confirmed to be adenocarcinomas and were considered to be consistent with CRC. In our investigation, we included 85 patients with CRC and 80 patients with adenomatous polyps (AP) based on pathology results and a positive colonoscopy to confirm the diagnosis. Along with the clinical investigation and standard laboratory tests, such as the complete blood count, erythrocyte sedimentation rate (ESR), stool analysis, carci-noembryonic antigen assay (CEA), and evaluation of liver biomarkers, a comprehensive case history was obtained for each subject. Additionally, a full colonoscopy, which evaluates the stages of CRC using computed tomography and abdominal ultrasonography, as reported by the American Joint Committee on Cancer (2010), was conducted [22].
Every subject participating in this research signed an informed consent form. The study proposal and informed consent were accepted by Cairo University’s Faculty of Medicine Research Ethics Committee (N-310-2023) and adhered to the Helsinki Declaration’s ethical standards. For the purpose of serum separation – which involved detecting all serological markers for CRC – three milliliters of peripheral blood were obtained from each participant by venipuncture in a dry, sterile vacutainer tube. The serum was then stored at –80°C for RNA extraction. Two milliliters of whole blood were also extracted on EDTA in order to genotype the SNP rs13255292 C/T through real-time PCR and extract DNA.
Material and methods
Identification of DEGs, DELs and DEMs
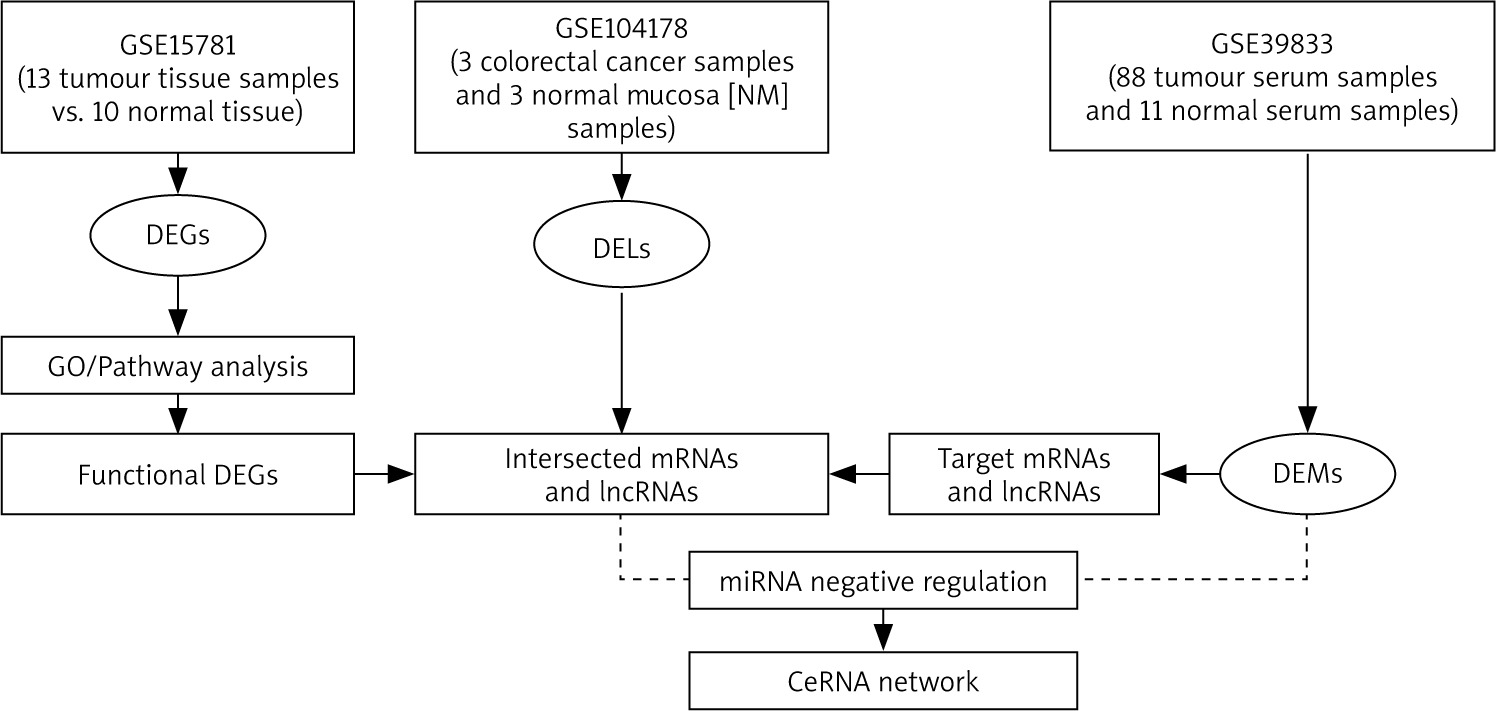
DEGs, DELs and DEMs between colon tumor samples and control samples were retrieved from GEO (https://www.ncbi.nlm.nih.gov/geo/) using GEO2R analysis of the available datasets GSE15781 [23], GSE39833 [24] and GSE104178 [25] respectively. Adjusted p < 0.05 and log fold change (FC) > 1.5 were used as screening criteria to identify DEGs, DELs and DEMs and the non-significant genes, lncRNA and miRNA were excluded. Then, DEGs, DELs and DEMs were categorized into upregulated and downregulated genes, lncRNA and miRNA in CRC samples compared to control samples. Moreover, GEPIA (Gene Expression Profiling Interactive Analysis) [4] was also used to retrieve the expression profile of our key lncRNAs (PVT-1 and NBAT) in CRC compared to the control.
GO and KEGG pathway enrichment analysis of DEGs
The potential functional genes were identified by performing GO enrichment analysis of DEGs according to the GO database that categorizes DEGs on the basis of biological processes [26] using ShinyGO 0.77 [27]. KEGG pathway analysis of DEGs was performed to determine the potential functions of the genes that participated in the pathways based on the KEGG database [28] using ShinyGO 0.77 [27]. GO terms and pathways were classified and the significant genes were identified based on the fold enrichment and FDR < 0.05.
Target genes and lncRNAs prediction of DEMs
The target genes were those identified by KEGG pathway enrichment analyses and GO gene enrichment ana-lyses. miRWalk (http://mirwalk.umm.uni-heidelberg.de/) was used for miRNA-mRNA target gene prediction [29]. miRcode (http://www.mircode.org/) [30] and lncRNASNP v3 [31] were used to predict target lncRNAs. The ceRNA network was constructed using DEMs that overlapped with mRNA and DELs in both cancer and normal samples.
Construction of the ceRNA network
ceRNAs are transcripts that have the ability to regulate one another at the post-transcriptional level by vying for shared miRNAs [21]. The function of mRNAs is linked with that of non-coding RNAs such as miRNA and lncRNA via ceRNA networks. LncRNA can act as an endogenous “sponge” to regulate the mRNA expression of by sequestering miRNA, based on the ceRNA theory [32], leading to upregulation or downregulation of miRNAs. LncRNAs and mRNAs showing an inverse relationships with miRNAs in the lncRNA-miRNA and miRNA-mRNA interaction pairs were selected for constructing the ceRNA network of lncRNA–miRNA–mRNA [33]. Cytoscape software (Version 3.10.0) was used to construct and visualize the ceRNA network [34]. Figure 1 shows the flow chart that represents the whole process of ceRNA network construction.
RNA extraction and real-time quantitative PCR (qPCR)
RNA was extracted from serum using the miRNeasy extraction kit according to the manufacturer’s provided instructions (Qiagen, Valenica, CA). For determination of the quality of RNA, reverse transcription of miRNAs was done, and real-time quantitative reverse-transcription polymerase chain reaction (qRT-PCR) based quantification of miRNA levels was carried out. The specific primers used in the study were as follows: PVT1; forward 5'-AGA GTACAGACCTATCCACTGC-3', and reverse 5'-TCACCTGCATGAGTGCCACA-3'; and GAPDH forward 5'-ATGCTAACGAGCTAGCACACA-3', and reverse 5'-TGTCATCTTTAA AGCGTCCTT-3'. MiRNA-145; forward 5'-GGCGTCCAGTTTTCCCAG-3', and reverse 5'-CAGTGCTGGGTCCGAGTGA-3', NBAT-1; forward 5'-GGAAAGCCTGTGCTCTTGGA-3', and reverse: 5'-TCACAGTGCTGCTCAATCGT-3', MiRNA-21; forward 5'-GCCCGCTAGCTTATCAGACTGATG-3', and reverse 5'-CAGTGCAGGGTCCGAGGT-3'.
DNA extraction and genotyping
A Qia-amplification DNA extraction kit (Qiagen, USA) was used to extract DNA from whole blood. Following that, DNA samples were quantified and tested for purity using NanoDrop. Real-time polymerase chain reaction with the TaqMan allelic discrimination assay was used to genotype a PVT-related SNP (rs13255292(C/T).
Statistical analysis
Data presentation included: mean ± SEM, mean (95% confidence interval, CI) or number (percentage) when appropriate. The χ2 or Fisher’s exact test was used to compare the categorical data. Continuous variables were compared applying Student’s t-test or one-way ANOVA, followed by a post-hoc (Tukey’s) test. Diagnostic accuracy of non-coding RNAs was assessed using ROC analysis and determining the area under the curve (AUC). AUC < 0.6 was considered non-discriminatory, 0.7–0.89 was considered a possible discriminator, and AUC > 0.9 was considered a significant discriminator. GraphPad Prism-5.0 (GraphPad Software, CA) was used to carry out all the statistical tests.
Results
Available datasets of CRC
DEGs, DEMs and DELs were retrieved from GEO using the available datasets such as GSE15781 [23], GSE39833 [24] and GSE104178 [25], respectively. However, there were other different datasets on CRC such as GSE134834, which was excluded due to presence of negative expression values, and GSE115513, as it yielded almost no significant results of miRNA between colon cancer samples and control samples. The GSE15781 dataset was used to retrieve the DEGs and it was based on the array platforms of ABI Human Genome Survey Microarray Version 2 containing 13 tumor tissue and 10 control tissue. The GSE39833 dataset was used to retrieve DEMs and it was based on the array platform of Agilent-021827 Human miRNA Microarray G4470C including 88 tumor serum and 11 control serum samples. The GSE104178 dataset was used to retrieve DELs and it was based on the array platform of Illumina HiSeq 2000 (Homo sapiens) containing 3 CRC and 3 normal mucosa (NM) samples.
Identification of DEGs, DELs and DEMs in CRC
DEGs were retrieved from the GSE15781 dataset using GEO2R analysis of 13 tumor tissue samples compared to 10 control tissue samples [23]. A total of 388 differentially expressed mRNAs in tumor tissues were filtered after exclusion of the non-significant mRNA based on adjusted p < 0.05, log fold change (FC) > 1.5, then DEGs were cate-gorized into 142 upregulated and 246 downregulated genes (Supplementary Table S1). DELs were retrieved from the GSE104178 dataset using GEO2R analysis of 3 CRC mucosal tissues compared to 3 control mucosal tissues [25]. Twenty-five differentially expressed lncRNAs in CRC samples were filtered and categorized into 15 upregulated and 9 downregulated lncRNAs (Supplementary Table S2). Moreover, PVT-1 showed no significant up- or downregulation in CRC samples compared to control samples in GEO. However, GEPIA analysis showed that PVT-1 was significantly upregulated in CRC compared to the control (Supplementary Table S3 and Figure S1). In contrast, NBAT1 was slightly downregulated in CRC, but this was not significant (Figure S1). Additionally, lncRNASNP v3 analysis indicated that NBAT1 was downregulated in CRC samples. DEMs were retrieved from the GSE39833 dataset using GEO2R analysis of 88 serum cancer samples compared to 10 control serum samples [24]. One hundred and one differentially expressed miRNAs in tumor serum samples were filtered and categorized into 66 upregulated and 34 downregulated miRNAs (Supplementary Table S4). Interestingly, one of the key miRNAs in our study, miR-21, showed significant upregulation of around 9-fold in CRC samples compared to control samples. However, the expression data of miR-145 were not available in the used datasets. Log fold change (FC) > 1.5 and adjusted p-value > 0.05 were used as the selection criteria that were applied to the analysis output for filtration of the significant genes, lncRNA and miRNA in CRC samples, compared to the control. Then, DEGs, DELs and DEMs were categorized as upregulated or downregulated in CRC samples compared to the control samples.
Supplementary tables link: https://docs.google.com/spreadsheets/d/1Y0P6Gn9BQxvPvkHRrx_Y2VNMlA08d7up/edit?usp=sharing&ouid=107790050781567408516&rtpof=true&sd=true.
GO and KEGG enrichment analysis of DEGs
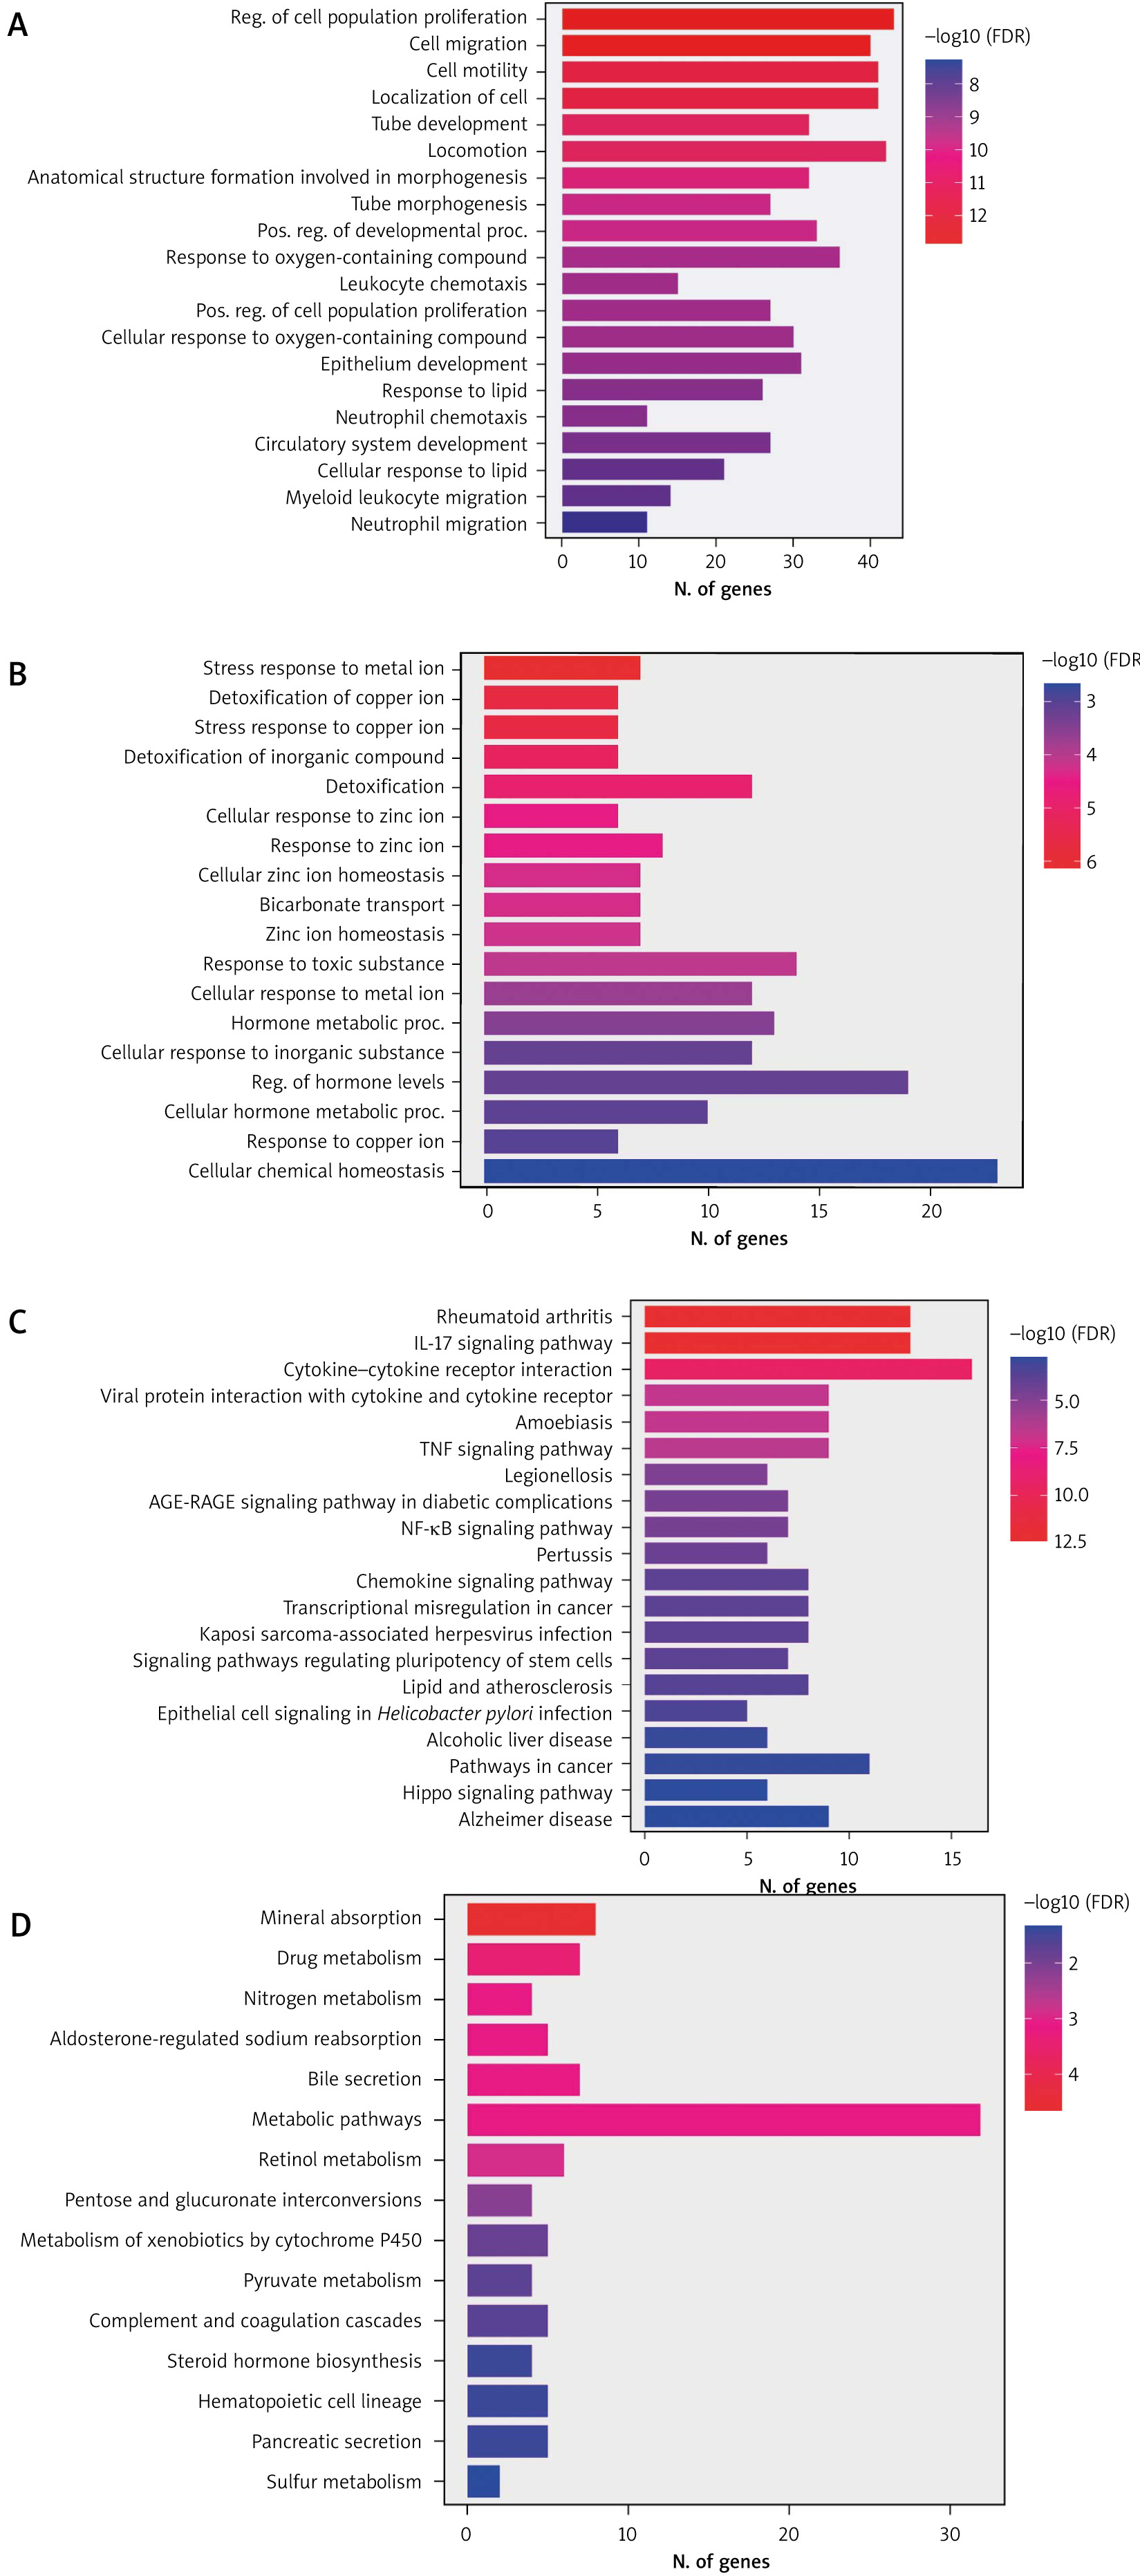
The potential functional genes were identified via GO enrichment analysis and KEGG pathways analysis of 388 DEGs. The upregulated and down-regulated DEGs were analyzed. The highly significant enriched GO terms of up- regulated genes are presented in Figure 2A, including re-gulation of cell population proliferation (GO: 0042127; FDR = 1.4E-13), cell migration (GO: 0016477; FDR = 1.6E-13), and cell motility (GO: 0048870; FDR = 5.8E-13). The most significantly enriched GO terms of down-regulated DEGs are presented in Figure 2B, including stress response to metal ion (GO: 009750; FDR = 6.6E-07), detoxification of copper ion (GO: 0010273; FDR = 2 6.0E-06) and stress response to copper ion (GO: 1990169; FDR = 6.0E-06). Figure 2C represents the highly enriched metabolic pathways of the upregulated genes, including rheumatoid arthritis, IL-17 signaling pathway and cytokine-cytokine receptor interaction, whereas the main pathways of the downregulated genes were mineral absorption, drug metabolism and nitrogen metabolism (Figure 2D). The signi-ficant GO terms and pathways of upregulated and downregulated DEGs are presented in Supplementary Table S5 and S6.
Figure 2
Top enriched differentially expressed genes (DEGs) from the GO and KEGG pathway analyses. A) GO enrichment of up-regulated DEGs. B) GO enrichment of down-regulated DEGs. C) KEGG enrichment of up-regulated DEGs D) KEGG enrichment of down-regulated DEGs. The bar plot shows the enrichment scores of GO and KEGG pathways. Bar color represents different FDR values
Target genes and lncRNAs of DEMs
In this study, 101 DEMs were identified, and the aim was to determine whether these miRNAs would target the 25 DELs and 388 DEGs. Based on the predicted targets of DEMs, 317 miRNA-mRNA interaction pairs (including 18 miRNAs and 160 mRNAs) and 96 lncRNA-miRNA interaction pairs (including 22 miRNAs and 23 lncRNAs) were obtained. Moreover, miRcode and lncRNASNP v3 analysis showed that miR-145 is predicted to be a target of lncRNA PVT-1 (Supplementary Table S7). In addition, lncRNASNP v3 analysis indicated that miR-21 is predicted to be a target of NBAT1 (Supplementary Table S8).
ceRNA network
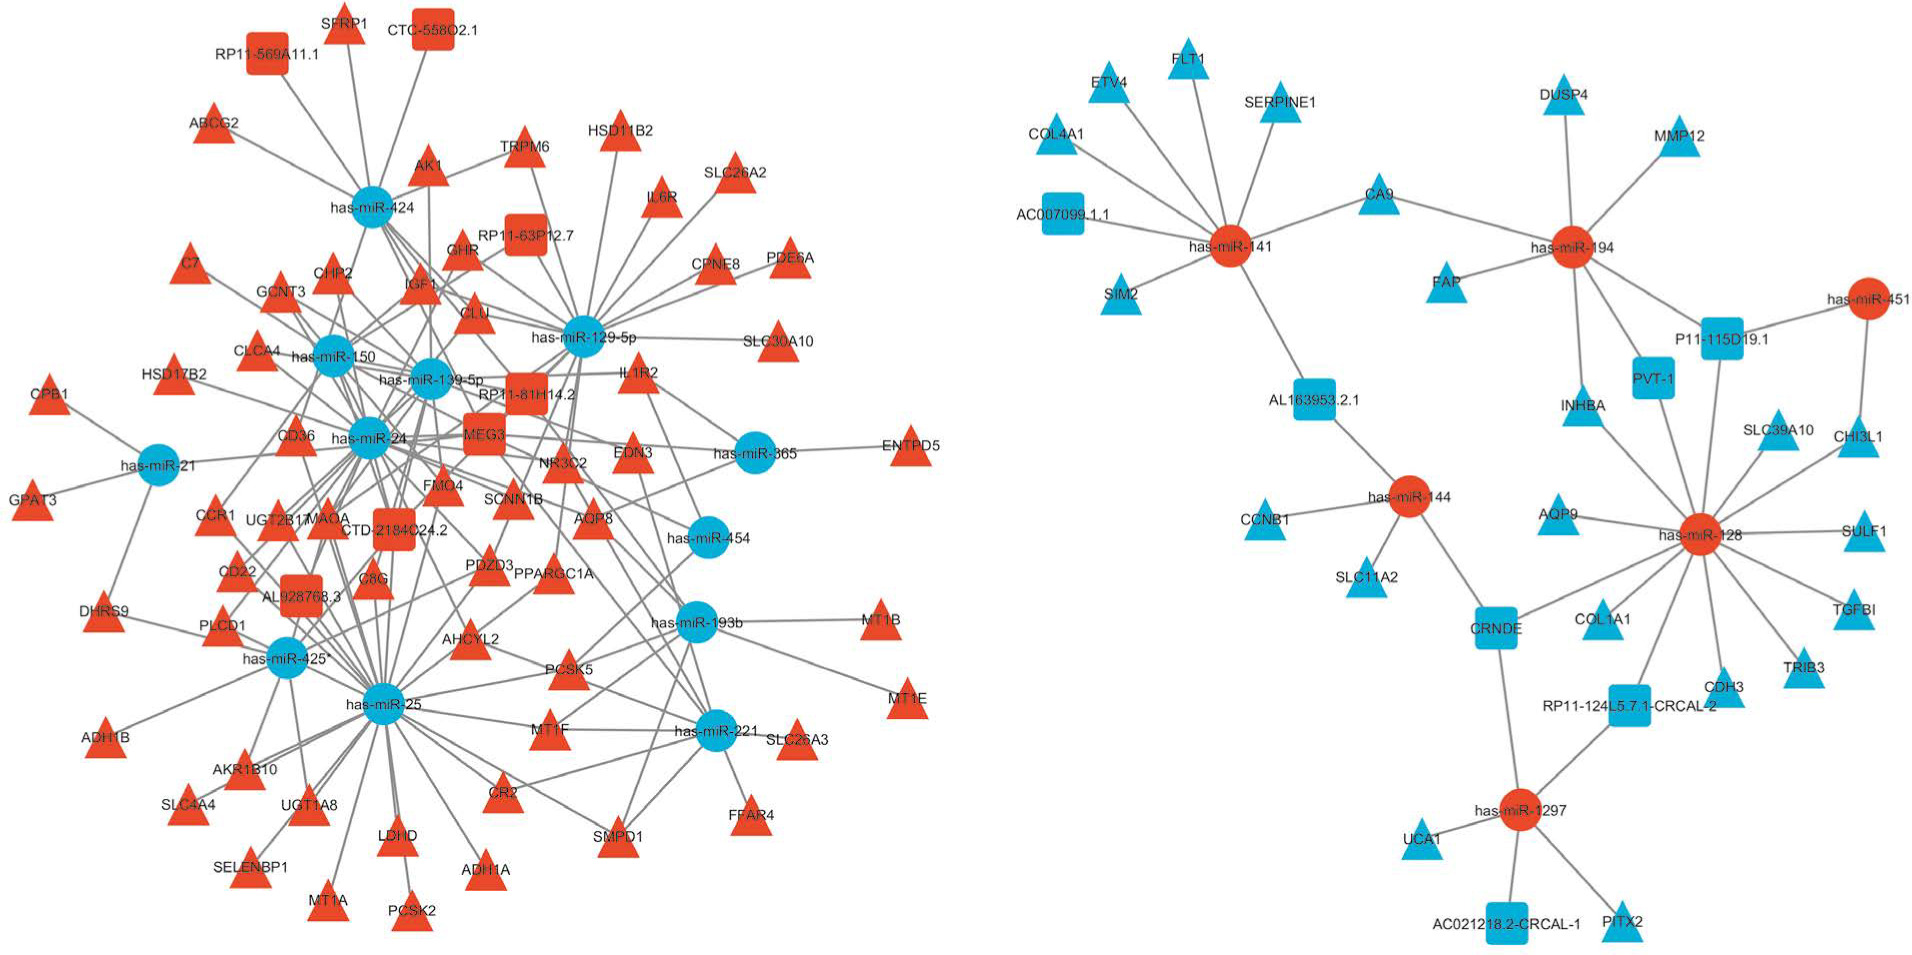
The negative regulators of gene expression are miRNAs, decreasing the stability of target RNAs or limiting their translation [35]. According to the ceRNA theory, the shared miRNAs were used as a junction, the upregulated miRNAs were accompanied by downregulated lncRNAs and mRNAs, whereas the downregulated miRNAs were accompanied by upregulated lncRNAs and mRNAs, to construct the lncRNA–miRNA–mRNA ceRNA network. Finally, the ceRNA network was constructed with 292 interactions, including 15 lncRNAs 18 miRNAs, and 76 mRNAs (Supplementary Table S9). The ceRNA network showed the negative regulation between potential miRNA, lncRNA and mRNA (Figure 3).
Characteristics of the study population
The initial features (clinical, pathological, and demographic) of the 80 AP cases, 85 healthy controls, and 85 CRC cases are displayed in Table 1. Age-wise, there was no significant difference between the AP group and controls, but there was a significant difference between CRC and AP patients (p < 0.0001) with the mean ages of 45. 94 ± 7.82, 39.29 ± 14.21 and 53.36 ± 9.88 years for controls, AP, and CRC cases, respectively. In addition, there was a significant decrease in hemoglobin concentration in CRC patients 9.82 ± 2.03 compared to AP and controls (12.21 ± 1.39 and 13.72 ± 1.57, respectively) and a significant increase in carcinoembryonic antigen (CEA) concentration in CRC patients 44.18 ± 56.77 compared to AP (3.21 ± 1.9) and controls (2.89 ± 1.8).
Table 1
Demographic and laboratory data of the studied groups
[i] Values are expressed as mean ± SEM or number (percentage). P-values in bold are statistically significant (p < 0.05). Groups with different letters are statistically significant. a – significant difference from control group at p < 0.05. b – significant difference from AP group at p < 0.05 AP – adenomatous polyps, CRC – colorectal cancer, CEA – carcinoembryonic antigen, ESR – erythrocyte sedimentation rate, TLC – total leukocyte count
The clinicopathological data of the studied groups showed that the weight loss was the most common symptom in CRC patients (79; 93%), with other common symptoms being abdominal pain (70; 82.5%), constipation (77; 90.5%), and rectal bleeding (27; 31.8%) (Table 2). According to the colonoscopy results, fungating ulcerating masses were present in 71.7% of CRC patients; the remaining percentages (20%) and (8.3%) had malignant rectal ulcers and annular strictures. In terms of the anatomical location, 48.2% of CRC tumors were found in the proximal colon, followed by 34.1% in the distal colon, 11.7% in the rectum, and just 6% in the entire colon.
Table 2
Clinicopathological data of the studied groups
According to the histopathological results, 89.5% of CRC tumors were adenocarcinomas, with moderately differentiated tumors accounting for 75.3% and mucinous tumors for 8.3%. Ultimately, it was discovered that 30.6% of the patients had node metastasis, whereas 8.3% of the cases under study had distant metastasis. All enrolled CRC cases were diagnosed using the AJCC stages, and the results are displayed in Table 3: stage I (14; 16.5%), stage II (45; 53%), stage III (16; 18.8%), and stage IV (10; 11.7%). In the AP group, about half of the cases had more than three variable-sized polyps, while the remaining group had one or two polyps and none of them fit any of the polyposis syndromes.
Table 3
Tumor grade and AJCC stage of the studied groups
Genotypes and allele distribution of lncRNA-PVT-1 gene single nucleotide polymorphism (SNP) rs13255292 (C/T)
The observed genotype distributions of PVT-1 rs13255292 (C/T) SNP agreed with those expected from Hardy-Weinberg equilibrium in all study groups. The results presented in Table 4 indicated that the frequencies of the PVT-1 rs13255292 CT/TT genotype and T allele were significantly higher in CRC patients than controls: 83.5% vs. 33%, χ2 = 22.43, p ≤ 0.0001 and 77.7% vs. 24.1%, χ2 = 37.2, p ≤ 0.0001, respectively. Regarding the association between lncRNA-PVT-1 gene polymorphisms and CRC, as indicated in Table 4, subjects with the CT/TT genotype and T allele were at increased risk for CRC: OR = 5.33, CI = 2.59-10.97, p ≤ 0.01 and OR = 4.24, CI = 2.63-6.83, p ≤ 0.01, respectively, compared with those having the CC genotype and C allele.
Table 4
Differences in allele distribution and genotype frequency of lncRNA-PVT-1 gene single nucleotide polymorphism (SNP) rs13255292 (C/T) between control, adenomatous polyps, and colorectal cancer (CRC)
[i] Results are expressed as number and in parentheses percentage. P < 0.05 is considered statistically significant after adjusting for age, sex, and BMI. Chi-squared (χ2) test was performed to compare categorical data. AP – adenomatous polyps, CRC – colorectal cancer, OR – odds ratio, 95% CI – 95% confidence interval
Serum levels of lncRNA-PVT, miRNA-145, NBAT-1, and miRNA-21
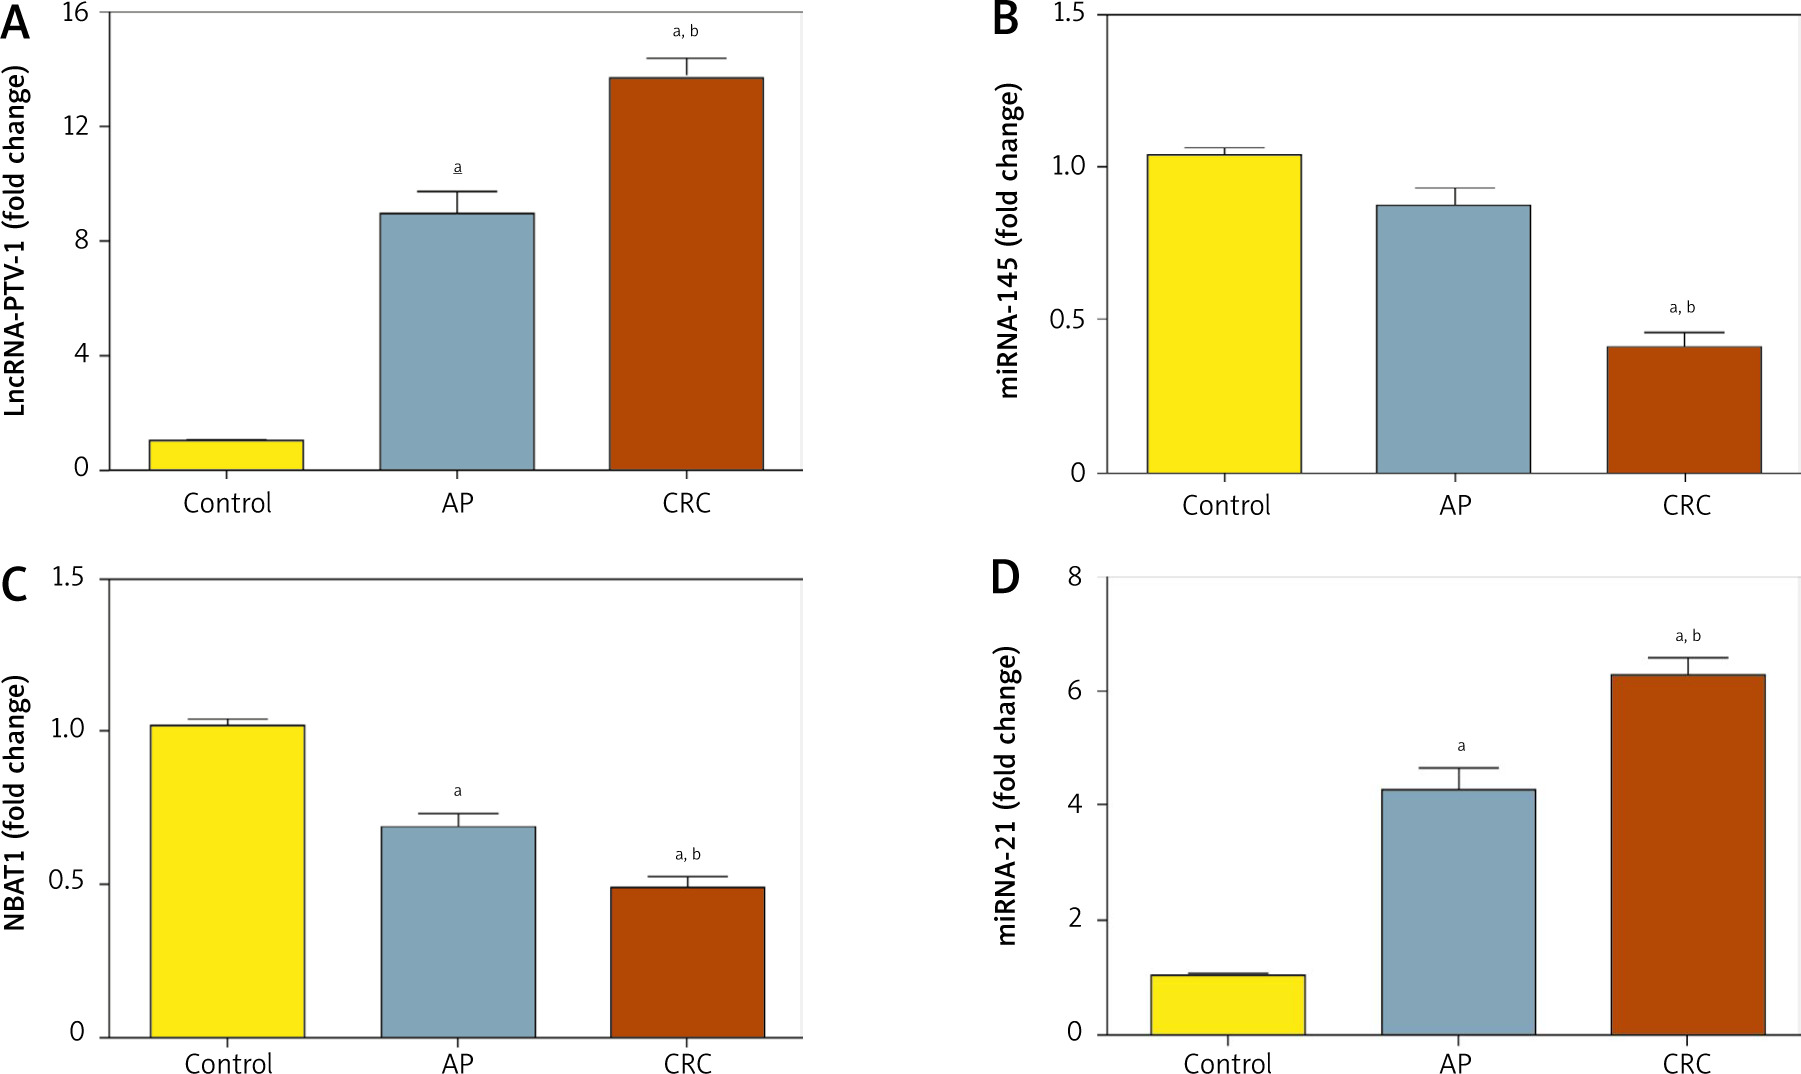
In CRC patients’ serum, lncRNA was upregulated significantly with a mean fold change of 13.6 ± 0.6171 (p < 0.005) as compared to the healthy subjects (Fig. 4A). Also, serum PVT-1 levels of the CRC group were significantly elevated compared to the AP group, with fold change 9.01 ± 0.686 (p < 0.005). In addition, in CRC patients’ serum miRNA-145 was downregulated significantly, with a mean fold change of 0.39 ± 0.0584 (p < 0.005), in comparison with the AP group, with fold change 0.863 ± 0.0645 (p < 0.005), and healthy subjects (Fig. 4B). Moreover, In CRC subjects’ serum NBAT-1 was significantly downregulated, with a mean fold change of 0.49 ± 0.0341 (p < 0.005), compared to the AP group, with fold change of 0.69 ± 0.0507 (p < 0.005), and healthy subjects (Fig. 4C). Moreover, serum miRNA-21 was upregulated significantly in CRC patients, with a mean fold change of 6.24 ± 0.3674, in comparison to AP cases, with a mean fold change of 4.3 ± 0.4126, and healthy controls (Fig. 4D).
Figure 4
PVT-1, miRNA-145, NBAT-1, and miRNA-21 expression levels in serum level in patients with colorectal cancer (CRC) and adeno matous polyps (AP) relative to healthy subjects. A) Fold change in serum expression level of PVT-1. B) Fold change in serum expression miRNA-145 level. C) Fold change of serum expression NBAT-1. D) Fold change of serum expression miRNA-21. Values are expressed as mean ± SEM (95% CI). aSignificant difference from the control group at p < 0.05. bSignificant difference from AP group at p < 0.05
Relation between lncRNA-PVT-1 gene single nucleotide polymorphism (SNP) rs13255292 C/T and serum PVT-1 levels
According to the presence of the T allele in different study groups, serum PVT-1 levels were significantly increased. The serum level of PVT-1 in patients with the CT + TT genotype (n = 71) in the CRC group was significantly higher, with a mean fold change of 15.2 ± 0.72, than in those with the CC genotype (n = 14), with a mean fold change of 9.82 ± 0.58. Likewise, the serum PVT-1 level of CT + TT genotype carriers in the AP group (n = 39) was significantly elevated, with a mean fold change of 11.5 ± 0.51, compared to the CC genotype (n = 41), with a mean fold change of 7.4 ± 0.35. Also, there was no significant diffe-rence between CT + TT genotype carriers and CC genotype carriers in the control group, as shown in Table 5.
Diagnostic performance of serum lncRNA-PVT-1, miRNA-145, lncRNA-NBAT-1, and miRNA-21
ROC analysis showed that serum PVT-1 with AUC = 0.99, 95% CI = 0.985 to 1.001, p < 0.0001, and sensitivity = 100%, specificity = 90.2%, discriminated healthy controls from CRC at a cutoff less than 4.28-fold. Serum PVT-1 distinguished controls from AP patients with AUC = 0.93, 95% CI = 0.897 to 0.981, p = 0.301, with sensitivity = 100%, specificity = 88.7%, at a cutoff < 2.77-fold. In addition, serum PVT-1 discriminated AP from CRC with AUC = 0.691, 95% CI = 0.606 to 0.776, p < 0.0001, with sensitivity = 85.2%, specificity = 65.8%, at a cutoff < 11.39-fold (Fig. 5A).
Figure 5
Diagnostic accuracy of serum PVT-1, miRNA-145, NBAT-1, and miRNA-21. ROC study of PVT-1, miRNA-145, NBAT-1, and miRNA-21 to differentiate the studied types, CRC and AP from controls
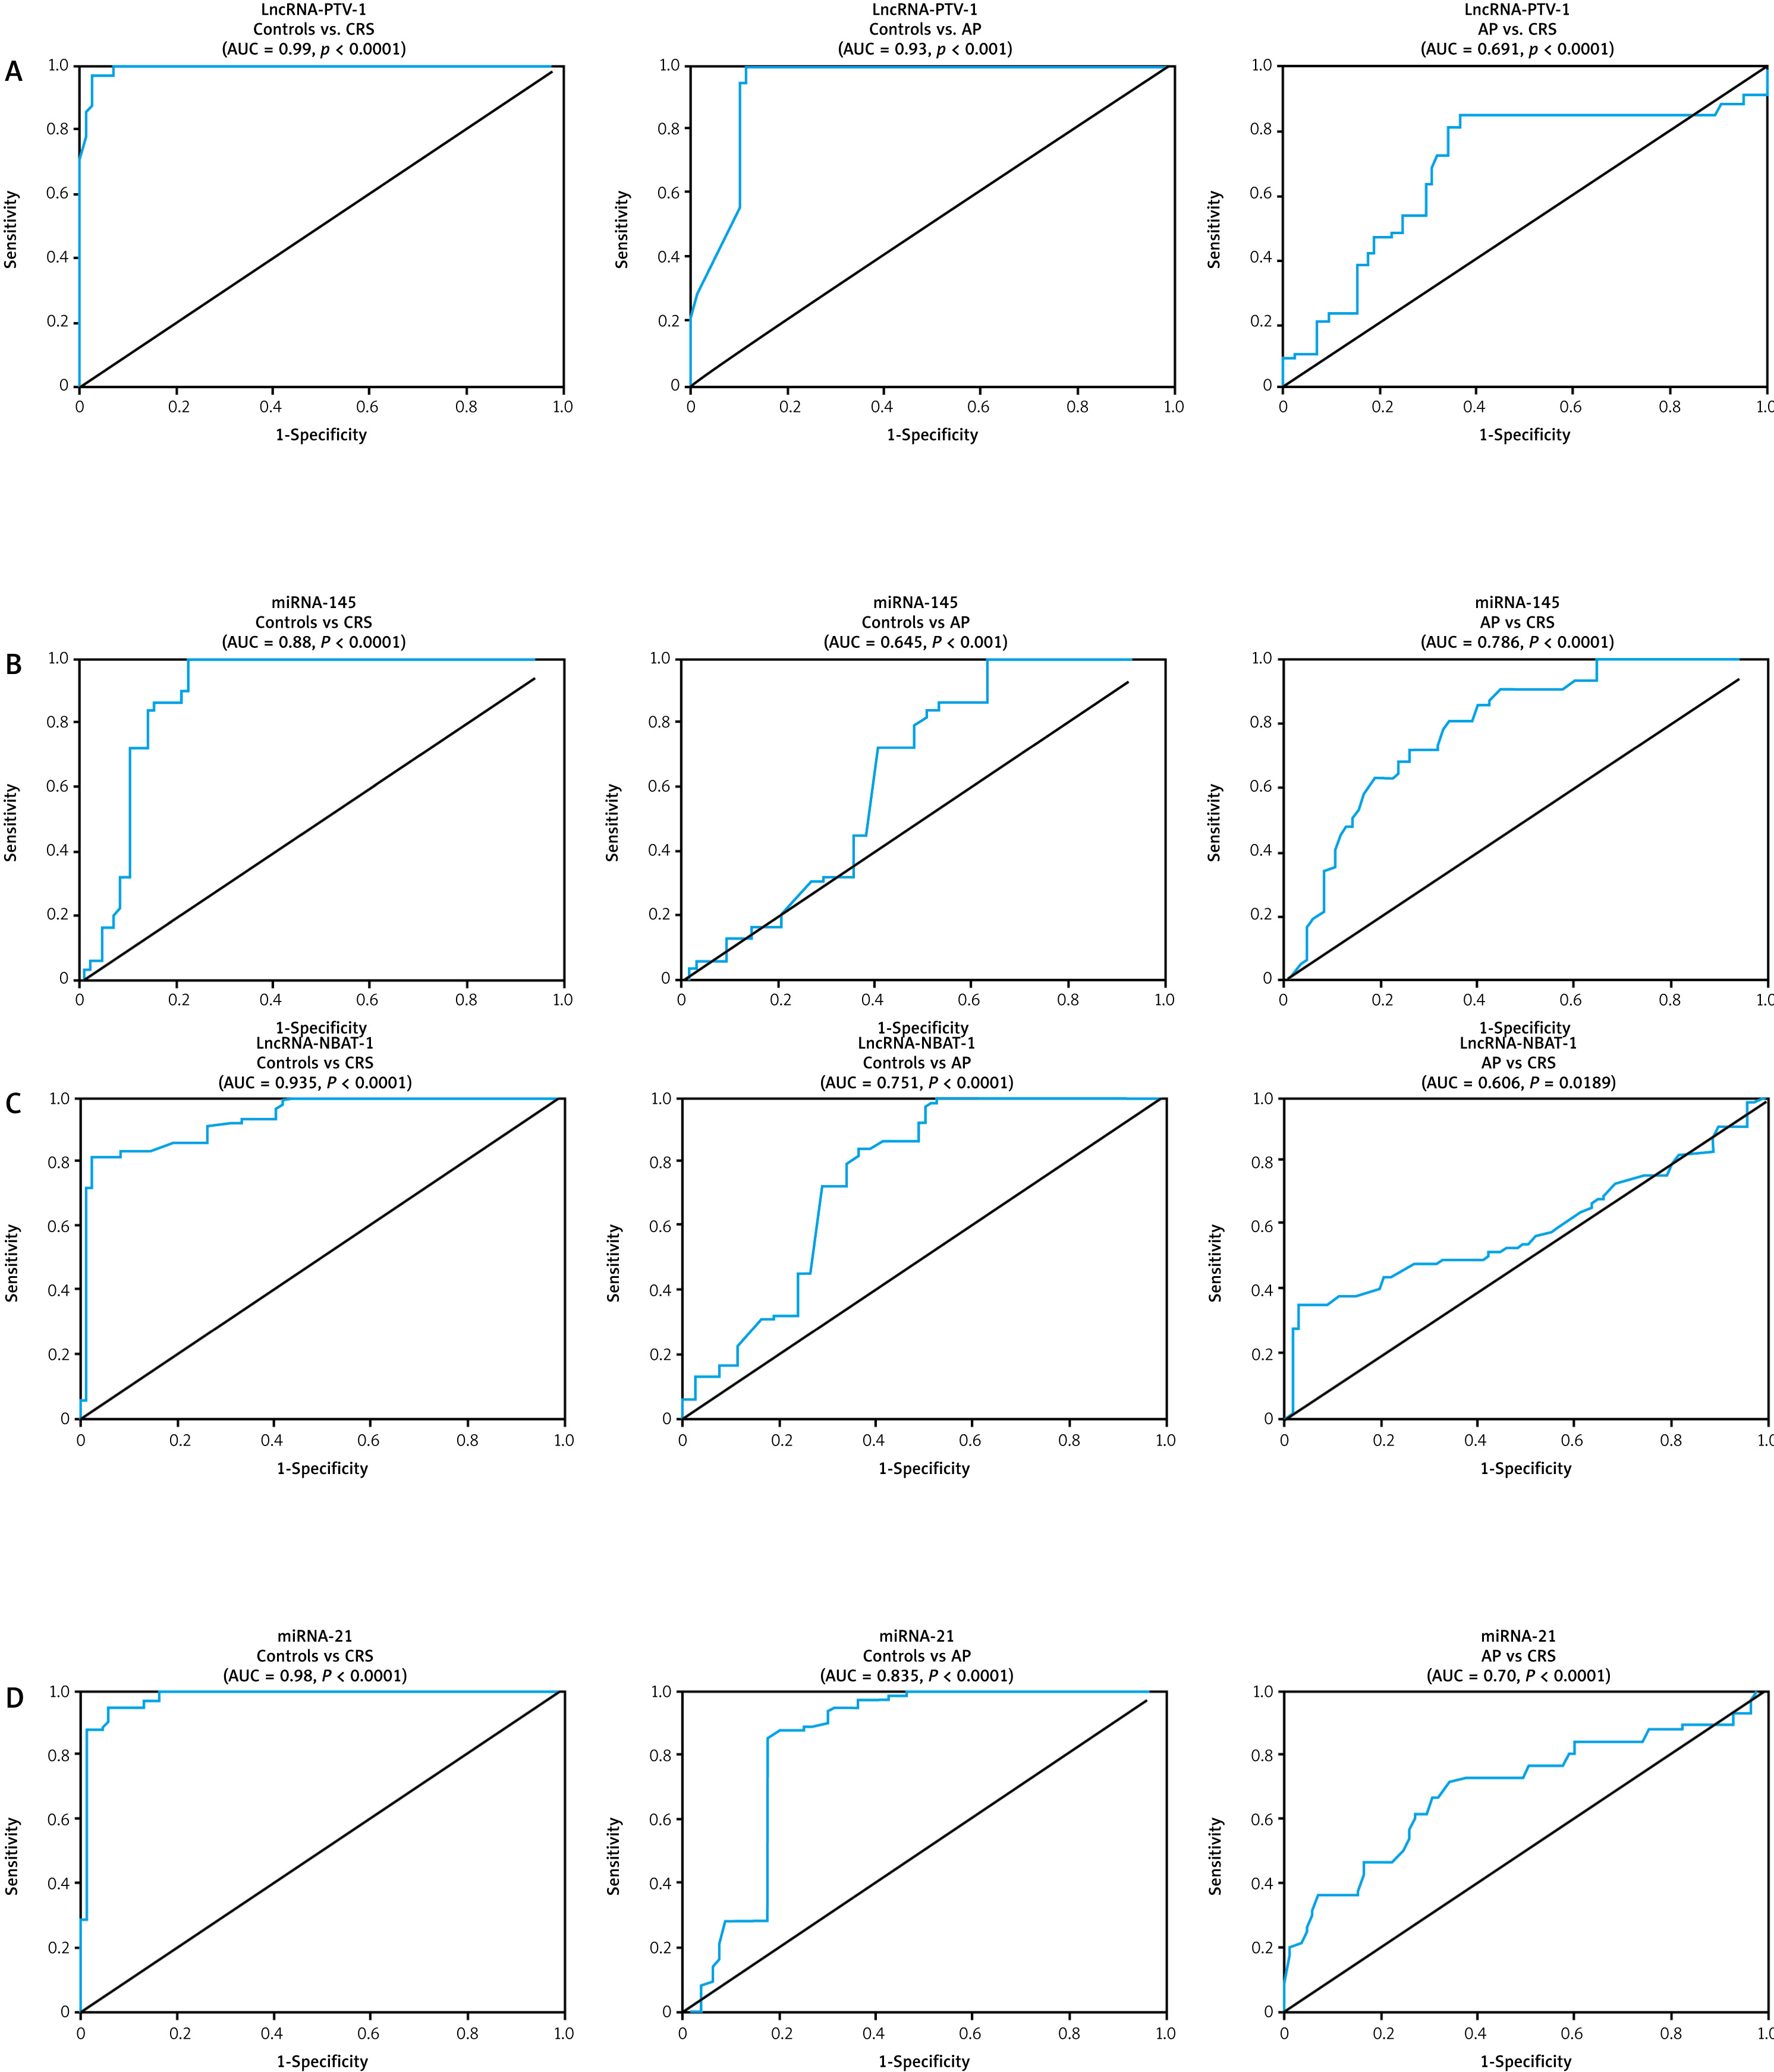
Additionally, ROC analysis showed that serum miRNA-145 distinguished between CRC and healthy controls with an AUC of 0.88, 95% CI of 0.831 to 0.946, p < 0.0001, 100% sensitivity, and 77.8% specificity at a cutoff greater than 0.55-fold. With an AUC = 0.645, 95% CI = 0.557 to 0.733, p = 0.0012, sensitivity = 78.8%, specificity = 52.5%, and a cutoff > 0.87-fold, serum miRNA-145 also distinguished controls from AP patients. Additionally, at a cutoff > 0.35-fold, it was able to distinguish AP from CRC with an AUC of 0.79, 95% CI of 0.717 to 0.856, p < 0.0001, specificity of 65.8%, and sensitivity of 80% (Fig. 5B).
Likewise, ROC analysis showed that serum lncRNA- NBAT-1 distinguished between CRC and healthy controls with an AUC of 0.94, 95% CI of 0.8990 to 0.9718, p < 0.0001, specificity of 74.2%, and sensitivity of 90.1% at a cutoff greater than 0.69-fold. With an AUC of 0.749, 95% CI of 0.672 to 0.828, p < 0.0001, serum lncRNA-NBAT-1 also distinguished controls from AP patients, with sensitivity of 85.3% and specificity of 66.7% at a cutoff > 0.84-fold. Furthermore, at a cutoff > 0.46-fold, it was able to distinguish AP from CRC with an AUC = 0.606, 95% CI = 0.5170 to 0.6954, p = 0.0189, specificity = 65.8%, and sensitivity = 60% (Fig. 5C).
Serum miRNA-21 similarly distinguished healthy controls from CRC with an AUC of 0.98, 95% CI of 0.961 to 0.994, p < 0.0001, specificity of 87.1%, and sensitivity of 96% at a cutoff of less than 2.23-fold, according to ROC analysis. Additionally, serum miRNA-21 distinguished between controls and AP patients with an AUC of 0.834, 95% CI of 0.7648 to 0.9049, p of 0.0578, sensitivity of 87%, specificity of 82.5%, and cutoff of less than 1.37-fold. With an AUC of 0.70, 95% CI of 0.609 to 0.774, p < 0.0001, specificity of 65.8% and sensitivity of 72.5%, it also sepa-rated AP from CRC at a cutoff of < 4.85-fold (Fig. 5D).
Discussion
Globally, CRC continues to be a leading cause of death [36]. To improve overall survival, reduce disease-free progression, and lower the risk of recurrence, early diagnosis is essential. Early disease detection is crucial, and biomarkers can be used to forecast how a disease will progress and respond to treatment [37]. Studying and linking the functions of noncoding and coding RNAs via an entire regulatory network has not been extensively discussed. In the current study, bioinformatics analysis was performed to integrate available RNA-sequencing datasets of CRC. In total, 160 DEGs that have potential function, 25 DELs, and 101 DEMs were identified in CRC samples. Further, 317 miRNA-mRNA interactions and 96 lncRNA-miRNA interactions were identified through target gene prediction, and finally, a ceRNA network of lncRNA-miRNA-mRNA was constructed using 18 miRNAs, 15 lncRNAs, and 76 mRNAs.
Our bioinformatic study provided useful clues that supported the hypothesis of the current study, as it showed that PVT-1 and miR-21 were upregulated in CRC samples compared to normal samples and NBAT1 was slightly downregulated. Also, target prediction analysis of PVT-1 showed that has-miR-145 is one of its targets (Supplementary Table S7) and NBAT1 showed interaction with miR-21 (Supplementary Table S8). In line with our study, a pre-vious study showed that the loss of PVT-1 in a CRC cell line inhibited cell proliferation, migration, and invasion [38]. Bioinformatic analyses also showed upregulation of recently identified lncRNAs such as CRCAL-1, CRCAL-2, CRCAL-3, and CRCAL-4. In a previous study, these noncoding RNAs were suggested to serve as potential biomarkers for early detection of CRC due to the early dysregulation of CRCALs in colorectal carcinogenesis [25]. Also, the association of CRCAL-3 and CRCAL-4 with the cell cycle indicated the functional relevance of CRCAL-3 and CRCAL-4 in CRC [15]. Therefore, future studies are recommended to test the effect of the potential target miRNA on these lncRNAs and their involvement in CRC.
Numerous lncRNAs have been shown to express abnormally as different tumors progress [39, 40]. Abundant investigations have looked at miRNA expression patterns in both early and advanced stages of CRC [41]. One of the most common features in a number of cancers, such as melanoma, hepatocellular carcinoma, thyroid cancer, and CRC, is the overexpression of PVT1 [42]. Various studies have revealed that lncRNA PVT1 interacts and stabilizes proliferation-associated nucleolar proteins NOP2 or c-Myc against degradation and negatively modulates miRNA as a competing endogenous RNA or a molecular sponge to promote the progression of tumors [43]. Utilizing cell lines from CRC patients, a number of studies have suggested a possible carcinogenic role for PVT1, with implications for tumor initiation, progression, spread, and survival. PVT1 expression in tumor cells was found to be positively correlated with a poor overall survival rate. Additionally, PVT1 knockdown with siRNA increased apoptosis and decreased the ability of cells to invade new areas [44]. Our results are consistent with the bioinformatic analyses of CRC-transcriptomes, revealing that the PVT1 locus may also broadly impact the expression and function of other key genes within two key CRC-associated signaling pathways – the TGFβ/SMAD and Wnt/β-catenin pathways [45].
Single nucleotide polymorphisms (SNPs) in miRNA and lncRNA genes may influence the prognosis, treatment outcome, and risk of CRC [46]. In diffuse large B cell lymphoma, two independent SNPs of PVT-1, rs13255292 and rs4733601, at 8q24.21, were found [47]. Our findings supported the hypothesis that the SNPs in PVT1 have been linked to an increased risk of cancer [48] through the observation that the frequencies of the T allele and the PVT-1 rs13255292 CT/TT genotype were significantly higher in CRC patients than in controls. Consistently with a previous study, the PVT1 rs2278176 CT/TT genotypes were found to be associated with increased overall survival and progression-free survival compared with the CC genotype [49]. The HaploReg tool was used to identify PVT-1 SNPs as binding sites for multiple proteins associated with the carcinogenesis process, which is in line with previous reports [50]. One of these proteins is Myc, which has been shown to interact and have functional interactions with PVT1. Notably, elevated serum levels of this lncRNA have been linked to malignant characteristics of cancer [51]. Prior research has demonstrated that T allele carriers in PVT1 rs13255292 exhibit a protective effect against the growth and development of CRC; however, another study found that diffuse large B-cell lymphoma was associated with the T allele PVT1 rs13255292. To fully understand the precise function of rs13255292 in various populations, more research is required.
In the current study, CRC patients had significantly higher frequencies of the T allele and the PVT-1 rs13255292 CT/TT genotype than controls. Additionally, compared to subjects with the CC genotype and C allele, those with the CT/TT genotype and T allele had a higher risk of developing CRC. Therefore, we speculate that rs13255292 is a regulatory SNP that modifies PVT-1 expression and contributes to the genetic susceptibility to CRC. The current study’s findings demonstrated that the presence of the T allele in various study groups among various genotype carriers of the PVT-1 gene rs13255292 (CC and CT + TT) was responsible for the significantly higher serum PVT-1 levels. The present study reports that the serum level of PVT-1 was significantly higher in patients with CT +TT genotype carriers in the CRC group than in those with the CC genotype. The CT + TT ge-notype carriers’ serum PVT-1 level was significantly higher in the AP patients than the CC genotype carriers.
Our findings support a prior study’s finding that PVT1 was upregulated in CRC tissue specimens and cell lines and that miR-145-mediated sponging of PVT1 enhanced CRC cell migration and invasion [52]. Specific miRNAs have been identified to play a crucial role in the pathophysiological signaling pathway of different diseases [53]. MiR-145 is considered as a tumor suppressor in numerous malignancies including CRC [20, 54]. According to Jiang et al. [55] miR-145 was downregulated in CRC tissues and cell lines (LS174T and HCT116) [55]. Also, Li et al. [56] observed that by focusing on an ETS-related gene, miR-145 prevented the migration and invasion of CRC cells. We further observed in the current research that miR-145 was downregulated in CRC patients. Furthermore, these results clearly showed that miR-145 was a crucial downstream factor impacting PVT1-induced CRC and consistent with bioinformatics findings in our study. In agreement with the previous study, when compared to adjacent normal tissues, miR-145 was found to be downregulated in CRC specimens with or without lymph node metastases. However, in CRC with lymph node metastasis, miR-145 expression dramatically increased, which was unexpected [57, 58].
Functional lncRNA NBAT1 was initially identified in neuroblastoma. NBAT1 could enable the restriction of neuroblastoma by inhibiting proliferation and invasion of tumor cells [59]. As a diagnostic and prognostic indicator, NBAT-1 is downregulated in breast cancer and renal cell carcinoma, as has been found in previous studies [60]. The current study found significantly lower serum lncRNA-NBAT-1 levels in CRC patients relative to controls. Moreover, previous research findings showed a significant correlation between the size of the tumor and the metastasis of lymph nodes, as well as a lower expression level of lncRNA NBAT-1 in NSCLC tissues compared to tissues adjacent to cancer. In addition to markedly reducing cell cycle progression and proliferation, overexpression of the lncRNA NBAT-1 may also accelerate NSCLC cell apoptosis by downregulating RAC1 [60].
Additionally, luciferase reporter, RIP and RNA pull-down assays verified a direct interaction between NBAT1 and miR-21. Malignant traits were suppressed by NBAT1 in a miR-21-dependent approach [61]. As the specific role of NBAT-1 in CRC has not been reported yet, the results of the present study support the hypothesis that NBAT-1 acts as a sponge for miRNA-21. Our results revealed that miR-21 was significantly overexpressed in CRC patients in comparison to the control group, which suggests that NBAT1 functions as a competitive endogenous factor against miR-21. Downregulation of NBAT-1 in CRC patients is associated with upregulation of oncomiR-21, the most frequently experimental aberrant miRNA in human cancers [62]. According to prior research, overexpression of miR-21 reversed the effect of NBAT1, which upregulates the target genes of miR-21, such as PDCD4, PTEN, and TPM1 [63].
In the present study, PVT-1 and miRNA-21 produced the best diagnostic accuracy (AUC = 99%, 94%, and sensitivity of 100% and 90.1%, respectively) in differentiating CRC patients from control subjects when the ROC curve was constructed to assess its diagnostic capacity. Moreover, LncRNA-NBAT-1 exhibited high diagnostic accuracy (AUC = 94%) and sensitivity (90.1%) in differentiating CRC from healthy controls, and lastly, miRNA-145 demonstrated a promising degree of diagnostic sensitivity (100%) and accuracy (AUC = 88%) in distinguishing CRC patients from control subjects.
LncRNAs and miRNAs can modulate tumor growth, invasion, and metastasis by activating the initiation of oncogenic pathways and constraining the expression of tumor suppressors [64]. The current study elucidates the interface between PVT-1 as lncRNA that can act as miRNA decoys by sequestering miRNA-145 and lncRNAs NBAT-1 that can counteract miRNA-21. Serum PVT-1 expression is significantly overexpressed in CRC patients; in consequence, the expression of miR-145 (tumor suppressor) is downregulated. In addition, serum NBAT-1 expression is significantly downregulated in CRC patients; in consequence, the expression of miR-21 (oncomiR) is upregulated.
Recommendations
Non-coding RNAs (ncRNAs) have emerged as promising therapeutic agents in the fight against CRC. These molecules, which include lncRNAs and miRNAs, play crucial roles in the regulation of gene expression and are involved in various cellular processes such as proliferation, apoptosis, and metastasis. In CRC, dysregulation of ncRNAs has been linked to tumor progression and poor prognosis. Therapeutically, targeting oncogenic ncRNAs such as PVT-1, which acts as a ceRNA to tumor suppressor miRNAs such as miR-145, offers a novel approach to halt tumor growth and spread. Additionally, the NBAT1/miR-21 axis has been identified as a critical pathway in CRC, with NBAT1 functioning as a tumor suppressor by sequestering oncogenic miR-21. By modulating the expression of these ncRNAs, it is possible to restore the balance between oncogenic and tumor-suppressive pathways, thereby inhibiting cancer progression. The development of ncRNA-based therapies, including the use of antisense oligonucleotides, small molecule inhibitors, and ncRNA mimics, holds great potential for enhancing the effectiveness of existing CRC treatments and improving patient outcomes. For example, small interfering RNAs (siRNAs) have already received FDA approval for certain conditions, and miRNA mimics and inhibitors are currently being evaluated in clinical trials. These advancements underscore the potential of ncRNA-based therapies to revolutionize cancer treatment.
Conclusions
Patients with colorectal cancer have a higher chance of survival when the disease is detected and treated effectively at an early stage. Our results pave the way for the potential use of PVT-1, miRNA-145, NBAT-1, and miRNA-21 as prognostic and diagnostic biomarkers in clinical settings. According to this study, there was a significant increase in the frequencies of the T allele and PVT-1 rs13255292 CT/TT genotype in CRC patients compared to controls. Higher serum PVT-1 expression levels are also correlated with the PVT-1 rs13255292 T mutant allele. Bioinformatics analyses allowed effective identification of potential lncRNAs linked with colorectal cancer. Also, it supported the aim of our study by proving the upregulation of PVT-1 (oncogene) and miR-21 (onco-miR) and predicted the targets of the studied lncRNAs. PVT-1/miR-145 and NBAT1/miR-21 are being investigated as potential non-invasive diagnostic biomarkers for CRC.


