
Introduction
Liver cirrhosis is usually caused by alcohol abuse as well as hepatitis B virus (HBV) and hepatitis B virus (HCV) infections. From 4% to 10% of the world population suffers from liver cirrhosis. As the disease progresses, fibrosis, formation of cirrhotic nodules and, in effect, an intensive decrease of the number of functioning hepatocytes significantly restrict the ability of the liver to detoxify and synthesize. Also synthesis and metabolism of proteins, lipids and carbohydrates decrease, with parallel disturbances of mineral and vitamin turnover [1].
In patients with liver cirrhosis, the diet should supply all necessary nutrients and cover the energy demand of the organism. Supply of necessary nutrients should compensate for existing deficiencies. During the time of liver insufficiency, it is necessary to modify the diet, so the metabolism of supplied food is effective and allows for collection of building blocks for our organism. Moreover, metabolism should not increase the risk of synthesis of encephalopathic components. This is especially important in the case of the amount of provided proteins in different stages of liver insufficiency [2].
Ascites is one of the most frequent symptoms of liver failure. Evaluation of the amount of liquid in the abdomen of patients with liver cirrhosis is difficult. This is connected with excess liquid in the extravascular space, with concomitant possible liquid deficiency in the vascular space. However, it is important to try to determine the volume of extravascular liquid, because the result of such estimations would influence the dosing of diuretics. Overdose of these drugs, leading to dehydration, is the main cause of hepatorenal syndrome development [3].
Aim of the study
The study aimed to evaluate the nutritional status of patients with liver cirrhosis in relation to liver injury. Fatty body mass, lean body mass, fluid content and basal metabolic rate were established in patients. Moreover, basal energy demand was determined in individual groups of patients.
Material and methods
The study included 56 patients (16 women and 40 men) with liver cirrhosis. Average age of the patients was 54 ±12 years (28-77 years).
In 19 patients, liver cirrhosis was caused by alcohol abuse, in 18 patients by HBV infection, and in 19 by HCV infection.
Depending on the stage of liver injury, patients were divided into 3 groups (A, B and C), according to Child-Pugh classes.
Nutritional status was estimated with the body mass index (BMI), malnutrition in both sexes was defined as BMI < 18.5 kg/m2 and overweight as BMI > 25.0 kg/m2.On top of that, nutritional status was determined in relation to albumin serum concentration, according to assumptions by De Chicco et al. Malnutrition was defined as mild when the albumin serum concentration was 3.4-3.0 g/dl, intermediate when 2.9-2.1 g/dl, and serious when < 2.1 g/dl [4].
Fatty body mass, lean body mass, fluid content and basal metabolic rate were estimated by bioelectrical impedance, using a MALTRON 907 analyzer. The MALTRON 907 analyzer gives us the opportunity to obtain information on fat content, resting metabolism, water content, and lean body mass. It also allows one to estimate daily and weekly energy expenditure. The analysis is non-invasive.
Results
Malnutrition evaluated by the BMI was diagnosed in 7% of studied patients, and overweight in 41% of patients.
By analyzing albumin concentration, malnutrition was found in 84% (47/56) of patients. Intermediate malnutrition was diagnosed most often, in 45% of patients (Table 1).
Table 1
Evaluation of nutritional status based on albumin concentration
Malnutrition diagnosed with albumin concentration was found most frequently in group C, more often in men (61% vs. 39%) than in women.
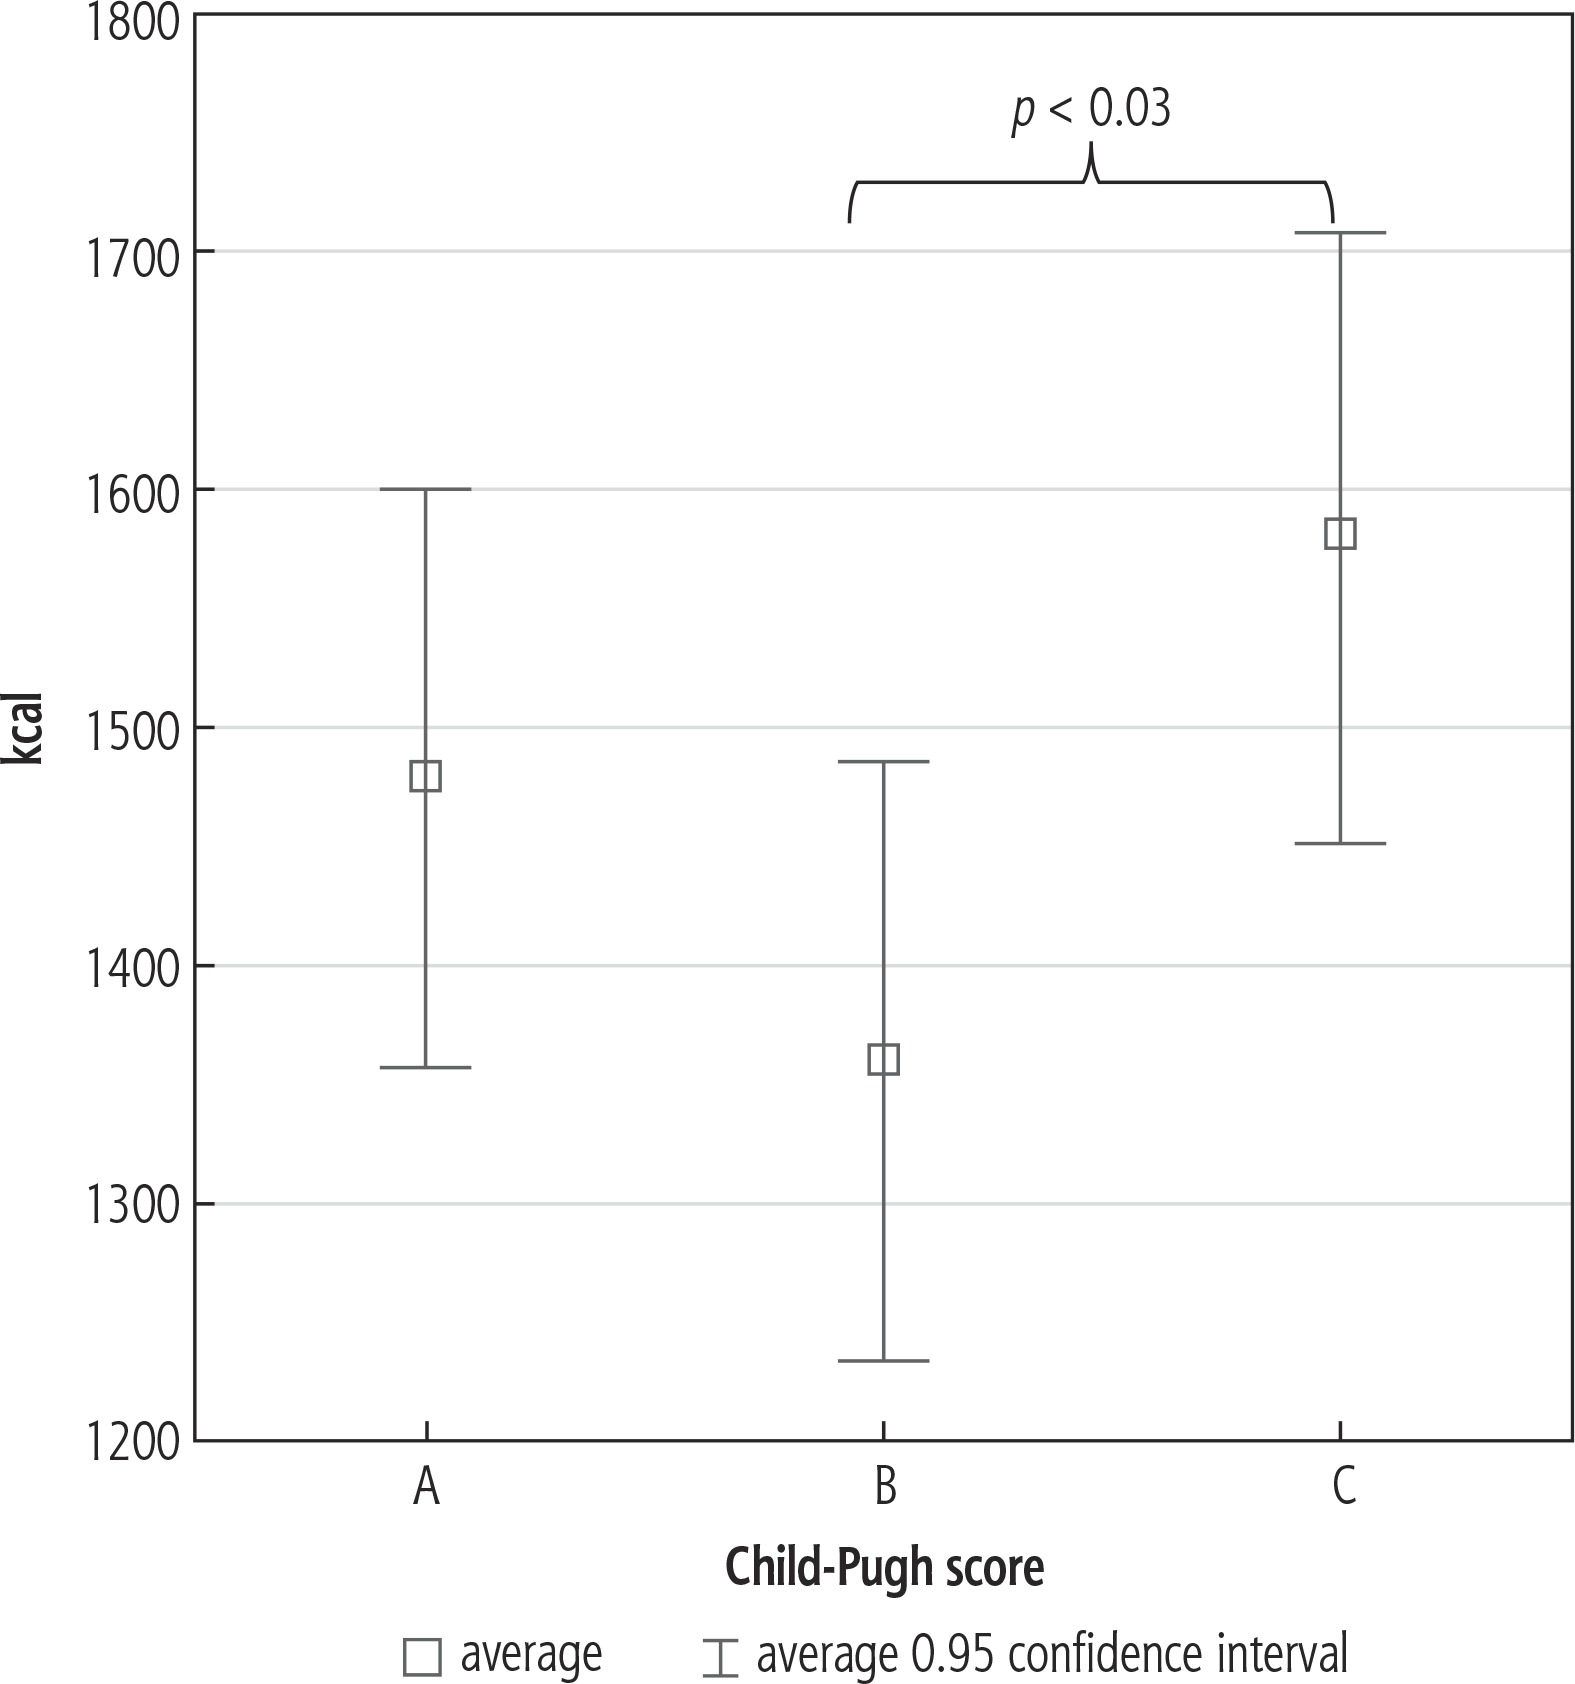
Depending on sex and liver injury level, individual basal energy demand was calculated, taking into consideration basal physical activity of patients. The highest basal metabolic rate (BMR) was found in patients with the most advanced liver injury. Among the patients in group C, energy demand was significantly higher compared to patients in group B (Fig. 1).
The test evaluating body composition showed that average fatty tissue content (30 ±9%) was the highest among patients in group A, then in group B (29 ±9%) and C (24 ±8%). The differences were not statistically significant.
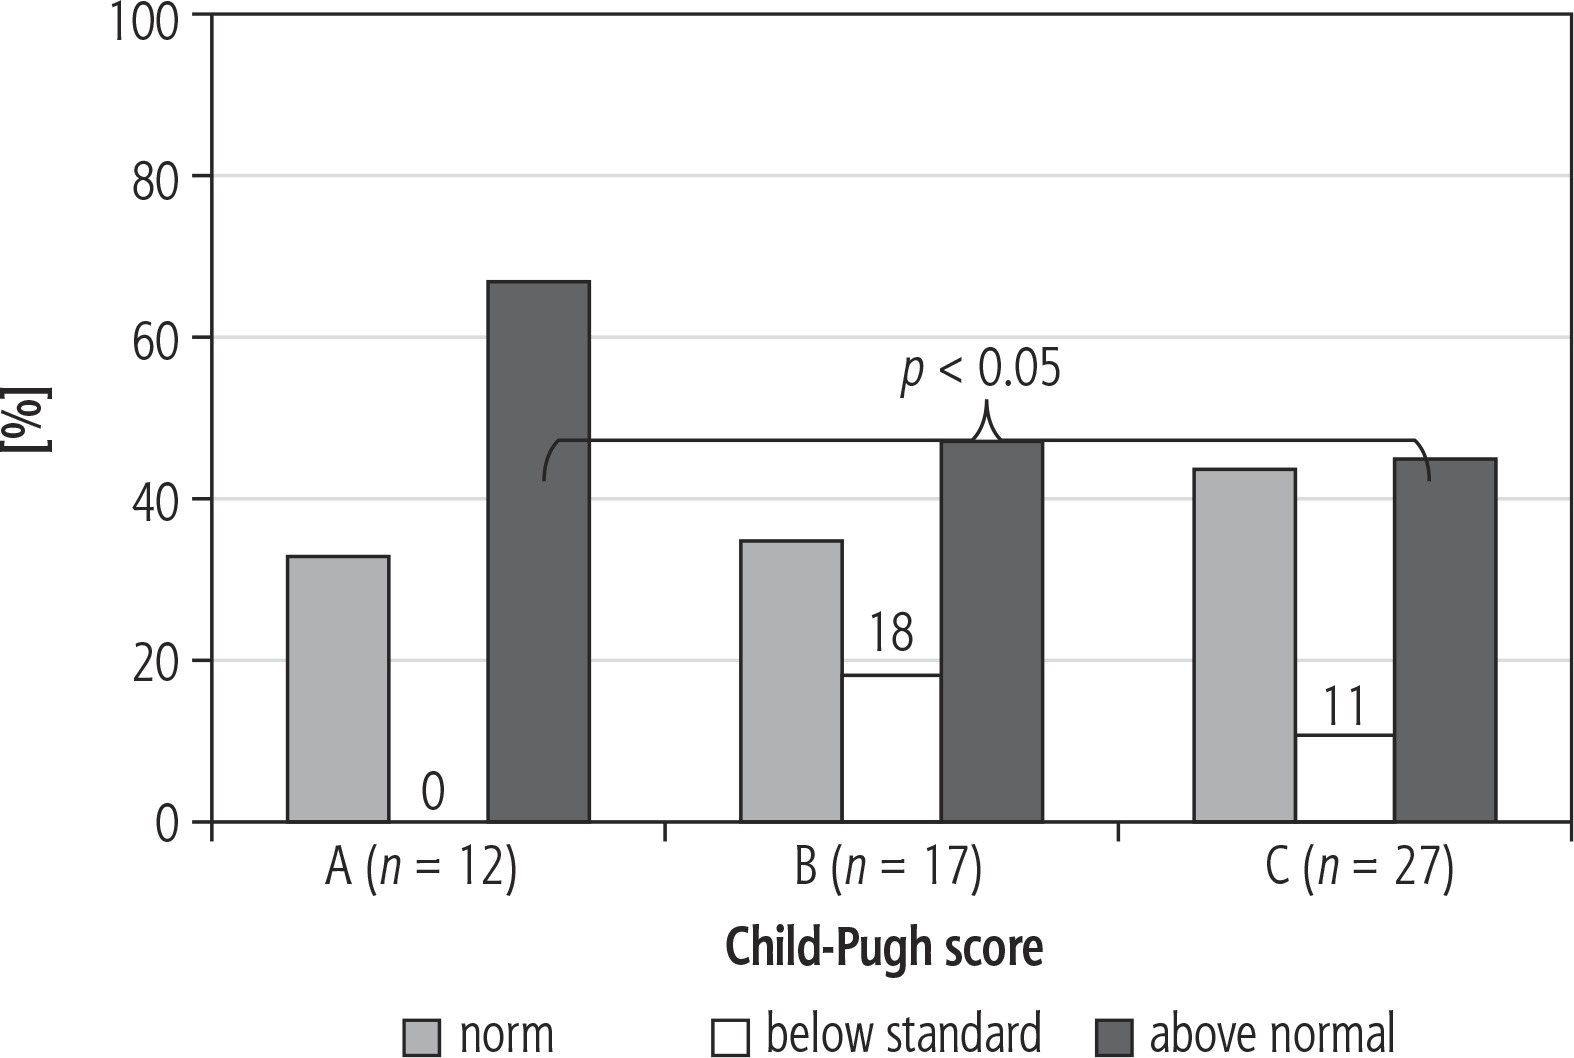
Percentage estimation of fat tissue was supplemented by its analysis in relation to normal values in individual patients. Fatty body mass was estimated by bioelectrical impedance and the individual normal limit for the given patient was established [5]. Fatty tissue deficiency was found in 11% of patients in group B and 18% in group C. Group A did not contain patients with fatty tissue content deficiency.
A statistically significant difference in the incidence of patients with the percentage content of fat tissue in group A compared to patients in group C was found (Fig. 2).
Lean tissue content was the highest in groups C (76%), B (71%) and A (70%), respectively.
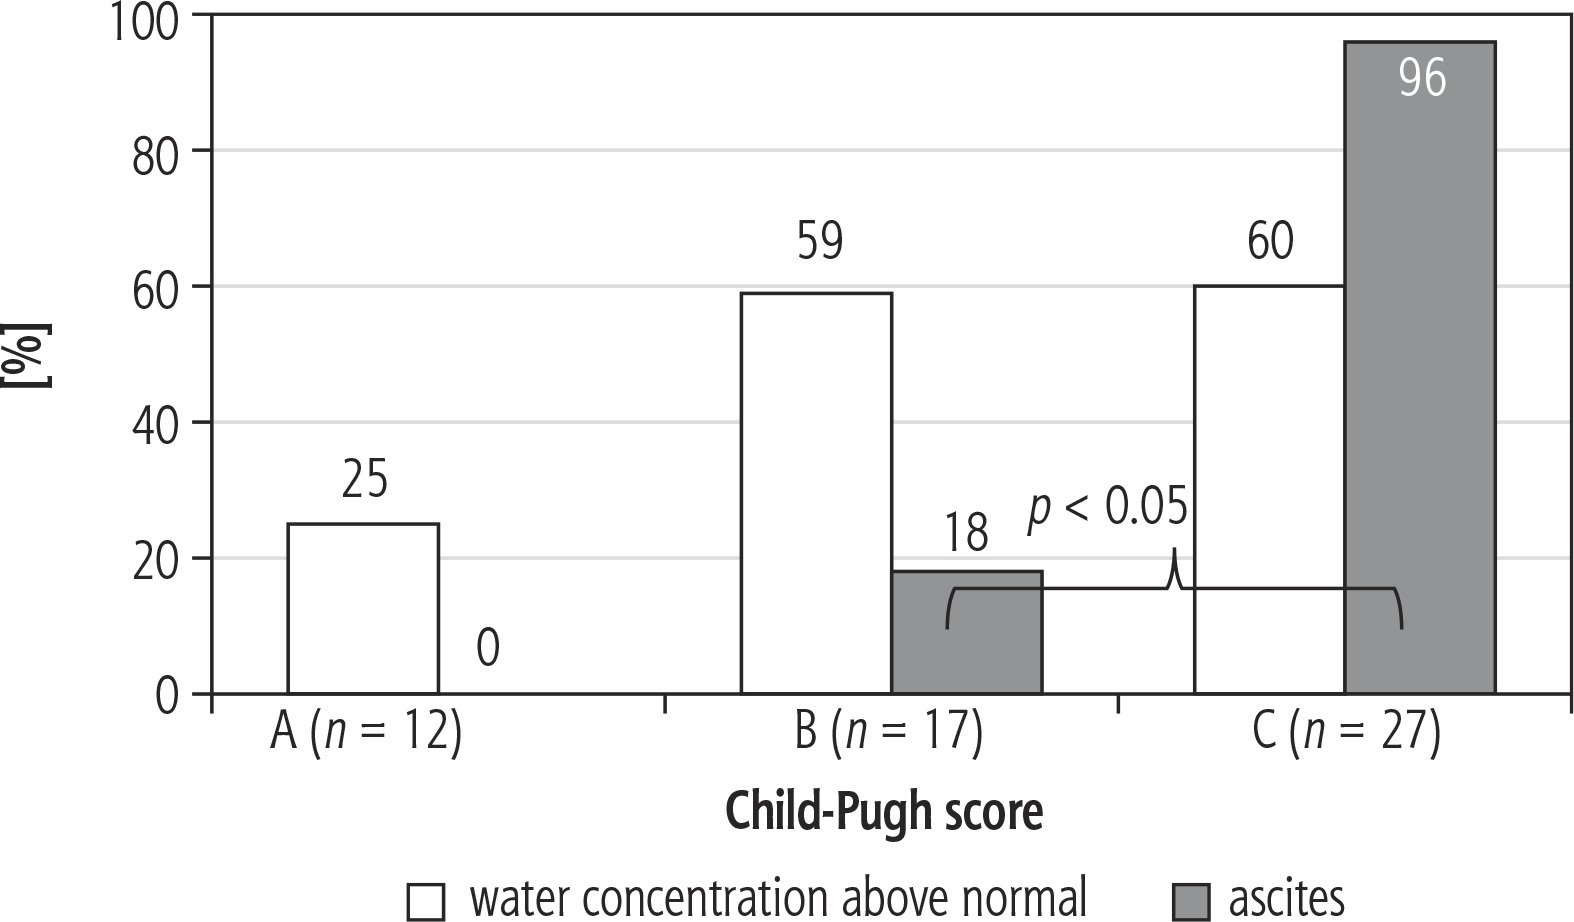
A difference in incidence of fluid excess between patients in group B and C was not found (59% vs. 60%). Among patients in group A, fluid excess was detected in 25%. In 26/27 patients in group C ascites was diagnosed. Incidence of ascites in relation to incidence of fluid excess was divergent in patients in group B and C (Figs. 3 and 4).
Discussion
Treatment of liver cirrhosis requires not only pharmacotherapy, but also proper dietary treatment. Information on body composition of patients with liver cirrhosis is rarely found in scientific reports. This fact results from difficulties of testing patients who accumulate fluids in the course of a pathological condition. Use of modern measurement methods allows for accurate estimation of fatty body mass, lean body mass, fluid content and basal metabolic rate.
BMI calculation is thought to be an indicator of therapy efficacy as well as probability of mortality. Decrease of this index is a favorable factor of disease progression [6]. Kok et al. observed much higher incidence of septic shock and death in patients with high BMI, among patients with liver cirrhosis [7]. In our own studies, we did not find BMI differences in individual evaluated groups of patients. It seems that BMI differences between the patients with ascites before and after paracentesis or high doses of diuretics are not reliable information for the estimation of overweight and nutritional status of patients with liver cirrhosis. In our own research, we found malnutrition based on BMI calculation in only 7% of patients with liver cirrhosis.
The study of Yasutake et al. showed that 76.6% of patients with liver cirrhosis demonstrate malnutrition at different stages [8]. Belarmino et al. created a special model, which they used to prove that evaluating the nutritional status in patients with liver cirrhosis is an effective and simple tool for making the prognosis of patient’s survival [9]. Nutritional status of such patients was determined using anthropometric measurements and biochemical testing. In the study of Maharshi et al. malnutrition was found in patients belonging to Child-Pugh A (44.5%), B (73.3%) and C (94.4%). The same authors demonstrated a correlation between malnutrition and the frequency of hospitalization and mortality [10]. Testing for albumin concentration is a good marker of nutritional status of patients with liver injury. Albumin concentration correlates well with mortality of cirrhotic patients, especially in the group of patients aged over 50 years [11]. In our own research, we found malnutrition on the basis of albumin concentration in 83% of patients, which is close to observations reported by Maharshi et al. It is noteworthy that among our patients in class C, malnutrition was found in all the patients.
Basal metabolic rate is the lowest energy that our organism requires to maintain basic life functions. It allows maintenance of normal cellular metabolism, water-electrolyte balance, heart function, and function of respiratory muscles and the secretory and excretory systems. In our own research, the highest basal metabolic rate was found in patients from class C, according to Child-Pugh. A statistically significant difference in energy demand between this group and patients from class B was found.
Basal metabolic rate is only one of the components of total energy demand of our organism. Among patients with liver cirrhosis, energy deficiency is supplemented by burning muscular tissue, which is a serious complication of the disease. Only proper dietary supplementation may hinder this process [12].
Fatty tissue functions as a store of energy in the organism. When malnutrition occurs, energy is derived from the metabolism of this tissue. Fatty tissue is responsible for thermoregulation and hormonal turnover, including the phenomenon of insulin resistance, which is often diagnosed in patients with liver cirrhosis. All these processes are disturbed in patients with long-lasting malnutrition, in which energy is produced from burning fatty tissue.
In normal conditions, storage and release of lipids is coordinated with triglyceride metabolism in the liver and other tissues. Fatty tissue depletion in the case of lipodystrophy leads to fatty liver, and in effect, to metabolic disturbances [13]. Insulin stops lipolysis of fatty tissue and thus, insulin resistance in patients with liver cirrhosis occurs frequently and is a negative prognostic factor [14].
In our opinion, fatty body mass was comparable in all the groups. However, basal metabolic rate was the highest in class C patients. These observations suggest that in this group of patients very fast loss of fatty tissue may occur.
Lean body mass is correlated with the estimation of muscular tissue in the organism. Dietary deficiencies present among patients with liver cirrhosis influence energy generation from fatty tissue, but also degradation and wasting of muscular tissue. Muscle wasting caused by too low physical activity is an additional factor influencing decreased lean body mass. Muscle wasting leads to metabolic use of muscular proteins. Aromatic amino acids resulting from such processes contain a high amount of nitrogen groups, which are biochemically processed to form ammonia, an important encephalopathic factor.
Water constitutes around 50-70% of an adult organism’s body mass. With age, water content in the organism falls. Water is necessary for normal function of tissues and organs. Increase of fluid content in patients with liver cirrhosis may point to prompt occurrence or exacerbation of ascites [15].
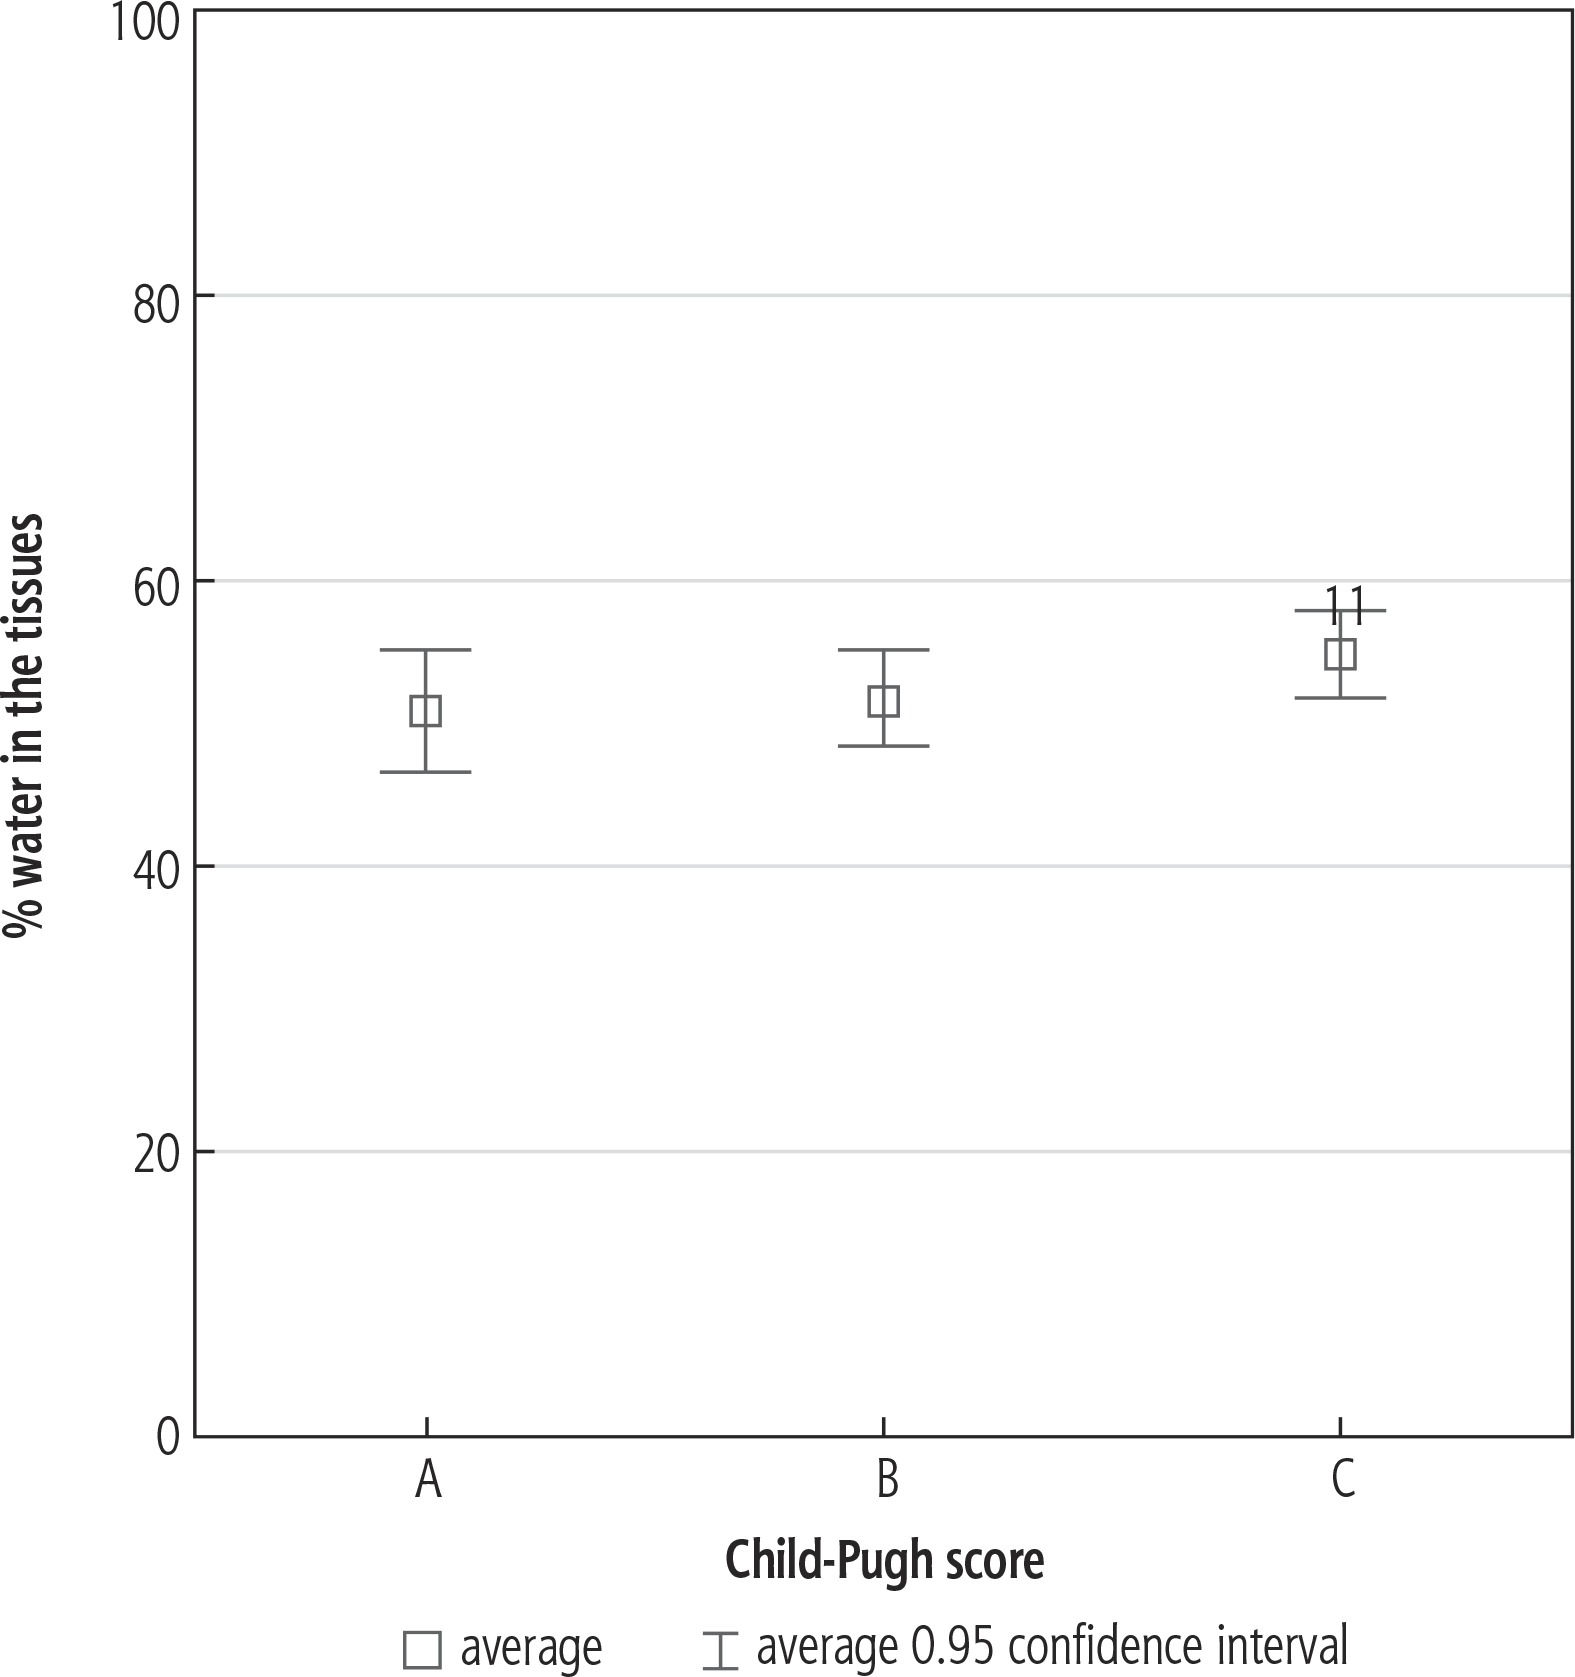
In our studies, fluid body content in class A was below the normal lower limit, while in class B and C it exceeded the established upper limit for evaluated patients. Evaluated fluid content does not include fluids in other confined spaces, such as the pleural space or peritoneum. Diuretics, of any possible mechanism of action, decrease fluid content in the organism. Strong activity of diuretics may cause a significant decrease of fluid body content. Low colloid osmotic pressure in the vascular bed and high pressure in the portal system in patients with liver failure favor water passage from the vascular bed into the pleural space and peritoneum. Diuretic abuse may lead to dehydration and, in effect, increase of the concentration of encephalopathic factors in blood. Considering the risk connected with diuretic abuse, as well as adverse effects possibly occurring after paracentesis of several liters, i.e. the possibility of hepatorenal syndrome, the system of removal of peritoneal fluid using the alfapump attracts increasing attention [16]. This system allows for safe removal of peritoneal liquid, without occurrence of adverse effects [17]. Activity of the system causes no change in the percentage of water content in the patient’s tissues. The system removes only liquid from the peritoneal space.
Conclusions
Among patients with liver cirrhosis, malnutrition occurs in over 80% of patients, and its incidence increases with the progression of liver insufficiency. Patients with liver cirrhosis, especially those belonging to class C according to Child-Pugh, show high energy demand connected with the basal metabolic rate. Water excess is found in all patients with liver cirrhosis, but is not directly correlated with ascites.


